-
农村生活污水按照其污水来源和水质特征的不同,可以分为黑水和灰水两大类[1],其中黑水是含有粪便和尿液的污水,其污染物质量浓度高、氮磷含量丰富,适合进行农田资源化利用[2-4],灰水主要包括餐厨污水、洗涤污水和洗浴污水等,其污染物质量浓度较低,适合进行收集处理后排放[5-7]。针对黑水和灰水的特点,许多农村地区开展了黑水和灰水的分质收集,即采用化粪池收集处理黑水用于农田利用,采用重力流排水系统单独收集灰水进行处理并排放[8-10]。
排水系统在输送污水的过程中,污水中一部分悬浮微生物会附着在系统内壁并利用污水中的有机物进行生长繁殖,逐渐形成管道生物膜[11-12]。污水中的悬浮微生物和管道生物膜共同作用可以去除污水中的部分有机物,产生一定的污水预处理效果[13-15],但同时也会产生H2S和CH4等气体产物[16-17]。其中,H2S是具有恶臭的有毒气体[12,18],其与污水中携带并逸散到排水系统气相中的其他恶臭气体在排水系统内的聚集可能影响周边居民的正常生活[19-21]。除H2S以外,恶臭气体还包括苯乙烯(C8H8)、氨气(NH3)、三甲胺(C3H9N)、二甲基二硫醚(C2H6S2)、甲硫醚(C2SH6)等[18, 22-23],其在排水系统中的积聚和逸散是一个在工程实践过程中普遍发生的问题。为解决这一问题,有关研究团队开展了一系列研究[24-26],指出了灰水收集系统具有H2S等恶臭气体积聚的风险[17,27]。但除H2S以外,灰水收集系统的气相中是否还存在其他恶臭气体仍有待确认。更进一步的,灰水收集系统中恶臭气体的分布规律尚不明晰,限制了灰水收集技术的改良和运维管理措施的优化,亟待开展相关研究。
为获得农村灰水收集系统的恶臭气体分布及传输规律,本研究以相关中试装置为载体,利用恶臭分析仪器和数理统计方法探究装置全流程的恶臭气体时空分布规律,以期为农村重力流灰水收集系统的技术优化和运维管理提供数据支撑。
-
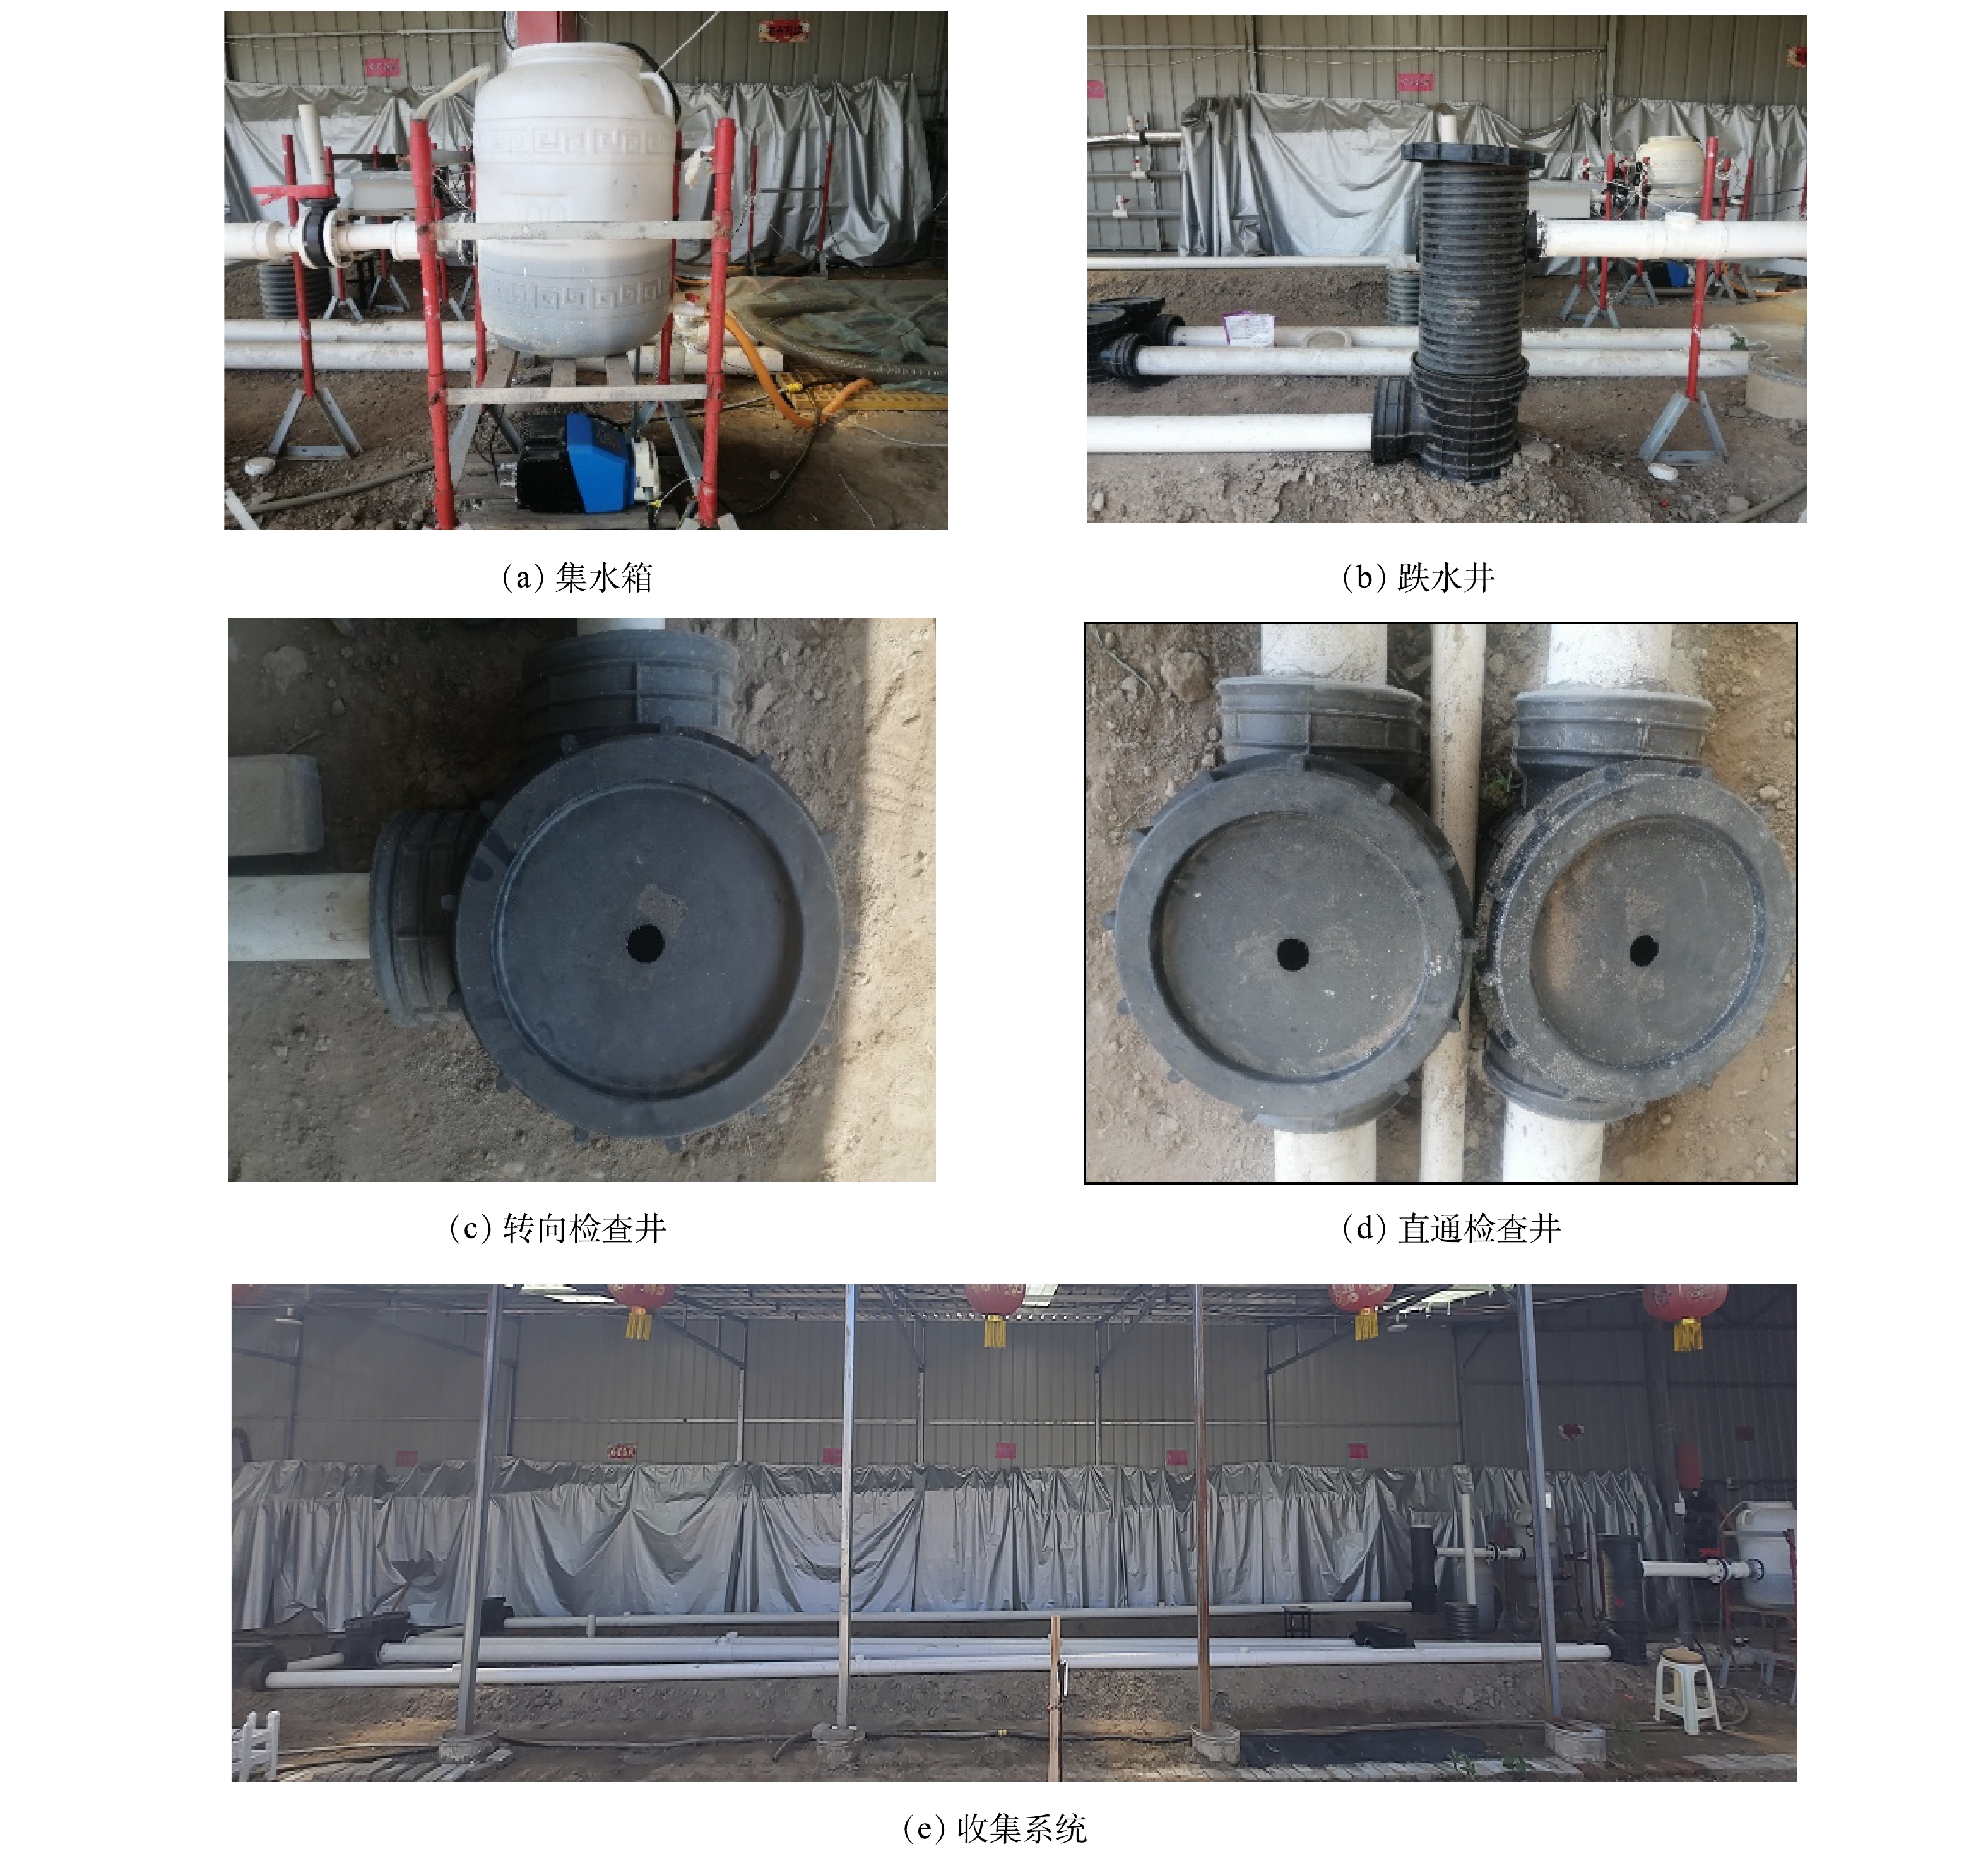
1)灰水管道实验装置。中试装置(图1)由储水池(1 m×1 m×3 m,混凝土)、集水箱(φ500 mm×80 mm,HDPE)、跌水井(φ315 mm×200 mm,PE检查井;φ315 mm×2.5 mm,HDPE波纹管)、UPVC排水管道(φ110 mm×2.8 mm,φ160 mm×2 mm,联塑,中国)、PVC检查口(235 mm×110 mm×95 mm,278 mm×160 mm×95 mm,联塑,中国)、PE转向检查井(φ315 mm×200 mm,世腾)、PE直通检查井(φ315 mm×200 mm,世腾)、回水池(1 m×1 m×3 m,混凝土)和蠕动泵(WT600-4F,兰格)组成,单套管线长度为30 m,管线装置坡度设置为10‰,在每个检查井与跌水井在井盖处进行打孔以模拟污水检查井的井孔(图2)。
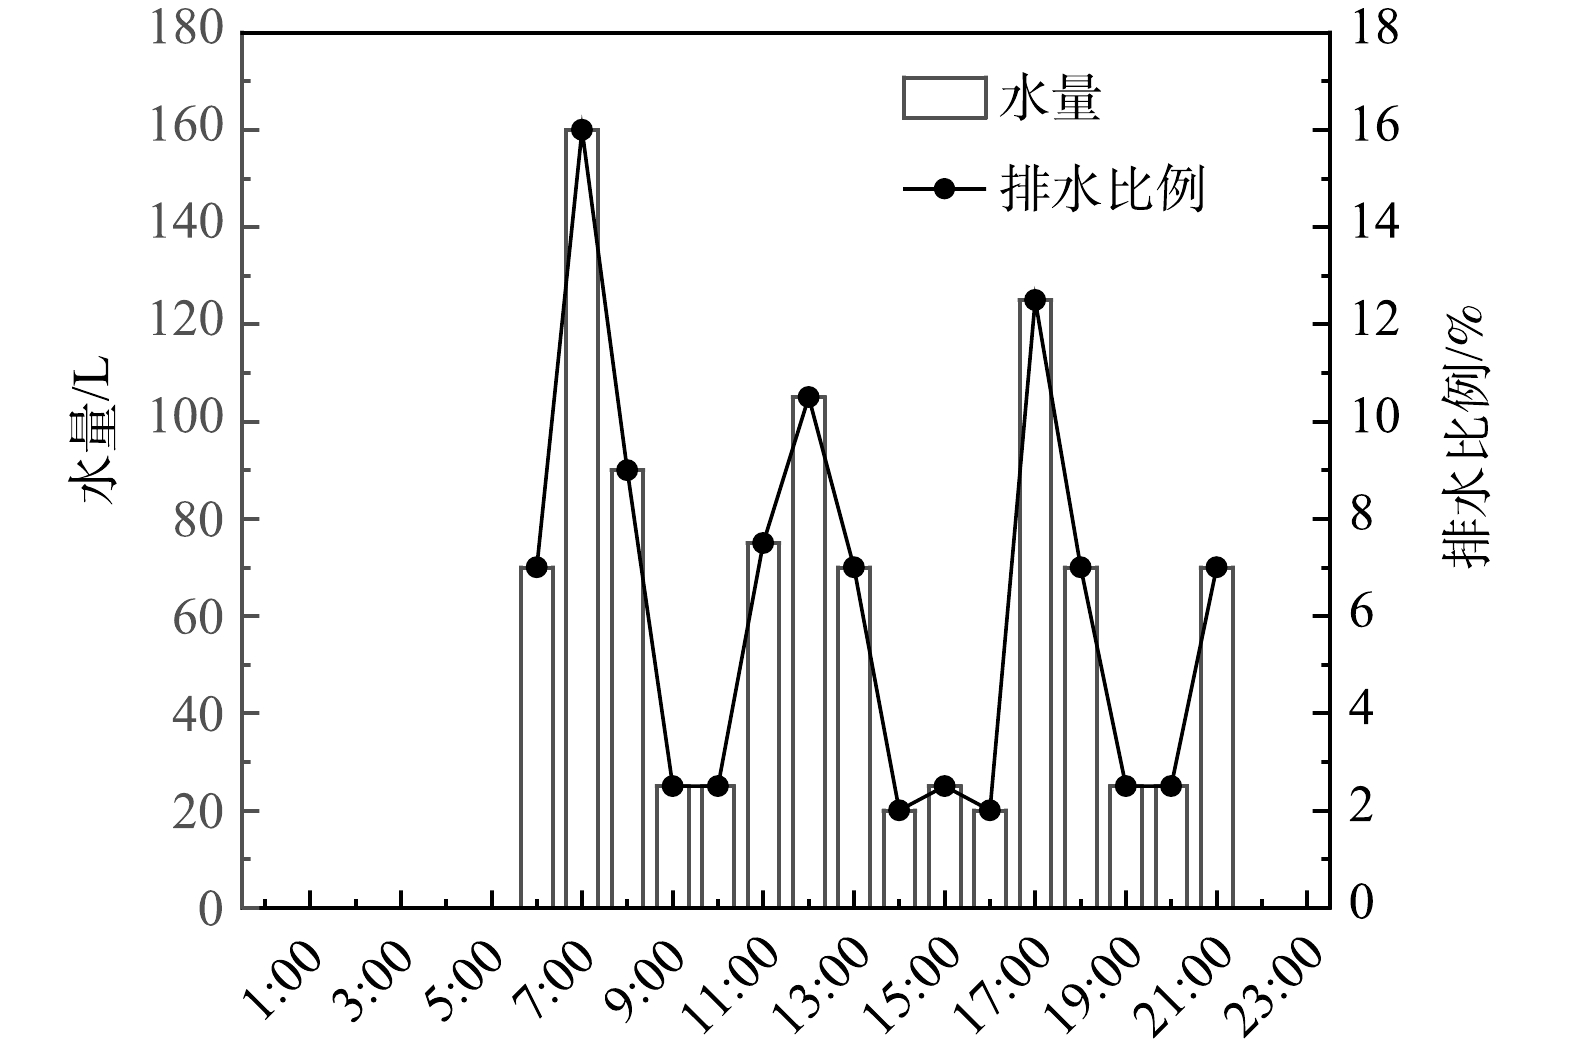
2)实验用水及运行条件。本实验用水采用农村真实灰水,基本水质参数见表1。根据农村地区污水产排特征及《农村生活污水处理技术验证评价规范T/CSES 19-2021》,本装置设计灰水收集规模为1 t,即服务户数为10户,每户3~4人,排水量为每人25 L·d-1。为准确反映农村排水的周期性,本装置采用时变流,如图3所示。
-
1)检测点位。对装置沿程进行恶臭布点检测,检测点位分为开放与封闭2个区域,其中开放区域包括储水池、集水箱、跌水井、检查井、回水池等,封闭区域包括管道检查口(3个),如图1所示。除储水池(储水池单独检测)外,其余点位的检测时间为每天的5:00—6:00、6:00—8:00、11:00—13:00、17:00—19:00、22:00—23:00,检测时长为一个月(8月3日—9月3日,每周检测4次,每次单个点位检测3次)。
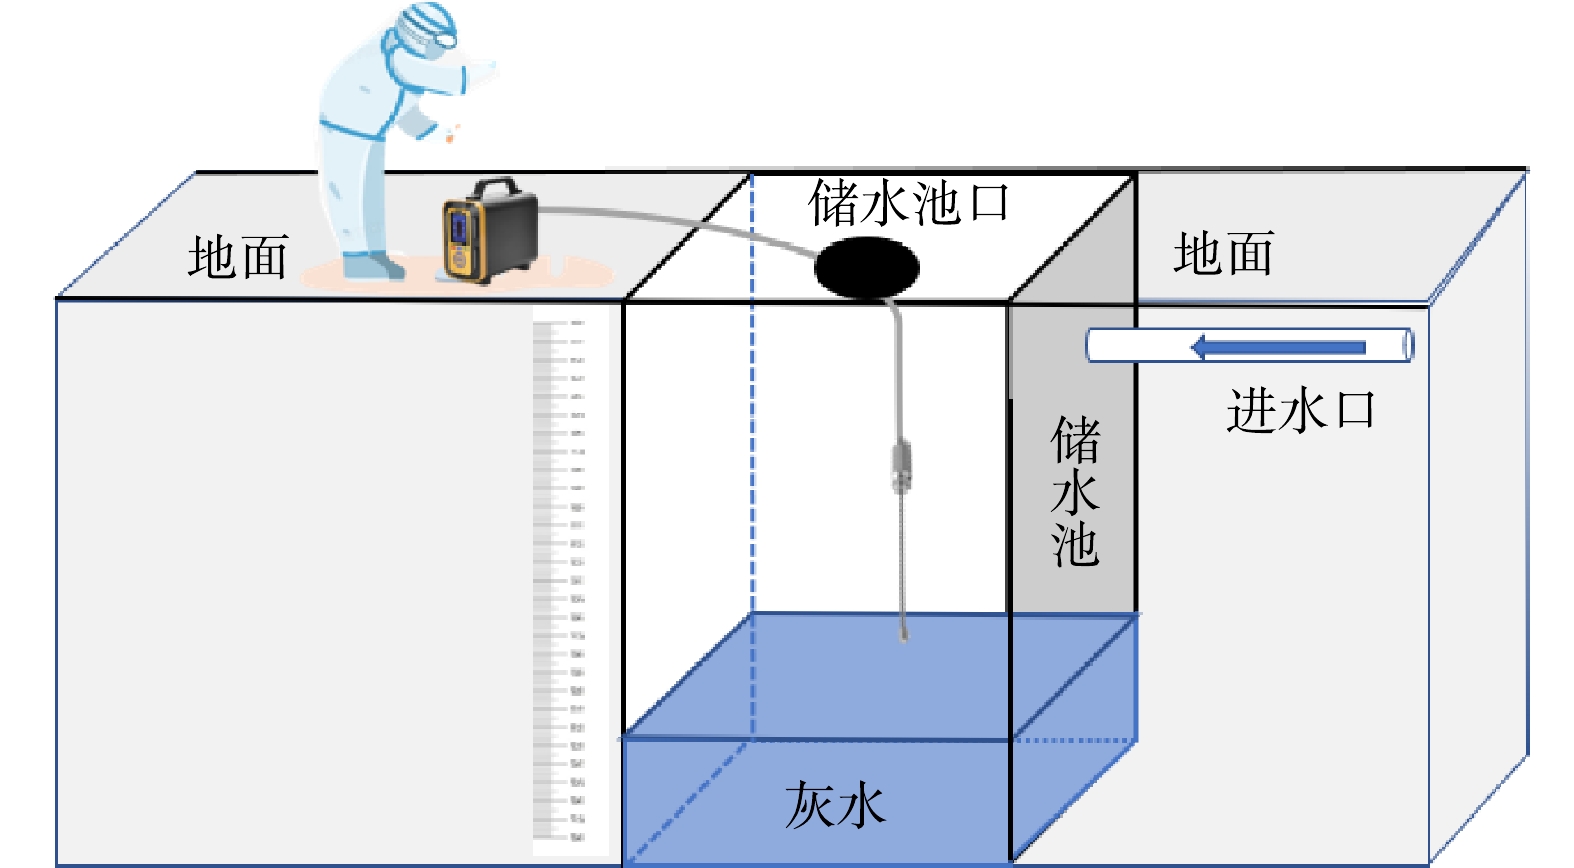
2)检测指标与检测方法。恶臭检测指标分别为臭气(OU)、硫化氢(H2S)、苯乙烯(C8H8)、氨气(NH3)、三甲胺(C3H9N)、二甲基二硫醚(C2H6S2)、甲硫醚(C2SH6)[15-16, 21],采用PTM600手提式气体分析仪(深圳市逸云天电子有限公司,中国)进行检测[28]。对储水池恶臭的具体检测方法如图4所示,将气体分析仪吸气管分别放在距离地面1.5、1.2、1.0、0.7、0.5、0.3 m处测3次,取平均值。对其他点位恶臭的检测方法为直接将气体分析仪吸气管放入污水收集系统排气口处进行检测。检测数据采用SPSS软件进行差异显著性检验(非参数Kruskal-Wallis H检验,P<0.05)和相关性分析(Spearman相关性,P<0.05)。
-
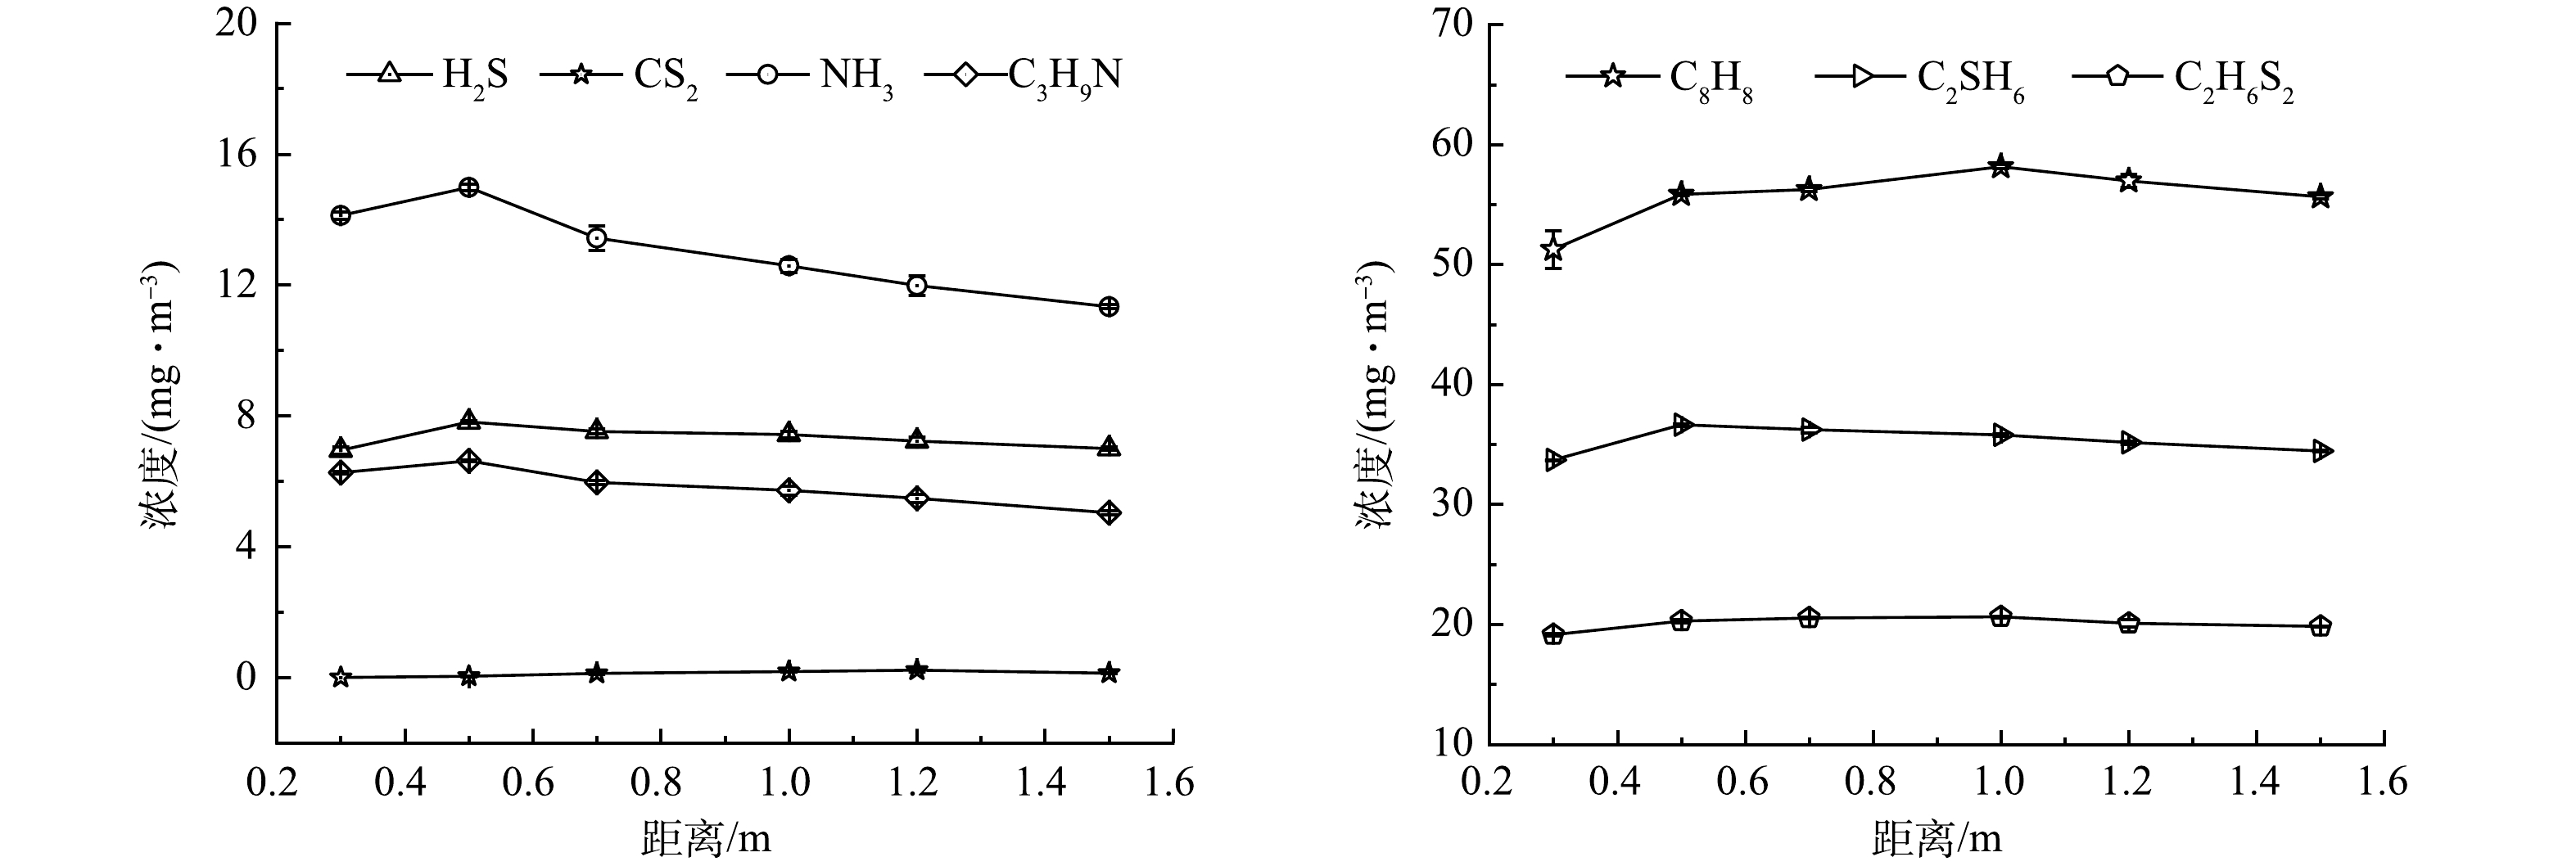
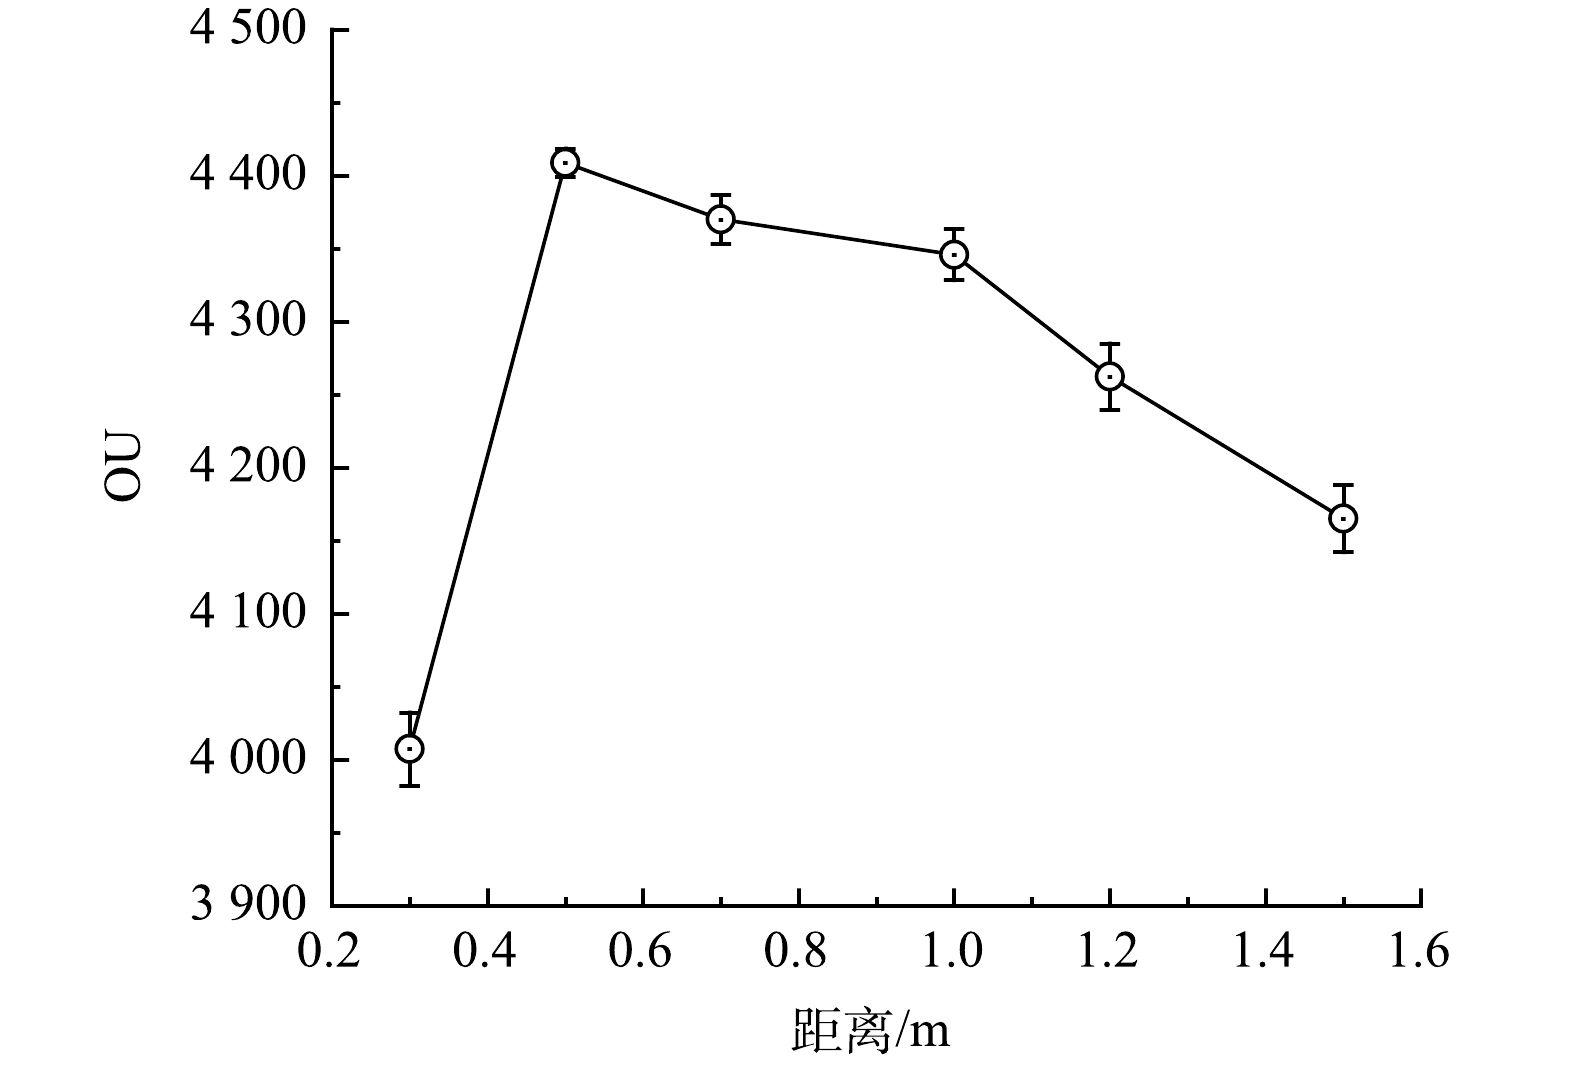
灰水储水池中的恶臭气体分布情况可以反映灰水在相对静止状态下的恶臭气体逸散情况,是灰水的本征恶臭气体逸散特征。由检测结果可知,储水池中H2S、C3H9N和NH3的最大质量浓度在距离地面0.5 m处,平均质量浓度分别为7.81、6.62和14.98 mg·m−3;最小质量浓度在距离地面0.3、1.5和0.3 m处,平均质量浓度分别为6.94、5.03和11.33 mg·m−3(图5)。CS2的最大质量浓度在距离地面1.2 m处,平均质量浓度为0.22 mg·m−3,最小质量浓度在距离地面0.3 m,平均质量浓度为0 mg·m−3。C8H8、C2H6S2和C2SH6的最大质量浓度区域分别为距离地面1.0、0.5和0.5 m处,平均质量浓度分别为58.15、20.27和36.63 mg·m−3;三者的最小质量浓度区域均为距离地面0.3 m处,平均质量浓度分别为51.2、19.12和33.69 mg·m−3。在静止的灰水储水池中,异味气体中CS2的相对密度最高,为2.64 g·cm−3,故所检测质量浓度的最高值出现在距离地面最远点,即主要分布于相对下方的空间;NH3(0.75 g·cm−3) 相对密度最小,其较高质量浓度值距离地面较近,即主要分布于相对上方的空间。恶臭气体的分布规律为:从水面到地面,恶臭气体的总体质量浓度趋势为先升高再降低,与张涛等研究趋势相同[23]。恶臭气体质量浓度分别为C8H8>C2SH6>C2H6S2>NH3>H2S>C3H9N>CS2。KNIGHT等[29]对C8H8在排水管道中的排放量进行了评估并确认了其存在潜在的暴露风险。本研究发现C8H8是灰水储水池中质量浓度最高的恶臭气体,其次是C2SH6,而CS2产生的恶臭质量浓度最低。WANG等[30]研发发现排水系统中质量浓度最高的异味气体是H2S(1 990.5~20 898 μg·m−3)或者C2H6S2(675~11 380.2 μg·m−3)。SIVRET等[31]对不同地区排水管道异味气体进行调研发现,质量浓度最高的异味气体为H2S和甲硫醇(CH4S)(293~18 300 μg·m−3)。PANDEY等[32]调查了污水井和雨水井,发现质量浓度最高的异味气体也是H2S和CH4S。此外, HUANG等[33]在下水道中鉴定出质量浓度最高的异味气体为挥发性有机物(VOCs),具体包括卤代化合物、芳香类化合物和烷烃。因此,不同时间、不同地区的排水系统的异味种类、质量浓度各有不同。C8H8属于苯系物中的一种,TEIXEIRA等[34]对污水处理厂室内空气进行了评价,在VOCs中甲苯的质量浓度最高,说明苯系物与污水存在直接关联[35]。苯系物属于内分泌干扰物[36-37],其具有毒性且挥发性高,易被肺吸收进而对人类健康造成不良影响,因此,在灰水重力流收集系统中,C8H8是一项需要重点关注的指标。灰水储水池的臭气(OU)变化趋势为:从水面到地面,OU先上升再下降,灰水的最大OU在距离地面0.5 m处,为4 408,最小OU在距离地面0.3 m处,为4 007(图6)。灰水储水池的臭气在贴近水面处质量浓度最低,臭气主要集中储水池距离地面约0.5 m处,因此,在工人下池检修前,不仅要对储水池贴近水面处的有害气体进行检测,也要重点关注池体上边缘下方0.5 m处的有害气体质量浓度。
-
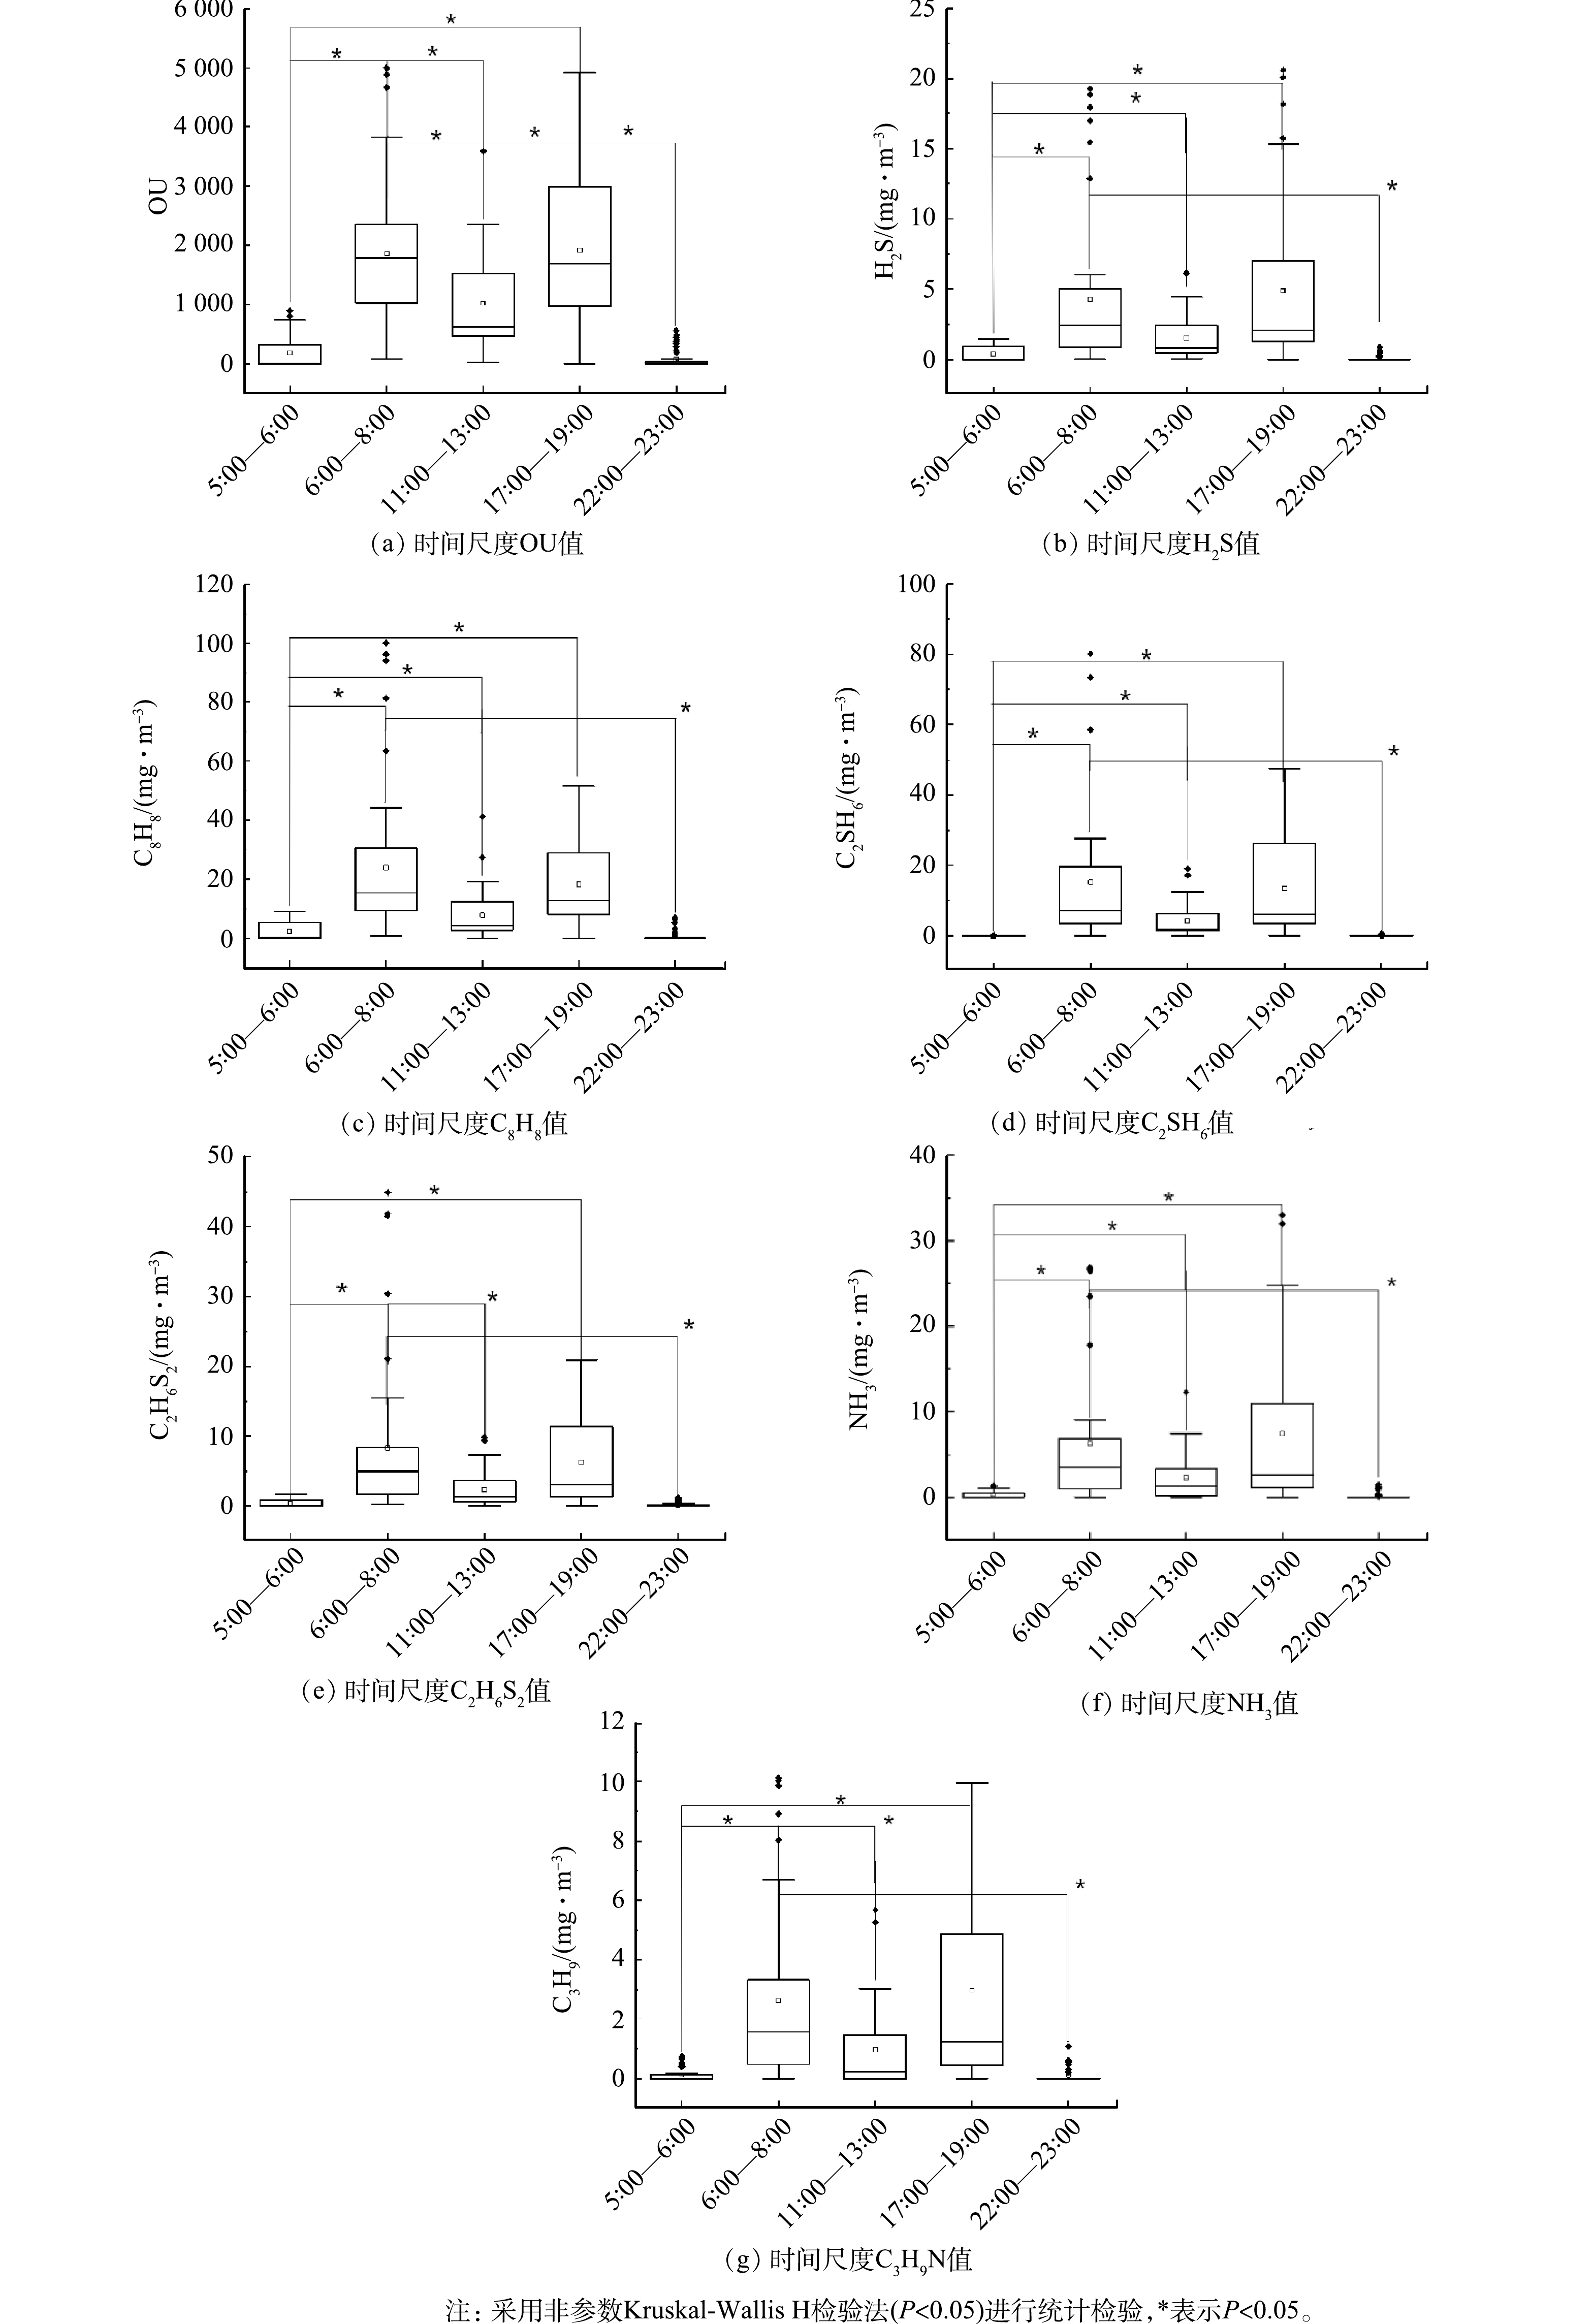
农村重力流灰水收集系统的恶臭气体在不同时间段的分布规律如图7所示。恶臭气体的总体质量浓度分布规律为“M”形,即早晨(7:00—8:00)以及傍晚(17:00—18:00)恶臭气体质量浓度较高,其OU平均值分别是其他时段OU平均值的1.82~23.7倍和1.87~24.41倍,中午(12:00—13:00)恶臭气体质量浓度相对较低,而清晨(5:00—6:00)和夜间(22:00—23:00)的臭气体质量浓度最低,这与农村灰水的时间排放特征有关。OU、C8H8、C2SH6、C2H6S2、NH3、H2S和C3H9N在早晨、中午和傍晚的质量浓度超过《恶臭污染物排放标准GB 14554-93》中排放限定值,而在清晨和夜间质量浓度不超标,这一现象与农村用水习惯有关。根据相关性分析结果(表2)可知,时间尺度上的恶臭气体质量浓度变化与水量变化具有显著正相关性。农户早晨、中午和傍晚会产生较多的污水[38-39],收集系统中的恶臭气体质量浓度随水量的提升而升高,水量提升加大了水流的湍动,也提高了水管中运行水位,使得管道充满度增大,进一步促进了恶臭组分向空气中逸散[40],因此收集系统在该时间段逸散的恶臭质量浓度较大。对5个时间段的OU、H2S、C8H8、C2SH6、C2H6S2、NH3和C3H9N值进行差异显著性检验发现,该5个时间段的恶臭气体质量浓度存在极显著差异(P<0.001),这从数理统计的角度确认了农村重力流灰水收集系统的恶臭气体质量浓度确实呈现显著的M形时间分布。
-
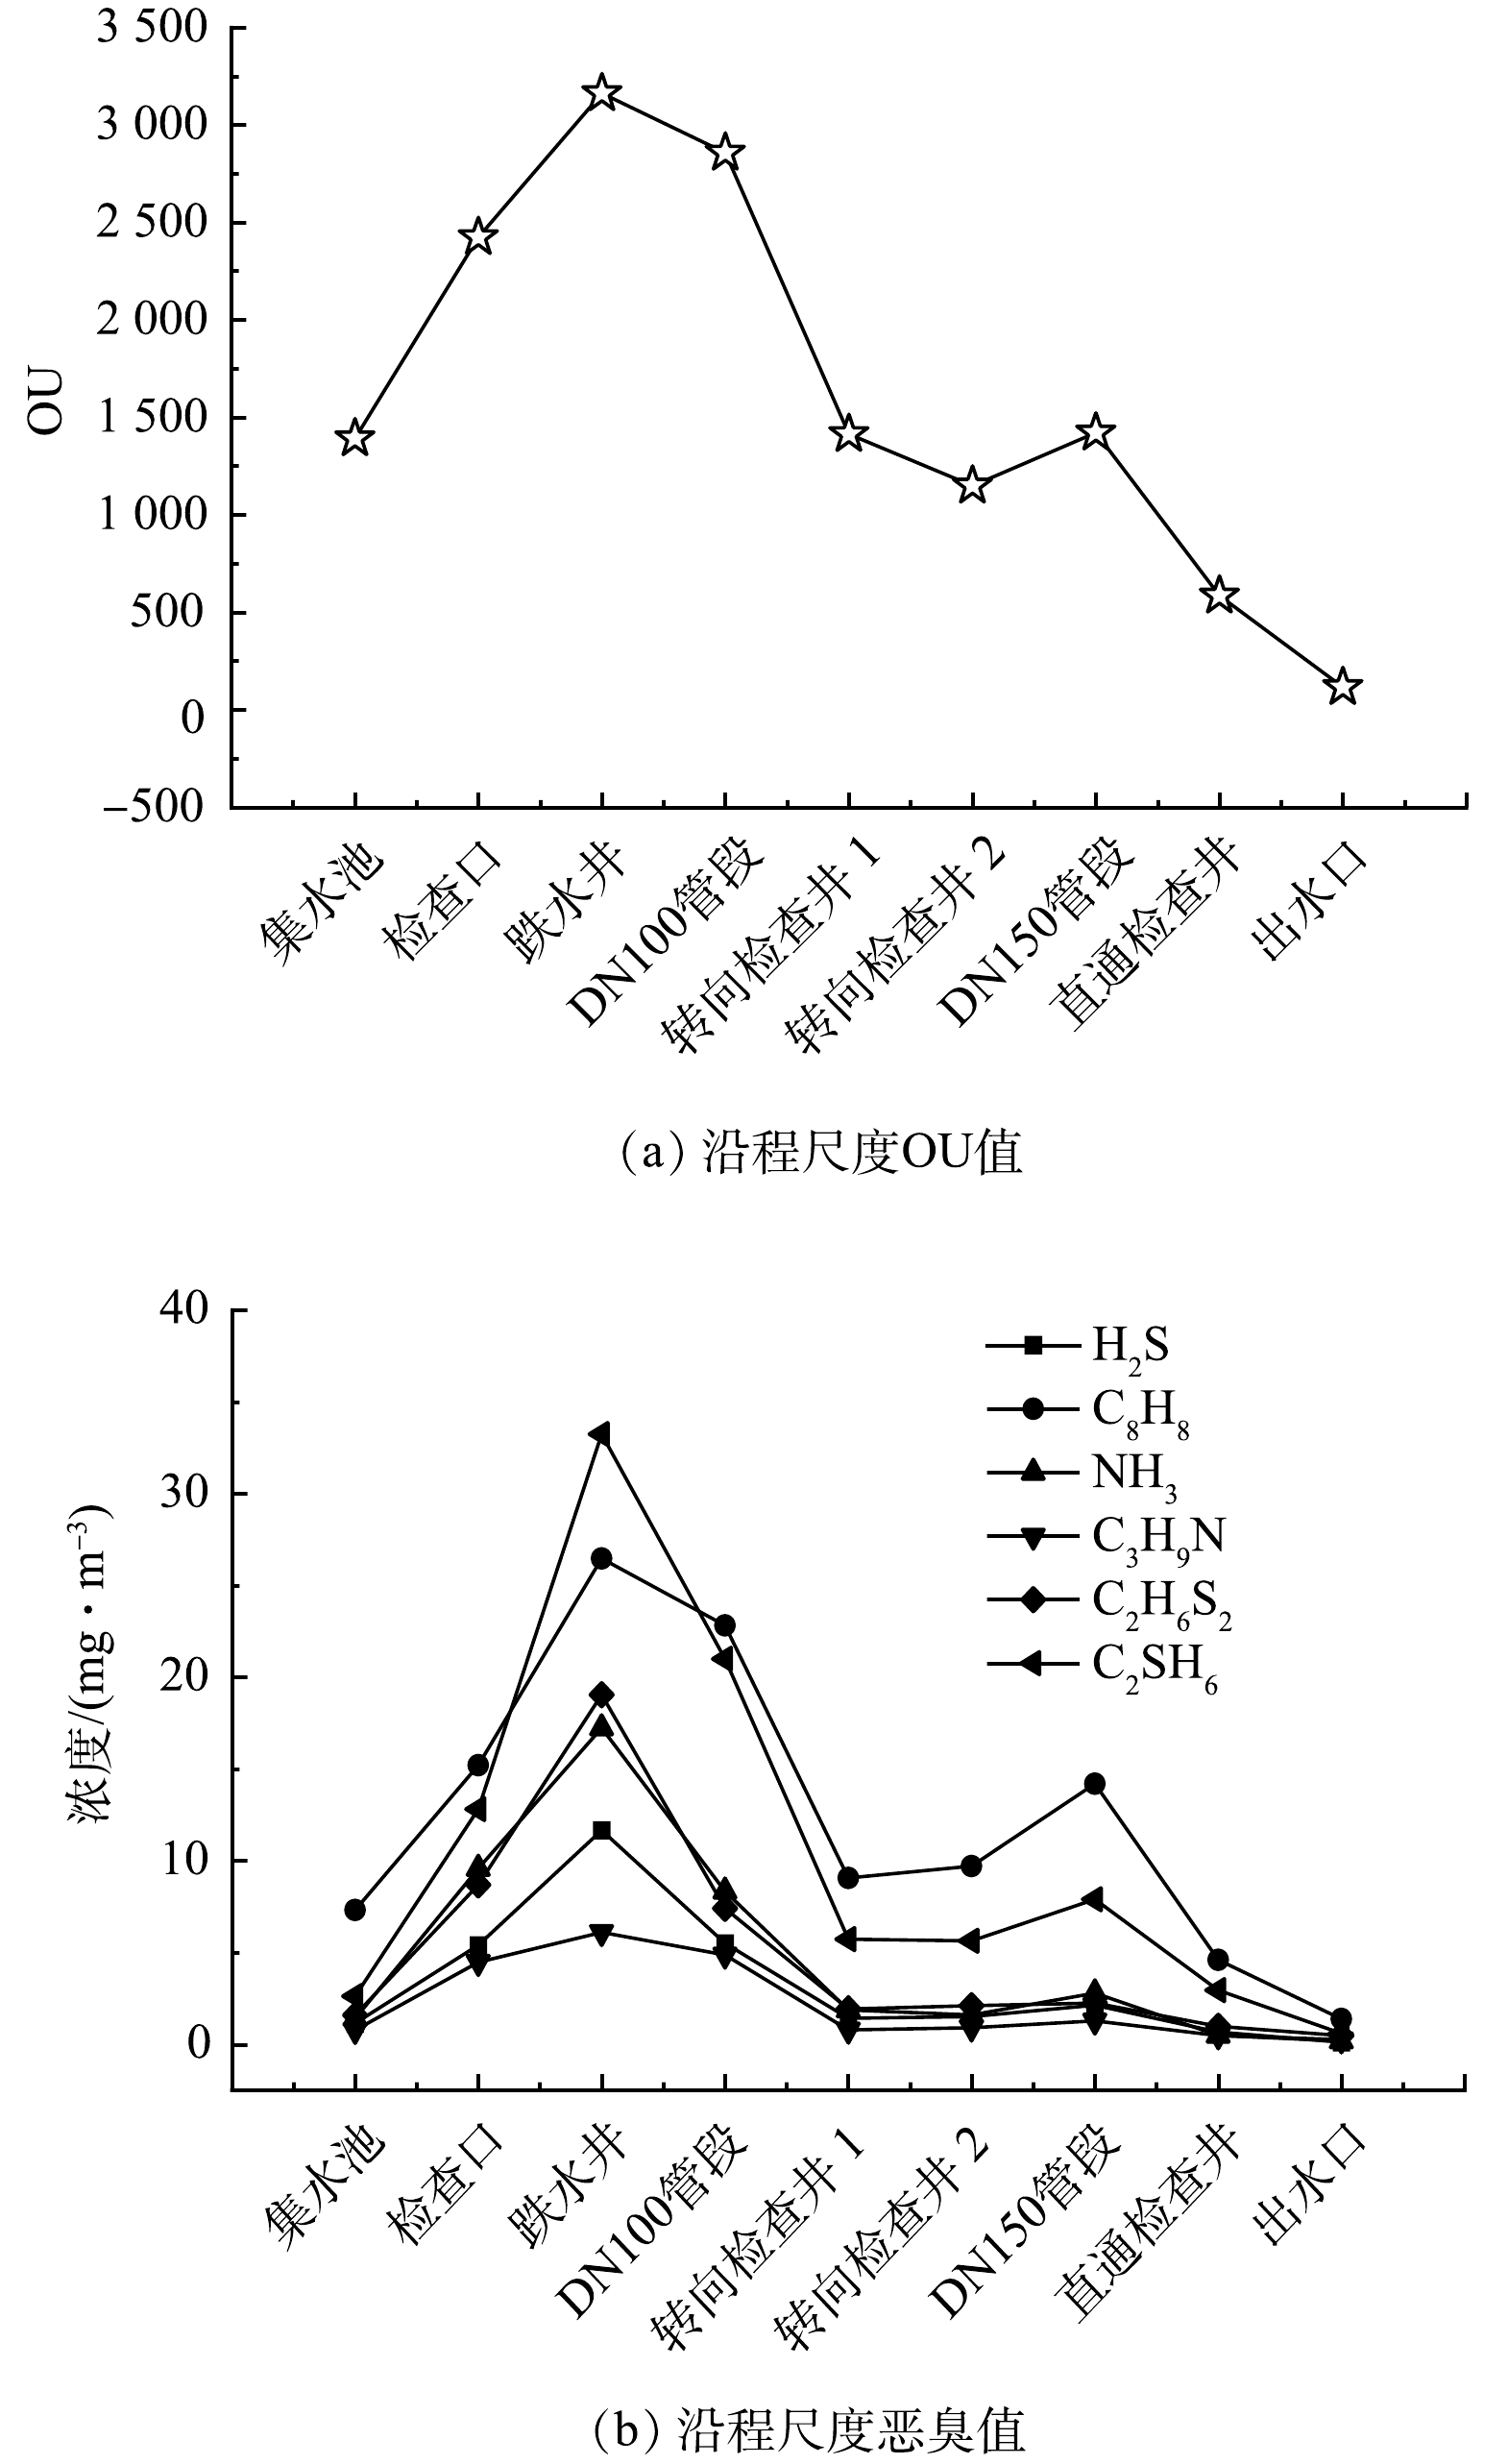
选择排水量最大的时间段(早晨6:00—8:00)对农村重力流灰水收集系统进行恶臭气体沿程检测,具体数据见表3。如图8所示,不同恶臭气体在空间上的整体趋势亦表现出M形特征,即恶臭气体质量浓度最大值出现在跌水井处,跌水井下游恶臭气体质量浓度迅速下降,待到收集系统变径时(即由DN100扩大至DN150)恶臭气体质量浓度又明显上升,而后质量浓度继续下降。具体而言,灰水收集系统最大OU值出现在跌水井处,约为3 200,为其上下游区域平均值的1.2倍,最小值在系统出口处,约为50,二者相差了64倍。OU值的另一个明显高峰出现在管道变径处(即由DN100扩大至DN150),其平均OU值是其上下游区域平均值的1.6倍。整体而言,灰水系统恶臭气体主要集中在跌水井附近,这是因为跌水造成的剧烈湍动和水气物质交换迫使灰水中的恶臭组分大量向收集系统气相逸散[40]。管道变径处的恶臭气体质量浓度上升是因为此处因管径陡然增大造成了空气流速降低、不利于恶臭气体随灰水表面的拖曳力向下游传输[41],造成了局部恶臭气体的积聚。在本研究中,所有恶臭气体的质量浓度在跌水井处均达到最大值,其中C2SH6质量浓度最高,约为33 mg·m−3,是其他部位质量浓度的1.58~55.38倍。有研究[31]表明,C2SH6是污水挥发性硫化物(VSCs)中典型的恶臭气体之一,其对呼吸系统、眼睛及皮肤有强烈刺激性,易造成头痛、恶心和呕吐[42]。C8H8在跌水井的质量浓度仅次于C2SH6,约为26 mg·m−3,是其他部位质量浓度的1.16~19.04倍。C8H8在收集系统沿程的浓度变化较大,但其沿程平均质量浓度(12.31 mg·m−3)仍明显高于其他恶臭气体。C3H9N在整个沿程过程中平均质量浓度最低(2.22 mg·m−3),且在沿程的质量浓度变化波动最小。
JIANG等[43]对多座城市污水处理厂中的异味气体进行了综合分析,结果表明城市污水处理厂的异味气体质量浓度变化很大,NH3、H2S、甲硫醇(CH4S)、C2SH6、CS2和C2H6S2的质量浓度分别为0~1 500、0.1~20 480、0.4~2.4、0.4~5 450、3.06~9.82 和 0.62~1 600 ug·m−3,污水处理系统的异味气体质量浓度变化幅度较大,本研究中收集系统的异味气体质量浓度变化范围也很大,同时部分气体的质量浓度大于处理系统,进一步表明了对收集系统进行异味研究和控制的必要性。值得注意的是,H2S在许多研究中被认为是污水收集系统中非常重要的恶臭气体[44],本研究结果表明,农村重力流灰水收集系统中平均质量浓度和质量浓度变化最大的恶臭气体组分为C8H8,其次是C2SH6。因此,对于农村灰水收集系统的运维过程,不仅要关注H2S的质量浓度变化,也要关注C8H8和C2SH6等气体的质量浓度变化,仅仅通过技术手段控制H2S的产生并不一定能够实现可靠的恶臭控制效果,还需要对C8H8和C2SH6等气体进行控制。
-
近年来,排水系统的恶臭问题虽然已经受到众多学者的关注,但其研究主要集中在硫化氢和氨气等常规恶臭气体方面,对其他各类恶臭物质的生成、释放规律和控制方法关注较少,相关研究仍处于起步阶段。本研究虽然对农村重力流灰水收集系统的多种恶臭气体进行了研究,但仍有许多值得在未来深入开展的工作:本研究对中试系统的异味进行了时空规律的探索,而实际工程中排水管道气相和液相条件复杂多变,且不同环境因素对异味的产生和分布也有一定影响,仅靠中试研究的结论尚不足以全面支撑相关控制措施的提出和改良,因此,未来应关注实际工程应用过程中的异味分布规律,并针对不同异味的产生机制、分布规律和各种环境影响因素的影响开展深入分析,提出不同异味的控制方法。
-
1)灰水在相对静止状态下逸散出的恶臭气体质量浓度排序为C8H8>C2SH6>C2H6S2>NH3>H2S>C3H9N>CS2,灰水储水池恶臭气体在贴近水面处质量浓度最低,臭气主要集中在储水池距离地面约0.5 m处。
2)农村重力流灰水收集系统的恶臭气体在时间上呈M形分布,即恶臭气体在早晨(6:00—8:00)和傍晚(17:00—19:00)的质量浓度较高,这与农村灰水排放量的时间特性有关。
3)农村重力流灰水收集系统的恶臭气体在空间上表现出跌水井和管道变径处恶臭气体质量浓度较高,但这两处的成因不同。在农村重力流灰水收集系统的运维过程中,不仅要关注H2S质量浓度的变化,也应该关注C8H8和C2SH6等气体的质量浓度变化。
农村重力流灰水收集系统的恶臭气体时空分布规律
Spatial and temporal distribution patterns of malodorous gases in rural gravity-flow graywater collection systems
-
摘要: 为探究农村重力流灰水收集系统的恶臭气体时空分布规律,构建了一套中试研究装置并研究了其全流程的恶臭气体质量浓度。结果表明:在相对静止的灰水储水池中,苯乙烯(C8H8)是质量浓度最高的恶臭气体(平均质量浓度为55.68 mg·m−3),二硫化碳(CS2)的质量浓度最低(平均质量浓度为0.11 mg·m−3);灰水收集系统在早晨(6:00—8:00)和傍晚(17:00—19:00)的恶臭气体质量浓度较高,其OU平均值分别是其他时段OU平均质量浓度的1.82~23.7倍和1.87~24.41倍;灰水收集系统中的跌水井和管道变径处是恶臭气体质量浓度较高的区域,其OU平均值分别是其上下游区域OU平均值的1.2倍和1.6倍。在农村重力流灰水收集系统的运维过程中,应该关注C8H8和C2SH6等气体的浓度变化以更好的控制恶臭逸散问题。Abstract: In order to investigate the spatial and temporal distribution patterns of malodorous gases in the rural gravity-flow graywater collection system, a pilot study set was constructed and the malodorous gas concentrations of the whole process were investigated. The results shows that styrene (C8H8) was the odorous gas with the highest concentration (average concentration of 55.68 mg·m−3) and carbon disulfide (CS2) had the lowest concentration (average concentration of 0.11 mg·m−3) in the relatively stationary grey water storage tank; The grey water collection system had a higher concentration of malodorous gases in the morning (6:00—8:00) and evening (17:00—19:00), and its OU average concentration was 1.82~23.7 times and 1.87~24.41 times higher than the OU average concentration in other periods, respectively. Higher concentration of malodorous gases occurred at the drop wells and pipe reducers in the grey water collection system, and their OU average concentrations were 1.2 times and 1.6 times of the OU average concentrations in the upstream and downstream areas, respectively. During the operation and maintenance of the rural gravity flow graywater collection system, the concentration changes in gases such as C8H8 and C2SH6 should be paid attention to in order to better control the odor fugitive problem.
-
Key words:
- grey water /
- collection system /
- odor /
- time distribution /
- space distribution
-

-
表 1 灰水水质参数
Table 1. Grey water quality parameters
检测结果 pH COD/
(mg·L−1)NH4+-N/
(mg·L−1)TN/(mg·L−1) TP/(mg·L−1) DO/
(mg·L−1)硫化物/(mg·L−1) 范围 6.52-7.58 214-459.5 9.83-42.91 22.83-69.43 0.9-1.5 1.9-4.5 4.24-9.94 均值 7.05 361.78 31.28 49.85 1.21 3.1 6.3 表 2 流量与恶臭质量浓度的相关性表
Table 2. Correlation table between flow rate and odor concentration
项目 流量 OU H2S NH3 C8H8 C3H9N C2SH6 C2H6S2 流量 1 0.719** 0.689** 0.638** 0.687** 0.634** 0.800** 0.729** OU 1 0.971** 0.933** 0.955** 0.905** 0.913** 0.941** H2S 1 0.951** 0.965** 0.924** 0.898** 0.960** NH3 1 0.941** 0.962** 0.872** 0.962** C8H8 1 0.917** 0.886** 0.954** C3H9N 1 0.863** 0.938** C2SH6 1 0.907** C2H6S2 1 注:**表示在P<0.01 级别上相关性显著。 表 3 不同位置异味质量浓度参数
Table 3. Odor concentration parameters at different positions
检测
结果OU 集水池 检查口 跌水井 DN100管段 转向检查井1 转向检查井2 DN150管段 直通检查井 出水口 范围 1 138.8~1 826.4 2 001.6~3 704.6 3 216~4 677 2 395.8~3 606.4 1 052.2~1 644.6 555.6~1 878.6 532.8~2 223.6 314.4~1 000.2 63.6~206.4 均值 1 392.47 2 423.87 3 162.73 2 856.80 1 414.43 1 149.20 1 421.6 586.07 116.5 标准差 308.30 922.96 1 258.70 534.70 259.25 548.58 692.99 297.55 63.90 检测
结果H2S/ (mg·m−3) 集水池 检查口 跌水井 DN100管段 转向检查井1 转向检查井2 DN150管段 直通检查井 出水口 范围 0.30~1.82 3.68~6.86 3.01~17.69 0.23~14.47 0.58~2.14 0.77~2.33 0.70~3.86 0.33~1.02 0.05~0.22 均值 1.16 5.41 11.67 5.51 1.42 1.52 2.14 0.68 0.12 标准差 0.49 1.31 6.28 5.40 0.50 0.72 1.30 0.40 0.07 检测
结果C8H8/(mg·m−3) 集水池 检查口 跌水井 DN100管段 转向检查井1 转向检查井2 DN150管段 直通检查井 出水口 范围 1.70~8.28 0.06~40.14 0.06~87.04 1.50~13.54 5.78~13.54 4.23~14.60 3.93~27.20 0.76~9.32 0.89~1.90 均值 7.32 15.21 26.47 22.82 9.07 9.72 14.20 4.61 1.39 标准差 4.52 14.75 32.41 14.72 2.94 4.28 9.69 3.55 0.41 检测
结果NH3/(mg·m−3) 集水池 检查口 跌水井 DN100管段 转向检查井1 转向检查井2 DN150管段 直通检查井 出水口 范围 0.34~2.84 6.97~13.32 4.02~26.06 0.42~22.54 0.32~3.45 0.11~3.30 0.31~5.90 0~1.11 0~0.48 均值 1.42 9.59 17.24 8.35 1.89 1.62 2.80 0.50 0.18 标准差 0.82 2.71 9.52 8.47 1.08 1.36 2.32 0.46 0.21 检测
结果C3H9N/ (mg·m−3) 集水池 检查口 跌水井 DN100管段 转向检查井1 转向检查井2 DN150管段 直通检查井 出水口 范围 0.25~1.29 3.16~5.67 2.19~9.12 1.76~9.26 0.09~1.20 0.19~1.78 0.17~2.65 0~0.91 0~0.26 均值 0.78 4.48 6.10 4.88 0.80 0.92 1.29 0.49 0.09 标准差 0.38 1.03 2.90 3.19 0.43 0.70 1.03 0.37 0.12 检测
结果C2H6S2/ (mg·m−3) 集水池 检查口 跌水井 DN100管段 转向检查井1 转向检查井2 DN150管段 直通检查井 出水口 范围 0.36~3.52 5.60~14.46 6.49~35.96 0.58~15.46 0.39~3.02 0.61~4.31 0.75~7.75 0.14~3.87 0~1.25 均值 1.59 8.69 19.05 7.41 1.93 2.12 3.76 1.65 0.49 标准差 1.05 4.08 12.42 5.63 1.05 1.54 2.94 1.60 0.55 检测
结果C2SH6/(mg·m−3) 集水池 检查口 跌水井 DN100管段 转向检查井1 转向检查井2 DN150管段 直通检查井 出水口 范围 0.07~7.20 0.06~32.86 7.91~62.66 8.57~33.20 5.14~6.24 1.73~7.67 1.63~16.80 0.40~6.46 0.05~1.08 均值 2.64 12.81 33.24 20.99 5.73 5.64 7.91 2.95 0.61 标准差 2.64 12.16 22.54 10.06 0.45 2.76 6.46 2.57 0.43 -
[1] 李文凯, 郑天龙, 刘俊新. 农村小管径重力流灰水管道中生物膜细菌群落的特征[J]. 环境工程学报,2020, 14(3): 691-700. [2] BUTKOVSKYI A, NI G, LEAL L H, et al. Mitigation of micropollutants for black water application in agriculture via composting of anaerobic sludge[J]. Journal of Hazardous Materials, 2016, 303: 41-47. doi: 10.1016/j.jhazmat.2015.10.016 [3] HARDER R, WIELEMAKER R, LARSEN T A, et al. Recycling nutrients contained in human excreta to agriculture: pathways, processes, and products[J]. Critical Reviews in Environmental Science and Technology, 2019, 49(8): 695-743. doi: 10.1080/10643389.2018.1558889 [4] ZIEMBA C, LARIVé O, DECK S, et al. Comparing the anti-bacterial performance of chlorination and electrolysis post-treatments in a hand washing water recycling system[J]. Water Research X, 2019, 2: 100020. doi: 10.1016/j.wroa.2018.100020 [5] KULANDAISWAMY N D M, NITHYANANDAM M, PALANIVEL V. Household greywater treatment using phytoremediation technology and CapsNet model[J]. Plant and Soil, 2022, 478(1-2): 731-745. doi: 10.1007/s11104-022-05539-6 [6] MAIMON A, GROSS A. Greywater: Limitations and perspective[J]. Current Opinion in Environmental Science & Health, 2018, 2: 1-6. [7] SHAIKH I N, AHAMMED M M. Quantity and quality characteristics of greywater: A review[J]. Journal of Environmental Management, 2020, 261: 110266. doi: 10.1016/j.jenvman.2020.110266 [8] BOYJOO Y, PAREEK V K, ANG M. A review of greywater characteristics and treatment processes[J]. Water Science & Technology, 2013, 67(7): 1403-1424. [9] KOZMINYKH P, HEISTAD A, RATNAWEERA H C, et al. Impact of organic polyelectrolytes on coagulation of source-separated black water[J]. Environmental Technology, 2016, 37(14): 1723-1732. doi: 10.1080/09593330.2015.1130175 [10] LARSEN T A, GRUENDL H, BINZ C. The potential contribution of urine source separation to the SDG agenda: A review of the progress so far and future development options[J]. Environmental Science:Water Research & Technology, 2021, 7(7): 1161-1176. [11] JIN P, SHI X, SUN G, et al. Co-variation between distribution of microbial communities and biological metabolization of organics in urban sewer systems[J]. Environmental Science & Technology, 2018, 52(3): 1270-1279. [12] LI W, ZHENG T, MA Y, et al. Current status and future prospects of sewer biofilms: Their structure, influencing factors, and substance transformations[J]. Science of the Total Environment, 2019, 695: 133815. doi: 10.1016/j.scitotenv.2019.133815 [13] HE Q, YIN F, LI H, et al. Suitable flow pattern increases the removal efficiency of nitrogen in gravity sewers: a suitable anoxic and aerobic environment in biofilms[J]. Environmental Science and Pollution Research, 2018, 25: 15743-15753. doi: 10.1007/s11356-018-1768-x [14] JIN P, WANG B, JIAO D, et al. Characterization of microflora and transformation of organic matters in urban sewer system[J]. Water Research, 2015, 84: 112-119. doi: 10.1016/j.watres.2015.07.008 [15] ZHAO N, NGO H H, LI Y, et al. A comprehensive simulation approach for pollutant bio-transformation in the gravity sewer[J]. Frontiers of Environmental Science & Engineering, 2019, 13: 1-12. [16] NIELSEN A H, HVITVED‐JACOBSEN T, VOLLERTSEN J. Effect of sewer headspace air‐flow on hydrogen sulfide removal by corroding concrete surfaces[J]. Water Environment Research, 2012, 84(3): 265-273. doi: 10.2175/106143012X13347678384206 [17] PARK K, LEE H, PHELAN S, et al. Mitigation strategies of hydrogen sulphide emission in sewer networks: A review[J]. International Biodeterioration & Biodegradation, 2014, 95: 251-261. [18] LI R, HAN Z, SHEN H, et al. Volatile sulfur compound emissions and health risk assessment from an A2/O wastewater treatment plant[J]. Science of the Total Environment, 2021, 794: 148741. doi: 10.1016/j.scitotenv.2021.148741 [19] CARRERA L, SPRINGER F, LIPEME-KOUYI G, et al. Influence of relative air/water flow velocity on oxygen mass transfer in gravity sewers[J]. Water Science & Technology, 2017, 75(7): 1529-1538. [20] FUENTES M, SONG H R, GHOSH S K, et al. Spatial association between speciated fine particles and mortality[J]. Biometrics, 2006, 62(3): 855-863. doi: 10.1111/j.1541-0420.2006.00526.x [21] LEE M, WI J, KOZIEL J A, et al. Effects of uv-a light Treatment on ammonia, hydrogen sulfide, greenhouse gases, and ozone in simulated poultry barn conditions[J]. Atmosphere, 2020, 11(3): 283. doi: 10.3390/atmos11030283 [22] LIU Z. Urban sewage treatment odor gas release characteristics and regional differences[J]. Environmental Technology & Innovation, 2021, 21: 101190. [23] 张涛. 城市排污管道有害气体分布规律与危害控制研究[D]. 北京: 首都经济贸易大学, 2016. [24] HAMODA M F, ALSHALAHI S F. Assessment of hydrogen sulfide emission in a wastewater pumping station[J]. Environmental Monitoring and Assessment, 2021, 193(6): 352. doi: 10.1007/s10661-021-09116-9 [25] SIGGINS A, BURTON V, ROSS C, et al. Effects of long-term greywater disposal on soil: A case study[J]. Science of the Total Environment, 2016, 557: 627-635. [26] YANG Z, ZHU D Z, YU T, et al. Case study of H2S release and transport in a trunk sewer with drops[J]. Water Science & Technology, 2020, 82(11): 2271-2281. [27] EDWINI-BONSU S, STEFFLER P. Modeling ventilation phenomenon in sanitary sewer systems: A system theoretic approach[J]. Journal of Hvdraulic Engineering, 2006, 132(8): 778-790. doi: 10.1061/(ASCE)0733-9429(2006)132:8(778) [28] 周建明, 全斐, 赵春杰, 等. 基于有害气体监测的多作业面隧道通风管理[J]. 中国铁路, 2021, 705(03): 26-32. doi: 10.19549/j.issn.1001-683x.2021.03.026 [29] KNIGHT M A, IOANNIDIS M A, SALIM F, et al. Health risks assessment from cured-in-place pipe lining fugitive styrene emissions in laterals[J]. Journal of Pipeline Systems Engineering and Practice, 2023, 14(1): 04022056. doi: 10.1061/(ASCE)PS.1949-1204.0000690 [30] WANG B, SIVRET E, PARCSI G, et al. Reduced sulfur compounds in the atmosphere of sewer networks in Australia: geographic (and seasonal) variations[J]. Water Science & Technology, 2014, 69(6): 1167-1173. [31] SIVRET E C, WANG B, PARCSI G, et al. Prioritisation of odorants emitted from sewers using odour activity values[J]. Water Research, 2016, 88: 308-321. [32] PANDEY S K, KIM K-H, KWON E E, et al. Hazardous and odorous pollutants released from sewer manholes and stormwater catch basins in urban areas[J]. Environmental Research, 2016, 146: 235-244. doi: 10.1016/j.envres.2015.12.033 [33] HUANG C-H, CHEN K-S, WANG H-K. Measurements and PCA/APCS analyses of volatile organic compounds in Kaohsiung municipal sewer systems, southern Taiwan[J]. Aerosol and Air Quality Research, 2012, 12(6): 1315-1326. doi: 10.4209/aaqr.2012.02.0035 [34] TEIXEIRA J V, MIRANDA S, MONTEIRO R A, et al. Assessment of indoor airborne contamination in a wastewater treatment plant[J]. Environmental Monitoring and Assessment, 2013, 185: 59-72. doi: 10.1007/s10661-012-2533-0 [35] DINCER F, MUEZZINOGLU A. Odor-causing volatile organic compounds in wastewater treatment plant units and sludge management areas[J]. Journal of Environmental Science and Health Part A, 2008, 43(13): 1569-1574. doi: 10.1080/10934520802293776 [36] BOLDEN A L, KWIATKOWSKI C F, COLBORN T. New look at BTEX: are ambient levels a problem?[J]. Environmental Science & Technology, 2015, 49(9): 5261-5276. [37] DURMUSOGLU E, TASPINAR F, KARADEMIR A. Health risk assessment of BTEX emissions in the landfill environment[J]. Journal of Hazard Mater, 2010, 176(1-3): 870-877. doi: 10.1016/j.jhazmat.2009.11.117 [38] 贺墨梅, 刘焱. 污水集中式与分散式处理技术的比较研究[J]. 西南给排水, 2006, 28(4): 20-23. [39] 刘中, 金树权, 罗艳. 宁波地区农村生活污水产污特征分析研究[J]. 环境污染与防治, 2017, 39(10): 1127-1130. doi: 10.15985/j.cnki.1001-3865.2017.10.017 [40] 谷天峰. 排水系统恶臭污染及挥发性有机物的控制效果与机制研究 [D]. 杭州: 浙江大学, 2019. [41] LIU Y, NI B-J, GANIGUé R, et al. Sulfide and methane production in sewer sediments[J]. Water Research, 2015, 70: 350-359. doi: 10.1016/j.watres.2014.12.019 [42] 李伟芳, 耿静, 翟增秀, 等. 恶臭物质的嗅觉阈值与致臭机理研究概况与展望[J]. 安全与环境学报, 2015, 15(3): 327-330. doi: 10.13637/j.issn.1009-6094.2015.03.069 [43] JIANG G, MELDER D, KELLER J, et al. Odor emissions from domestic wastewater: A review[J]. Critical Reviews in Environmental Science and Technology, 2017, 47(17): 1581-1611. doi: 10.1080/10643389.2017.1386952 [44] SMET E, LENS P, LANGENHOVE H V. Treatment of waste gases contaminated with odorous sulfur compounds[J]. Critical Reviews in Environmental Science and Technology, 1998, 28(1): 89-117. doi: 10.1080/10643389891254179 -


 下载:
下载:
