-
长江流域内工农业生产发达,人口密集,社会发展繁荣,是我国重要的经济区域之一[1]. 作为我国第一大河,长江的多年平均径流量高达9300余亿m3,占据我国入海径流总流量的51%以上[2]. 巨量的长江冲淡水携带巨量的营养物质输入长江口及东海,对河口及邻近海域的水文、地貌、生物等产生重要而深远的影响[2-3].
长期以来,许多学者对长江口及其邻近海域营养盐分布规律进行了研究. 例如,刘春兰等[1]对长江口附近海域的营养盐含量调查显示,其溶解无机氮、活性磷及硅的平均浓度分别为0.62、0.030、1.21 mg·L−1. 王文亮等[4]、张锦辉等[5]分析探讨了长江口及邻近海域内磷酸盐的形态特征和影响因素,刘雅丽等[6]描述了长江口邻近海域内营养盐的季节变化,王文涛等[7]利用同位素手段研究探讨了短周期氮循环过程及特征,丰富了对河口区氮循环和迁移转化的认知. 陈慧敏等[8]报道称,长江口邻近海域氮、磷的浓度呈增加趋势,在20世纪90年代以来增长显著,其溶解无机氮及活性磷酸盐浓度范围在0.027—1.34及0.0007—0.043 mg·L−1.
另一方面,长江冲淡水入海后扩展范围极广,沿水流扩散形成不同的区域,如舟山附近海域内由长江口咸淡水混合形成的羽状锋区域[9-10],各区域有其独特的理化特征. 舟山邻近海域形成我国四大渔场之一,也是长江口鳗苗、杭州湾鲳鱼等多种经济鱼类产卵场及幼鱼索饵场[11]. 本文对2020年夏季8月份长江口邻近海域的营养盐进行分析,探讨该区域内营养盐的分布特征及可能的影响因素,为进一步研究该海域营养盐的输送、转化和迁移等过程提供基础资料.
-
2020年8月10日至8月17日期间,搭载“浙渔科2号”科考船在长江口附近海域执行“海洋锋面及渔业资源长期调查计划”(Sophisticated Ocean Front and Fisheries Investigation,SOPHI)首个调查航次,并进行了样品采集工作. 调查区域自舟山以东岱衢洋海域起,最远向东延伸到125°E,水深范围约为7—67 m,以31°N和30°N为主要断面,每隔0.5 °布设航次站位,航线布置整体成矩形,实现覆盖长江口附近舟山海域至东海陆架边缘处海域,共布设21个站位(图1),采样站位见表1.
-
以科考船搭载的温盐深仪(CTD,型号:SBE 911型,SEABIRD)获取现场海水的温度、盐度与水深数据,视各站位水深等实际情况不同,现场使用Niskin卡盖式采水器采集包括表层和底层在内的2—4层水样.
(1)营养盐及悬浮颗粒物(total suspended matter, TSM)样品采集 用4.5 L塑料瓶转移海水样品到船上实验室,将0.5 L海水用0.45 μm孔径醋酸纤维滤膜过滤营养盐样品,以干净塑料瓶装取过滤完成的营养盐样品,过滤后立即送入-20 ℃冰箱保存,用于实验室营养盐浓度的分析. 用0.45 μm孔径玻璃纤维滤膜过滤获取TSM,根据海水样品实际浑浊情况适当调整过滤体积,注意准确记录每个样品的过滤体积、滤膜编号、滤膜初始干重等数据,过滤后的TSM滤膜一并送入-20 ℃冰箱保存用于实验室TSM浓度的分析.
(2)营养盐及TSM样品分析测定 调查完成返回岸上实验室后,分析测定样品. 待营养盐样品解冻、温度升高至室温后,利用SmartChem间断湿化学分析仪(Westco,法国)分别以苯酚-次氯酸盐法测定铵盐(NH4+-N)、以盐酸-萘乙二胺法测定亚硝酸盐(NO2−-N)、以磷钼蓝法测定活性磷酸盐(PO43−-P),以抗坏血酸还原法测定硅酸盐(SiO32−-Si),以铜-镉还原法测定硝酸盐(NO3−-N). 以NH4+-N、NO2−-N、NO3−-N三者之和为溶解无机氮(DIN). 各营养盐参数的测定按照《海洋调查规范》[12]相关要求进行. 将TSM滤膜进行烘干处理,放置在干燥器中冷却至室温再称量,用于实验室TSM浓度的分析.
使用SPSS 26软件进行相关性分析,使用ODV 2020软件绘制营养盐分布特征图.
-
调查海域内NH4+-N、NO2−-N、NO3−-N、DIN、PO43−-P、SiO32−-Si和TSM的浓度范围及均值如表1所示,并对CTD测得盐度数据一并整理.
结果显示,调查海域内,NH4+-N、NO2−-N、NO3−-N、DIN、PO43−-P、SiO32−-Si和TSM的浓度平均值依次为0.0246、0.00764、0.135、0.167、0.0256、0.576、16.8 mg·L−1,在表层底层均值之间简单对比可发现,NH4+-N、NO2−-N、NO3−-N和SiO32−-Si表层和底层浓度均值的差值较小,较为接近,DIN 浓度差值亦相似;PO43−-P和TSM表、底层间浓度差值较大. 整体来看,多数指标表层含量大于底层. NO2−-N、PO43−-P及SiO32−-Si出现未检出情况,可能是对应海域内营养盐含量极低或样品保存时间较长导致物质损失;TSM出现未检出情况,有可能是对应站位(M7)的海水样品浑浊度极低,过滤体积不足导致在过滤时未能截留到足够的样品,观察滤膜,未见明显缺损,不排除其存在质量损失的可能. 盐度范围在5.24—34.5之间,分布较广泛,横跨长江冲淡水、高盐外海水等长江口不同水系[13-15].
按照《海水水质标准》[16],参照调查海域DIN和PO43−-P的浓度,以单因子法对调查海域内海水水质情况作初步的评价,结果如表2所示. 2020年夏季,调查海域内各营养盐含量相对较低,参照《2020年中国海洋生态环境状况公报》中给出的海域水质分布情况[17]及SOPHI调查站位布设情况(图1),不难发现,研究区域基本位于一、二类水质海域,多数站位离岸较远,受人类活动影响较小,可以认为其海水水质情况整体较好,这一结论也吻合公报结果. 仅有10.4%和11.9%的水样超过第四类海水水质标准,其中DIN含量较高的站位多位于近岸海域,显然受陆地人类活动影响较为显著,调查海域整体的水质情况较为乐观.
-
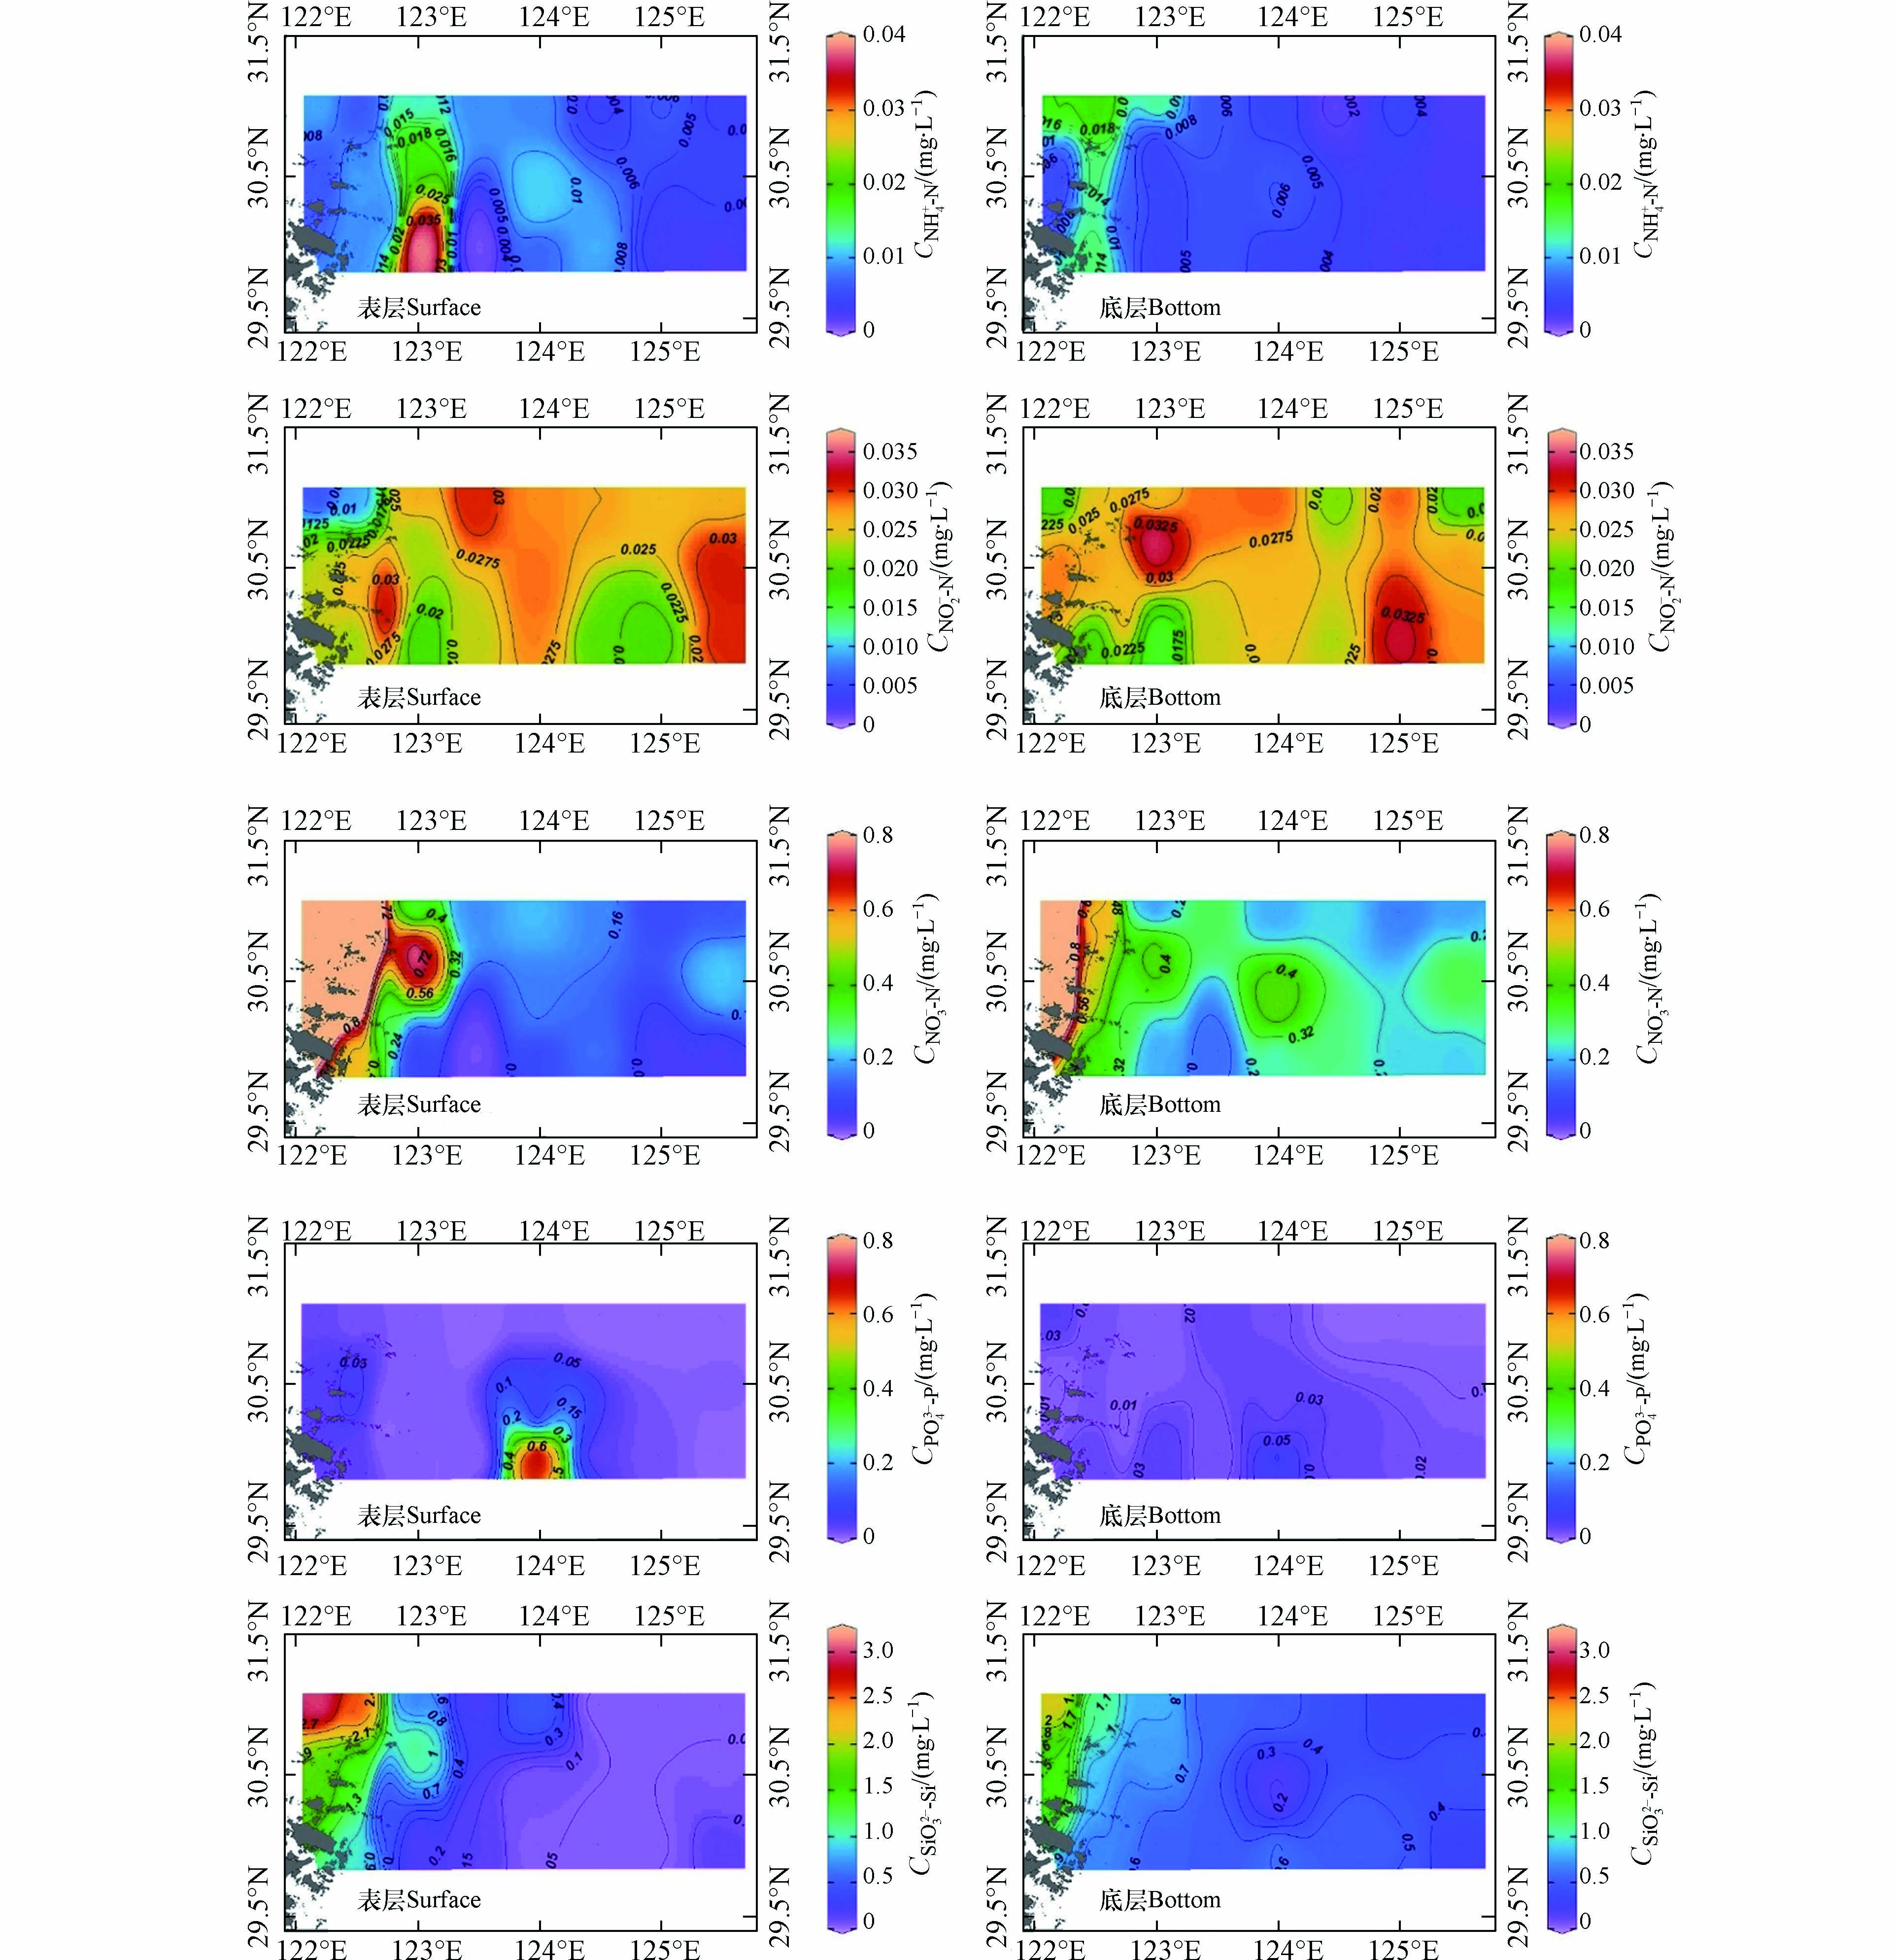
研究区域内营养盐的平面分布如图2所示. 从上到下、从左到右分别是NH4+-N、NO2−-N、NO3−-N、PO43−-P和SiO32−-Si的表、底层的分布情况. 用SPSS软件做营养盐与盐度、TSM之间的Pearson相关关系分析,其结果如表3所示.
由图2可以看出,调查海域的NO3−-N和SiO32−-Si的表、底层平面分布整体上为近岸区域浓度较高、向外海逐渐降低的趋势,梯度分布比较明显,而二者高值区出现在调查海域西北部靠近长江口及杭州湾附近,共同说明调查海域内NO3−-N和SiO32−-Si的浓度受长江冲淡水等入海径流的影响为主,而其分布也受控于长江冲淡水等径流入海后与外海海水的混合过程. 此外,由表4可知,调查海域的NO3−-N、DIN和SiO32−-Si浓度与盐度和TSM的相关性均较为显著,也能佐证研究区域内的高浓度的营养盐来自入海径流的输送[18-20]. 大量陆地径流输入引起了高冲刷作用,调查海域的NO3−-N、DIN和SiO32−-Si及其平面分布存在明显的保守行为[21-22].
NH4+-N的表、底层平面分布特征与NO3−-N类似,整体呈现出近岸高而远岸低的趋势,但高值区不同,出现在东福山岛附近,可能是岛屿附近人类活动的影响导致. NH4+-N与盐度间存在一定的相关性,分布特征可能受径流输入及生物吸收的共同影响[23-24]. NO2−-N的表、底层平面分布没有较明显的趋势,整体浓度都较高. 调查海域邻近上升流区域[25],底层有机物可能随上升流运动到表层,运动过程中有机物质分解产生大量NO2−-N. NO2−-N与盐度间没有显著的相关性,表面分布同径流输入关系不大.
PO43−-P的表、底层平面分布整体趋势较平缓,仅在S4、P1站位附近表层出现高值,其余站位整体都偏低,此处可能存在PO43−-P的另一个贡献途径. PO43−-P与盐度、TSM间均无显著的相关关系,其分布可能受冲淡水扩散、外海高盐水入侵、悬浮物吸附及生物吸收利用等多种因素的共同影响[1,26-27].
-
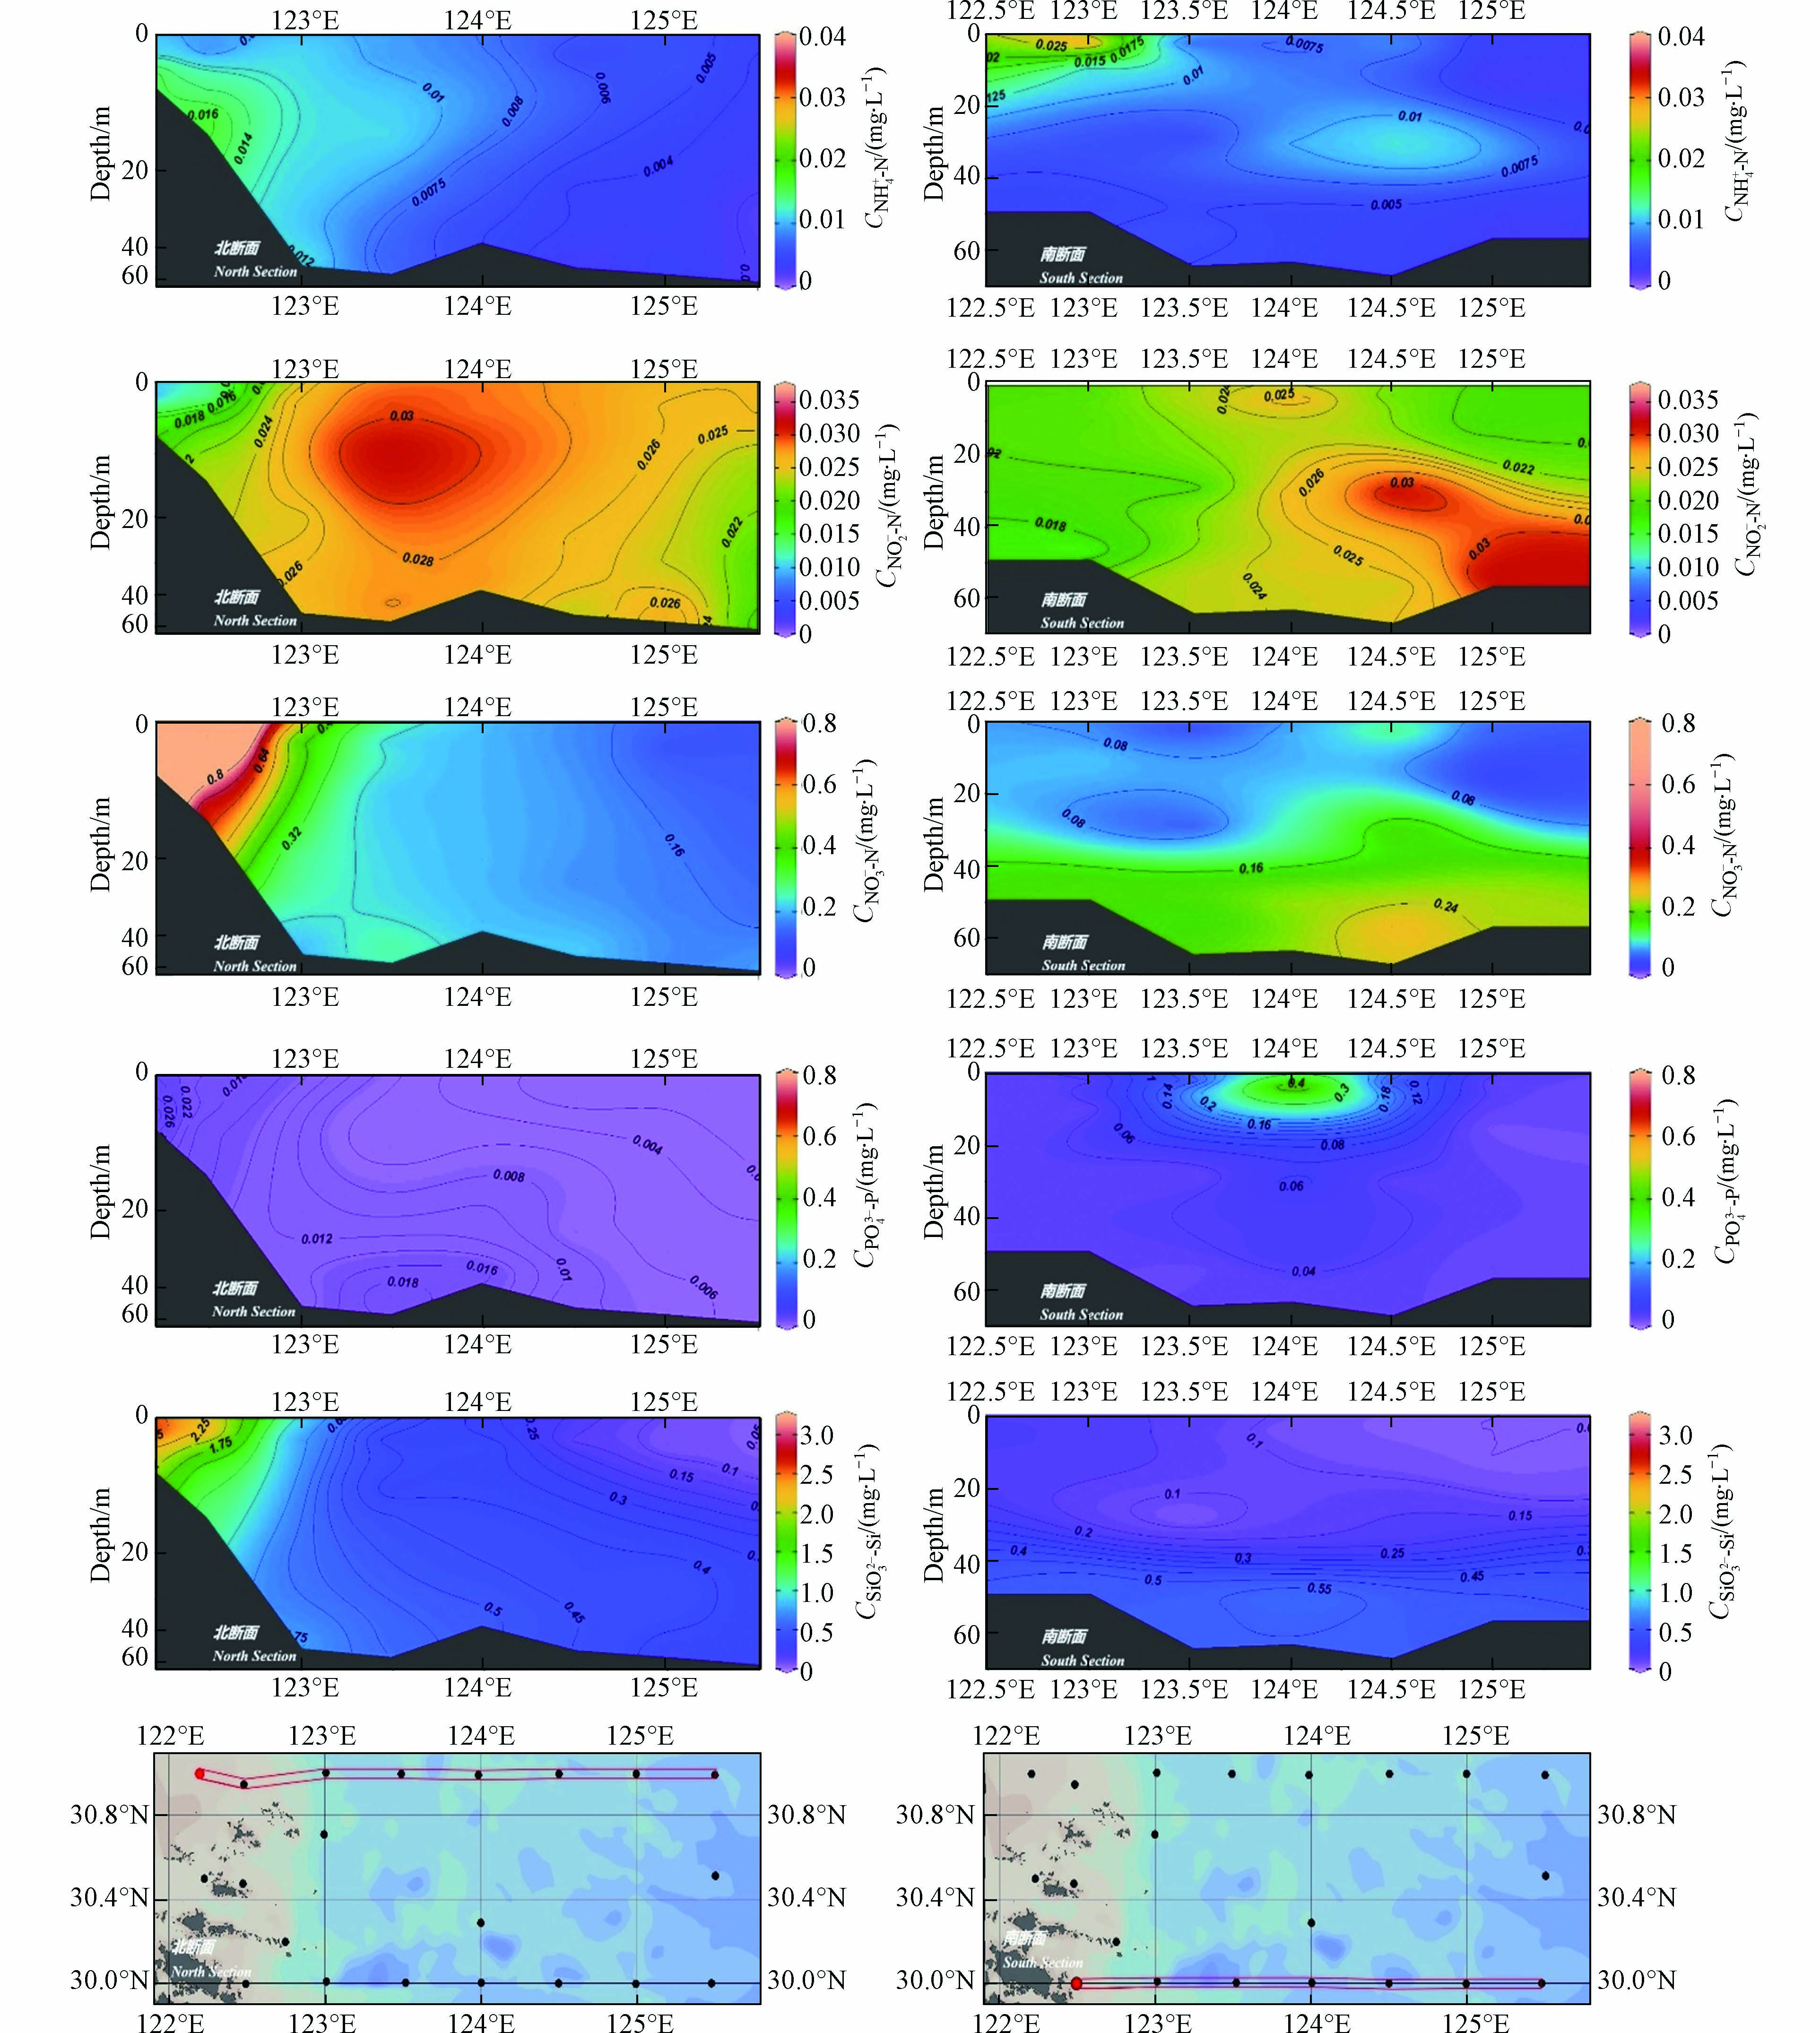
以31°N和30°N为主要断面,分别记为北断面、南断面,用ODV软件绘图,得到研究区域内营养盐的平面分布情况,如图3所示,从上到下、从左到右分别是NH4+-N、NO2−-N、NO3−-N、PO43−-P和SiO32−-Si的北、南断面分布情况.
在北断面,SiO32−-Si、NH4+-N和NO3−-N的分布呈现出显著的近岸较高而向外海逐渐降低的趋势,显然受长江冲淡水影响显著;在南断面,NH4+-N和NO3−-N在上层水体的分布趋势同北断面相近,SiO32−-Si和NO3−-N在垂向上的层化现象十分明显,且其底层浓度相对表层较高,可能是冬季黑潮滞留水的影响导致[2],PO43−-P在北断面的分布与其类似. 整体上,在南、北断面,都存在近岸海域营养盐的垂向分布等值线向上凸起的现象,在北断面尤为显著,表明在调查海域内存在明显的上升流. 而在陆架坡附近,营养盐等值线的上凸可能同高营养的黑潮次表层水的涌升或爬升有关.
-
2020年夏季SOPHI调查海域内,NH4+-N、NO2−-N、NO3−-N、DIN、PO43−-P、SiO32−-Si和TSM的平均浓度依次为0.0246、0.00764、0.135、0.167、0.0256、0.576、16.8 mg·L−1,各营养盐含量相对较低,仅有10%左右的样品低于第四类海水水质标准,可以认为调查海域整体的水质情况较为乐观.
在整体上,营养盐的分布主要呈现出近岸高远海低、由近岸到远海逐渐降低的趋势,显然受长江径流输入影响, 在NO3−-N和SiO32−-Si的分布上尤为显著. NO3−-N和SiO32−-Si及DIN与盐度及存在显著的相关关系,其行为是保守的. 垂向上,受调查海域内上升流的影响,近岸处营养盐等值线存在不同程度的向上凸出,而黑潮次表层水的沿岸爬升或涌升也可能会对本区域营养盐的分布产生影响.
致谢:感谢“浙渔科2号”科考船全体工作人员及SOPHI计划科考队员对样品采集的帮助,感谢在样品分析及论文撰写中诸位老师、同学的指导、支持和帮助,在此一并感谢.
2020年夏季长江口邻近海域的营养盐含量及分布特征
Nutrients content and distribution characteristics of the Yangtze River Estuary in summer, 2020
-
摘要: 本研究根据2020年夏季SOPHI航次21个站位水体中6项营养盐(NH4+-N、NO2−-N、NO3−-N、溶解无机氮(DIN)、PO43−-P、SiO32−-Si)的调查数据,解析了调查区域营养盐的分布特征,并结合悬浮物(TSM)等环境参数,探究其主要影响因素. 结果表明,NH4+-N、NO2−-N、NO3−-N、溶解无机氮(DIN)、PO43−-P、SiO32−-Si及悬浮物(TSM)的平均浓度(mg·L−1)分别为0.0246、0.00764、0.135、0.167、0.0256、0.576及16.8. 其中低于第四类海水水质标准的样品数量较低(<10%),表明该区域整体水质良好. NO3−-N、DIN及SiO32−-Si的平面分布具有保守性,其中NO3−-N与SiO32−-Si的平面分布由近岸到远洋呈逐渐降低趋势. 其原因是地处近岸区域受长江径流输入的影响所致. 而PO43−-P和NO2−-N的平面分布则显示为非保守性,其主要受所在区域海洋上升流及黑潮次表层水涌升影响. 尽管NH4+-N的分布呈现一定的保守性,且其平面分布趋势与NO3−-N与SiO32−-Si接近,但其高值点分析结果显示,除长江径流输入影响之外,人类活动亦对NH4+-N的分布具有明显影响.Abstract: Based on survey data of six nutrients including NH4+-N, NO2−-N, NO3−-N, dissolved inorganic nitrogen (DIN), PO43−-P and SiO32−-Si, and the related environmental parameters including total suspended matter (TSM) conducted in Summer, 2020, during the SPOHI Cruise, the distribution characteristics of nutrients were analyzed and the main influencing factors was discussed. The obtained results showed that the average concentrations (mg·L−1) of NH4+-N, NO2−-N, NO3−-N, DIN, PO43−-P, SiO32−-Si and TSM were 0.0246, 0.00764, 0.135, 0.167, 0.0256, 0.576 and 16.8, respectively. Among them, the number of samples which were below the fourth-class seawater quality was low (less than 10.0%). It indicated that the overall water quality in this investigated area was good. The planar distributions of NO3−-N, DIN and SiO32−-Si were conservative, and were gradually decreasing from the near shore area to the open ocean. The reason was that the investigated area was mainly affected by the input of the runoffs from the Yangtze River. However, the plane distributions of PO43−-P and NO2−-N were non-conservative, which were mainly affected by the upwellings in the area and the upwellings of the Kuroshio subsurface seawater. Additionally, the plane distribution of NH4+-N was conservative to a certain extent, and was close to those of NO3−-N and SiO32−-Si. However, based on the high value point measurement, it showed that the human activities also demonstrated an obvious effect on the its distribution, in addition to the impact of the Yangtze River runoff input.
-
Key words:
- Yangtze River Estuary /
- nutrients /
- distribution characteristics.
-

-
表 1 营养盐与TSM、盐度范围及均值
Table 1. The range and average of nutrients and TSM, salinity
项目
Projects浓度范围/(mg·L−1)
Concentration range平均浓度/(mg·L−1)
Average concentration总体
Total表层
Surface layer底层
Bottom layerNH4+-N 0.00550—0.0361 0.0246 0.0242 0.0255 NO2−-N ND—0.0392 0.00764 0.00849 0.00701 NO3−-N 0.00461—0.765 0.135 0.171 0.140 DIN 0.0286—0.780 0.167 0.204 0.173 PO43−-P ND—0.743 0.0256 0.0469 0.0197 SiO32−-Si ND—3.02 0.576 0.634 0.686 TSM ND—356.5 16.8 8.22 37.3 盐度 5.24—34.5 30.7 26.3 32.9 注:ND,未检出. ND, not detected. 表 2 调查海域的水质
Table 2. The quality of the investigation seawater
海水水质
Seawater quality以N计
Counting as N以P计
Counting as P样品数
Amounts百分比/%
Percent样品数
Amounts百分比/%
Percent一类水质 52 77.6 42 62.7 二类水质 7 10.4 — — 三类水质 1 1.50 17 25.4 四类水质及以上 7 10.4 8 11.9 表 3 营养盐与盐度、TSM之间的Pearson相关关系
Table 3. Pearson correlation coefficient between nutrients and salinity, TSM
营养盐
Nutrients相关系数
Correlation coefficient盐度
SalinityTSM NH4-N NO2-N NO3-N DIN PO4-P SiO3-Si NH4-N 0.419** 0.050 1 NO2-N -0.216 0.082 -0.098 1 NO3-N -0.803** 0.377** -0.390** 0.240 1 DIN -0.799** 0.384** -0.358** 0.279* 0.999** 1 PO4-P -0.037 -0.026 0.049 0.006 -0.026 -0.024 1 SiO3-Si -0.709** 0.340** -0.427** 0.217 0.891** 0.887** -0.059 1 注:**. 在0.01级别(双尾),相关性显著;*. 在0.05级别(双尾),相关性显著.
Note: **. At the 0.01 level (two-tailed), the correlation is significant; *. At the 0.05 level (two-tailed), the correlation is significant. -
[1] 刘春兰, 金石磊, 马轶凡, 等. 长江口邻近海域夏季营养盐的含量与分布特征[J]. 厦门大学学报(自然科学版), 2020, 59(增刊1): 75-80. LIU C L, JIN S L, MA Y F, et al. Nutrient concentrations and distribution characteristics in the Yangtze River Estuary adjacent sea area in summer[J]. Journal of Xiamen University (Natural Science), 2020, 59(Sup 1): 75-80 (in Chinese).
[2] 洪华生. 中国区域海洋学-化学海洋学[M]. 北京: 海洋出版社, 2012. HONG H S. Regional oceanography of China Seas[M]. Beijing: Ocean Press, 2012(in Chinese).
[3] 王保栋. 长江冲淡水的扩展及其营养盐的输运 [J]. 黄渤海海洋学报, 1998, 16(2): 41-47. WANG B D. On the extension and nutrient transportation of the Changjiang River diluted water [J]. Journal of Oceanography of Huanghai & Bohai Seas, 1998, 16(2): 41-47(in Chinese).
[4] 王文亮, 陈建芳, 金海燕, 等. 长江口夏季水体磷的形态分布特征及影响因素 [J]. 海洋学研究, 2009, 27(2): 32-41. doi: 10.3969/j.issn.1001-909X.2009.02.005 WANG W L, CHEN J F, JIN H Y, et al. The distribution characteristics and influence factors of some species phosphorus in waters of the Changjiang River Estuary in summer [J]. Journal of Marine Sciences, 2009, 27(2): 32-41(in Chinese). doi: 10.3969/j.issn.1001-909X.2009.02.005
[5] 张锦辉, 王典, 刘桂贤, 等. 2016年夏季长江口邻近海域海水中磷的形态研究[J]. 厦门大学学报(自然科学版), 2020, 59(增刊1): 88-92. ZHANG J H, WANG D, LIU G X, et al. Phosphorus species in the Yangtze River Estuary adjacent sea area in summer of 2016[J]. Journal of Xiamen University (Natural Science), 2020, 59(Sup 1): 88-92 (in Chinese).
[6] 刘雅丽, 高磊, 朱礼鑫, 等. 长江口及邻近海域营养盐的季节变化特征 [J]. 海洋环境科学, 2017, 36(2): 243-248. doi: 10.13634/j.cnki.mes.2017.02.013 LIU Y L, GAO L, ZHU L X, et al. Seasonal variation of nutrients in the Changjiang(Yangtze River)Estuary and the adjacent East China Sea [J]. Marine Environmental Science, 2017, 36(2): 243-248(in Chinese). doi: 10.13634/j.cnki.mes.2017.02.013
[7] 王文涛, 俞志明, 宋秀贤, 等. 长江口邻近海域氮同位素的周日变化特征及其对营养盐过程的指示 [J]. 海洋与湖沼, 2020, 51(4): 909-918. doi: 10.11693/hyhz20191200270 WANG W T, YU Z M, SONG X X, et al. Indications of nutrients process revealed by diurnal variations of nitrogen isotopes in the waters adjacent to Changjiang estuarine [J]. Oceanologia et Limnologia Sinica, 2020, 51(4): 909-918(in Chinese). doi: 10.11693/hyhz20191200270
[8] 陈慧敏, 孙承兴, 仵彦卿. 近23a来长江口及其邻近海域营养盐结构的变化趋势和影响因素分析 [J]. 海洋环境科学, 2011, 30(4): 551-553,563. doi: 10.3969/j.issn.1007-6336.2011.04.022 CHEN H M, SUN C X, WU Y Q. Analysis of trend of nutrient structure and influencing factors in Changjiang Estuary and its adjacent sea during 23 years [J]. Marine Environmental Science, 2011, 30(4): 551-553,563(in Chinese). doi: 10.3969/j.issn.1007-6336.2011.04.022
[9] 胡方西, 胡辉, 谷国传, 等. 长江口锋面研究[M]. 上海: 华东师范大学出版社, 2002. HU F X, HU H, GU G C, et al. Studies of fronts in the Changjiang Estuary[M]. Shanghai: East China Normal University Press, 2002(in Chinese).
[10] 诸大宇, 郑丙辉, 雷坤, 等. 基于营养盐分布特征的长江口附近海域分区研究 [J]. 环境科学学报, 2008, 28(6): 1233-1240. doi: 10.3321/j.issn:0253-2468.2008.06.032 ZHU D Y, ZHENG B H, LEI K, et al. A nutrient-distribution-based partition method in the Yangtze Estuary [J]. Acta Scientiae Circumstantiae, 2008, 28(6): 1233-1240(in Chinese). doi: 10.3321/j.issn:0253-2468.2008.06.032
[11] 郑丙辉, 周娟, 刘录三, 等. 长江口及邻近海域富营养化指标原因变量参照状态的确定 [J]. 生态学报, 2013, 33(9): 2780-2789. doi: 10.5846/stxb201202020137 ZHENG B H, ZHOU J, LIU L S, et al. The reference condition for eutrophication indictor in the Yangtze River Estuary and adjacent waters—Causal Variables [J]. Acta Ecologica Sinica, 2013, 33(9): 2780-2789(in Chinese). doi: 10.5846/stxb201202020137
[12] 国家质量监督检验检疫总局, 中国国家标准化管理委员会. 海洋调查规范 第4部分: 海水化学要素调查: GB/T 12763.4—2007[S]. 北京: 中国标准出版社, 2008. General Administration of Quality Supervision, Inspection and Quarantine of the People's Republic of China, Standardization Administration of the People's Republic of China. Specifications for oceanographic survey-Part 4: Survey-Part 4: Survey of chemical parameters in sea water: GB/T 12763.4—2007[S]. Beijing: Standards Press of China, 2008(in Chinese).
[13] 胡辉, 胡方西. 长江口的水系和锋面 [J]. 中国水产科学, 1995, 2(1): 81-90. doi: 10.3321/j.issn:1005-8737.1995.01.008 HU H, HU F X. Water types and frontal surface in the Changjiang estuary [J]. Journal of Fishery Sciences of China, 1995, 2(1): 81-90(in Chinese). doi: 10.3321/j.issn:1005-8737.1995.01.008
[14] 胡方西, 胡辉, 谷国传, 等. 长江河口盐度锋[J]. 海洋与湖沼, 1995, 26(增刊1): 23-31. HU F X, HU H, GU G C, et al. Salinity fronts in the Changjiang River Estuary[J]. Oceanologia et Limnologia Sinica, 1995, 26(Sup 1): 23-31 (in Chinese).
[15] 谷国传, 胡方西, 胡辉, 等. 长江口外高盐水入侵分析 [J]. 东海海洋, 1994, 12(3): 1-11. GU G C, HU F X, HU H, et al. An analysis of high-concentration-salt water intrusion outside the Changjiang Estuary [J]. Dongahi Marine Science, 1994, 12(3): 1-11(in Chinese).
[16] 海水水质标准: GB 3097—1997[S]. 2004. Marine water quality standard: GB 3097—1997[S]. 2004(in Chinese).
[17] 中华人民共和国生态环境部. 2020年中国海洋生态环境状况公报. [EB/OL].[2021-05-26]. https://www.mee.gov.cn/hjzl/sthjzk/jagb/202105/P020210526318015796036.pdf Ministry of Ecology and Environment of the People’s Republic of China. China Marine Ecological Environment Status Bulletin in 2020. [EB/OL]. [2021-05-26]. https://www.mee.gov.cn/hjzl/sthjzk/jagb/202105/P020210526318015796036.pdf (in Chinese)
[18] GAO L, LI D J, ZHANG Y W. Nutrients and particulate organic matter discharged by the Changjiang (Yangtze River): Seasonal variations and temporal trends [J]. Journal of Geophysical Research:Biogeosciences, 2012, 117(G4): G04001. [19] ZHOU M J, SHEN Z L, YU R C. Responses of a coastal phytoplankton community to increased nutrient input from the Changjiang (Yangtze) River [J]. Continental Shelf Research, 2008, 28(12): 1483-1489. doi: 10.1016/j.csr.2007.02.009 [20] ZHANG S, JI H B, YAN W J, et al. Composition and flux of nutrients transport to the Changjiang Estuary [J]. Journal of Geographical Sciences, 2003, 13(1): 3-12. doi: 10.1007/BF02873141 [21] 王丽莎, 石晓勇, 祝陈坚, 等. 春季长江口邻近海域营养盐分布特征及污染状况研究 [J]. 海洋环境科学, 2008, 27(5): 466-469. doi: 10.3969/j.issn.1007-6336.2008.05.015 WANG L S, SHI X Y, ZHU C J, et al. Nutrient distribution and pollution status in Changjiang Estuary adjacent area in spring [J]. Marine Environmental Science, 2008, 27(5): 466-469(in Chinese). doi: 10.3969/j.issn.1007-6336.2008.05.015
[22] CHEN H T, YU Z G, YAO Q Z, et al. Nutrient concentrations and fluxes in the Changjiang Estuary during summer [J]. Acta Oceanologica Sinica, 2010, 29(2): 107-119. doi: 10.1007/s13131-010-0029-8 [23] GLIBERT P M. Regional studies of daily, seasonal and size fraction variability in ammonium remineralization [J]. Marine Biology, 1982, 70(2): 209-222. doi: 10.1007/BF00397687 [24] BOYER J N, STANLEY D W, CHRISTIAN R R. Dynamics of NH4+ and NO3− uptake in the water column of the Neuse River Estuary, North Carolina [J]. Estuaries, 1994, 17(2): 361-371. doi: 10.2307/1352669 [25] 杨德周, 尹宝树, 俞志明, 等. 长江口叶绿素分布特征和营养盐来源数值模拟研究 [J]. 海洋学报, 2009, 31(1): 10-19. YANG D Z, YIN B S, YU Z M, et al. Study on the character of distribution of chlorophyll-a off the Changjiang River and its sources of nutrients [J]. Acta Oceanologica Sinica, 2009, 31(1): 10-19(in Chinese).
[26] 徐家婧, 周鹏, 连尔刚, 等. 2019年夏季长江口及邻近海域锋面控制下叶绿素a的分布特征及其环境影响因素分析 [J]. 海洋通报, 2021, 40(5): 541-549. XU J J, ZHOU P, LIAN E G, et al. Spatial distribution of chlorophyll a and its relationships with environmental factors influenced by front in the Changjiang River Estuary and its adjacent waters in summer 2019 [J]. Marine Science Bulletin, 2021, 40(5): 541-549(in Chinese).
[27] 夏荣霜, 张海燕, 徐亚岩, 等. 春、夏季长江口及其邻近海域无机营养盐的分布特征分析 [J]. 湖北农业科学, 2014, 53(23): 5688-5693. doi: 10.14088/j.cnki.issn0439-8114.2014.23.018 XIA R S, ZHANG H Y, XU Y Y, et al. Distribution of inorganic nutrient in the Yangtze Estuary and its adjacent waters in spring and summer [J]. Hubei Agricultural Sciences, 2014, 53(23): 5688-5693(in Chinese). doi: 10.14088/j.cnki.issn0439-8114.2014.23.018
-


 下载:
下载:


