-
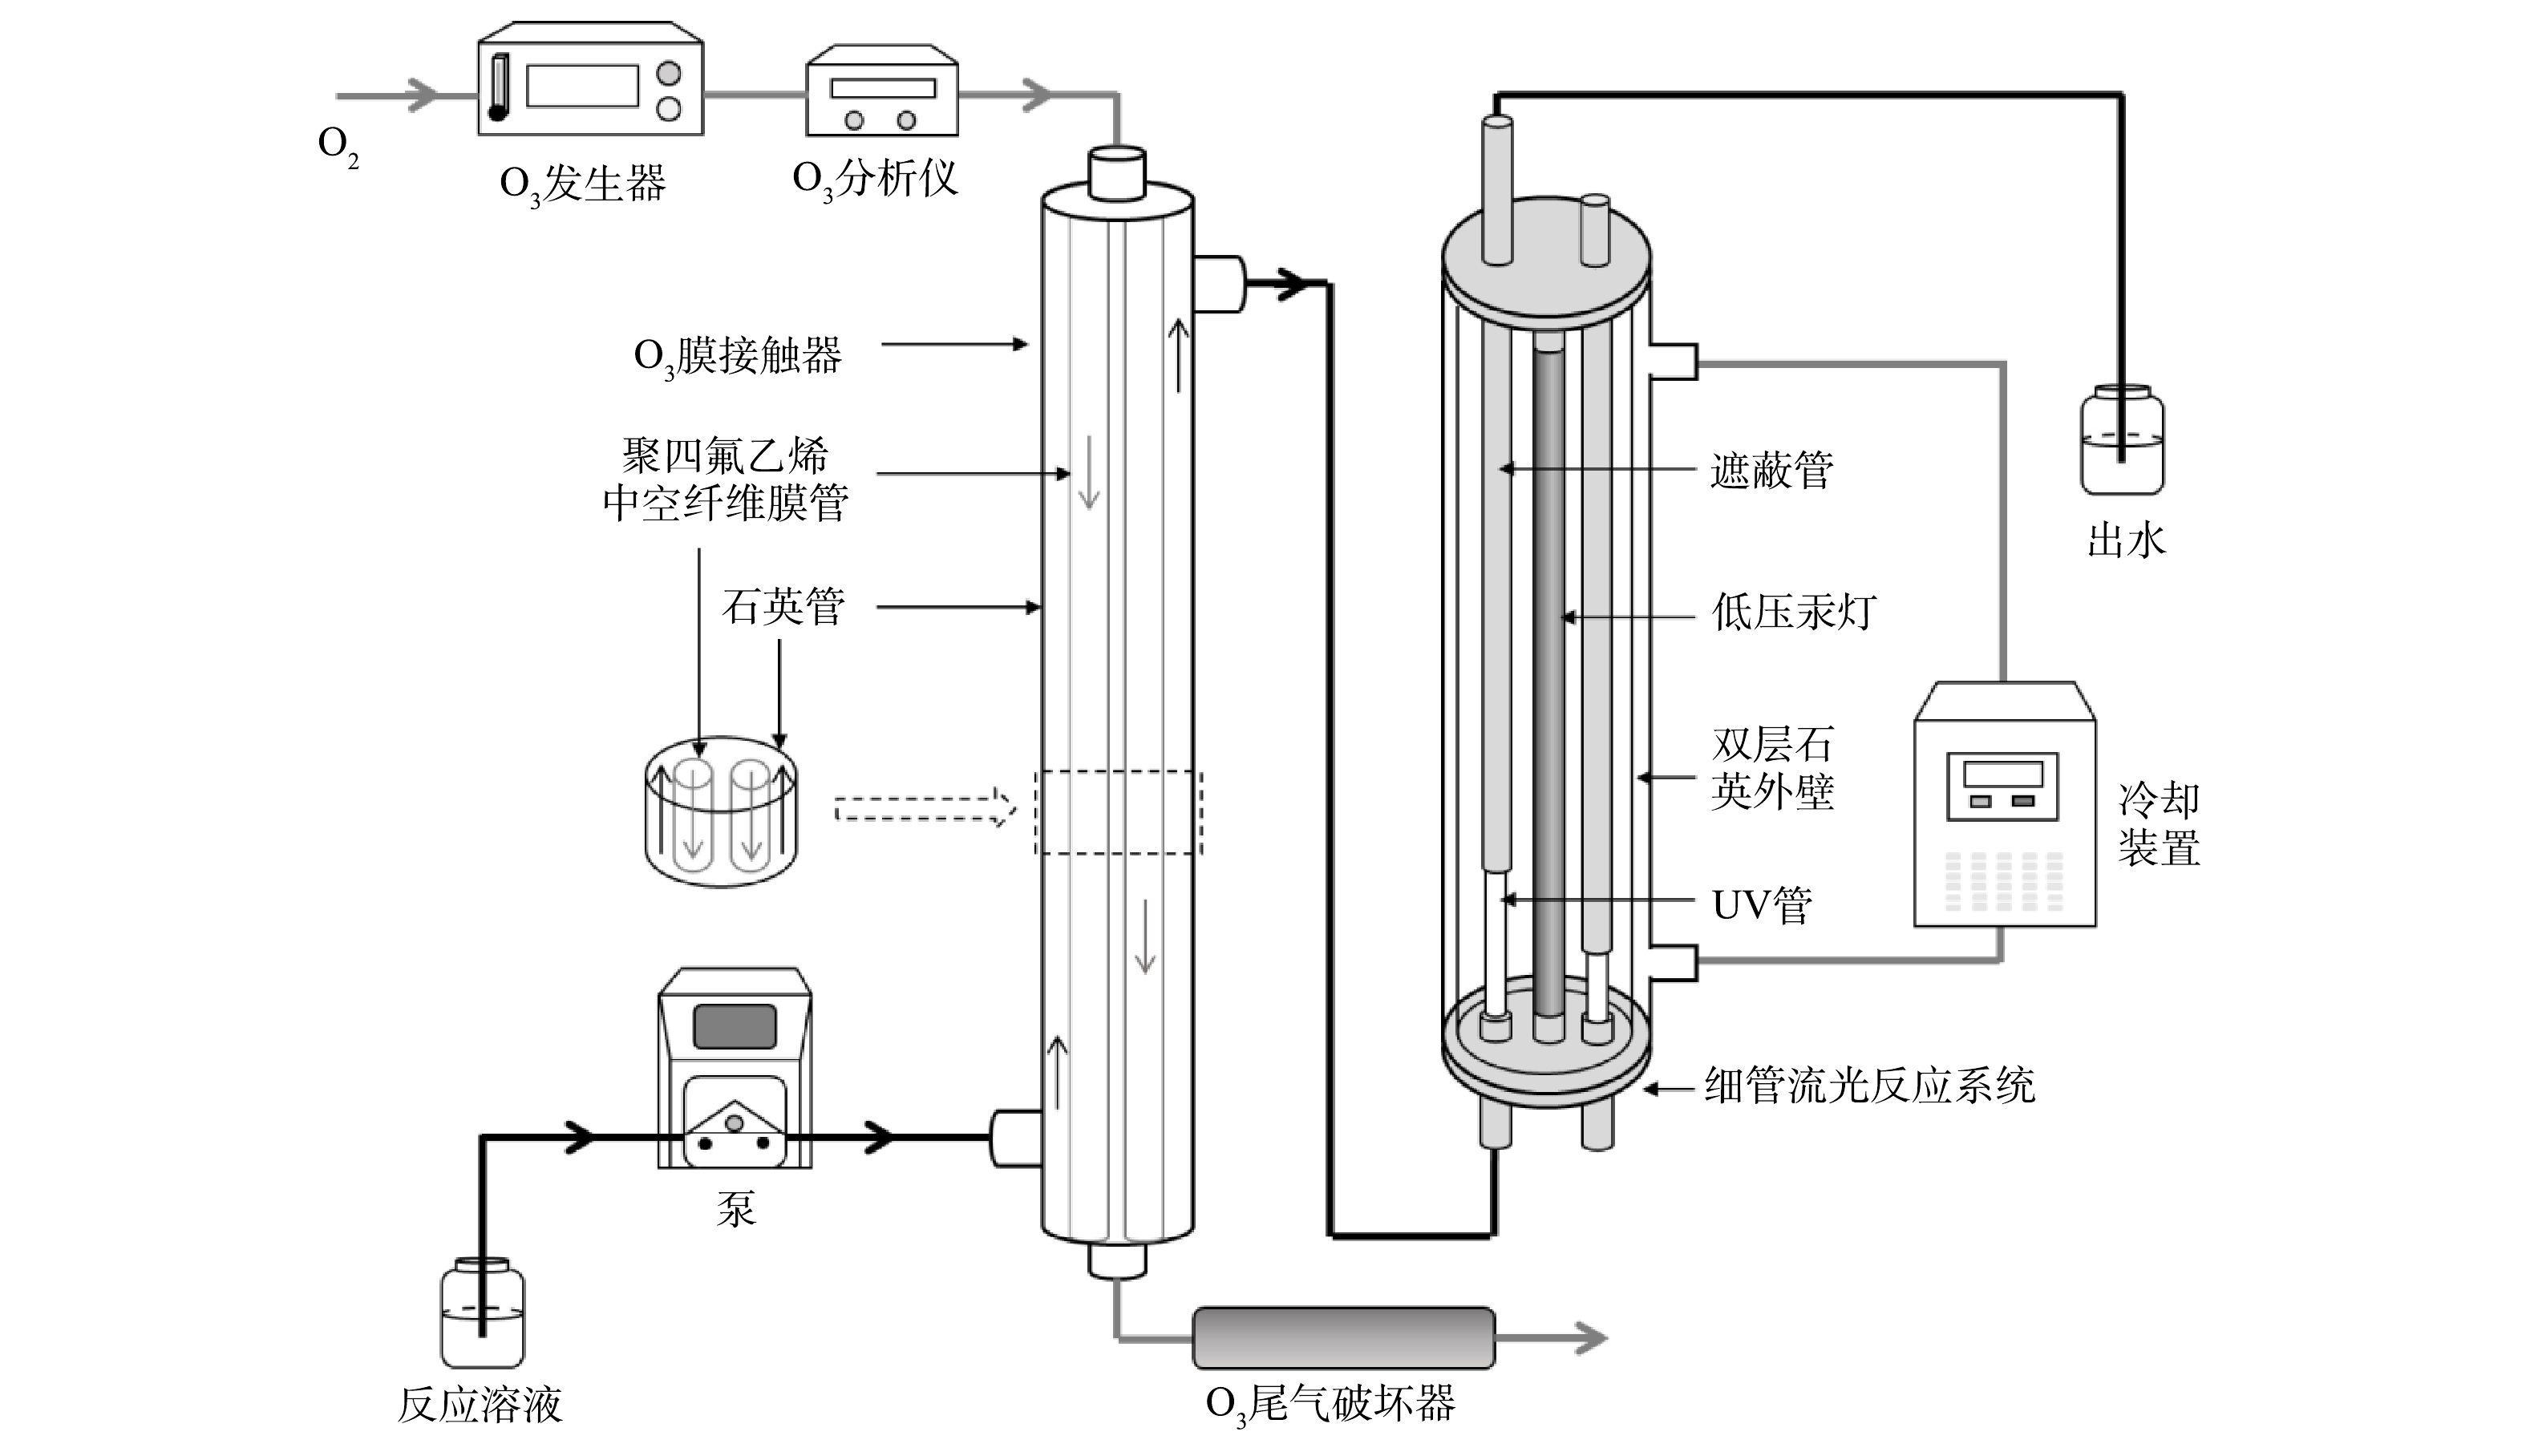
图 1 膜接触O3-UV实验装置示意图
Figure 1. Schematic diagram of membrane contact O3-UV experimental system
-
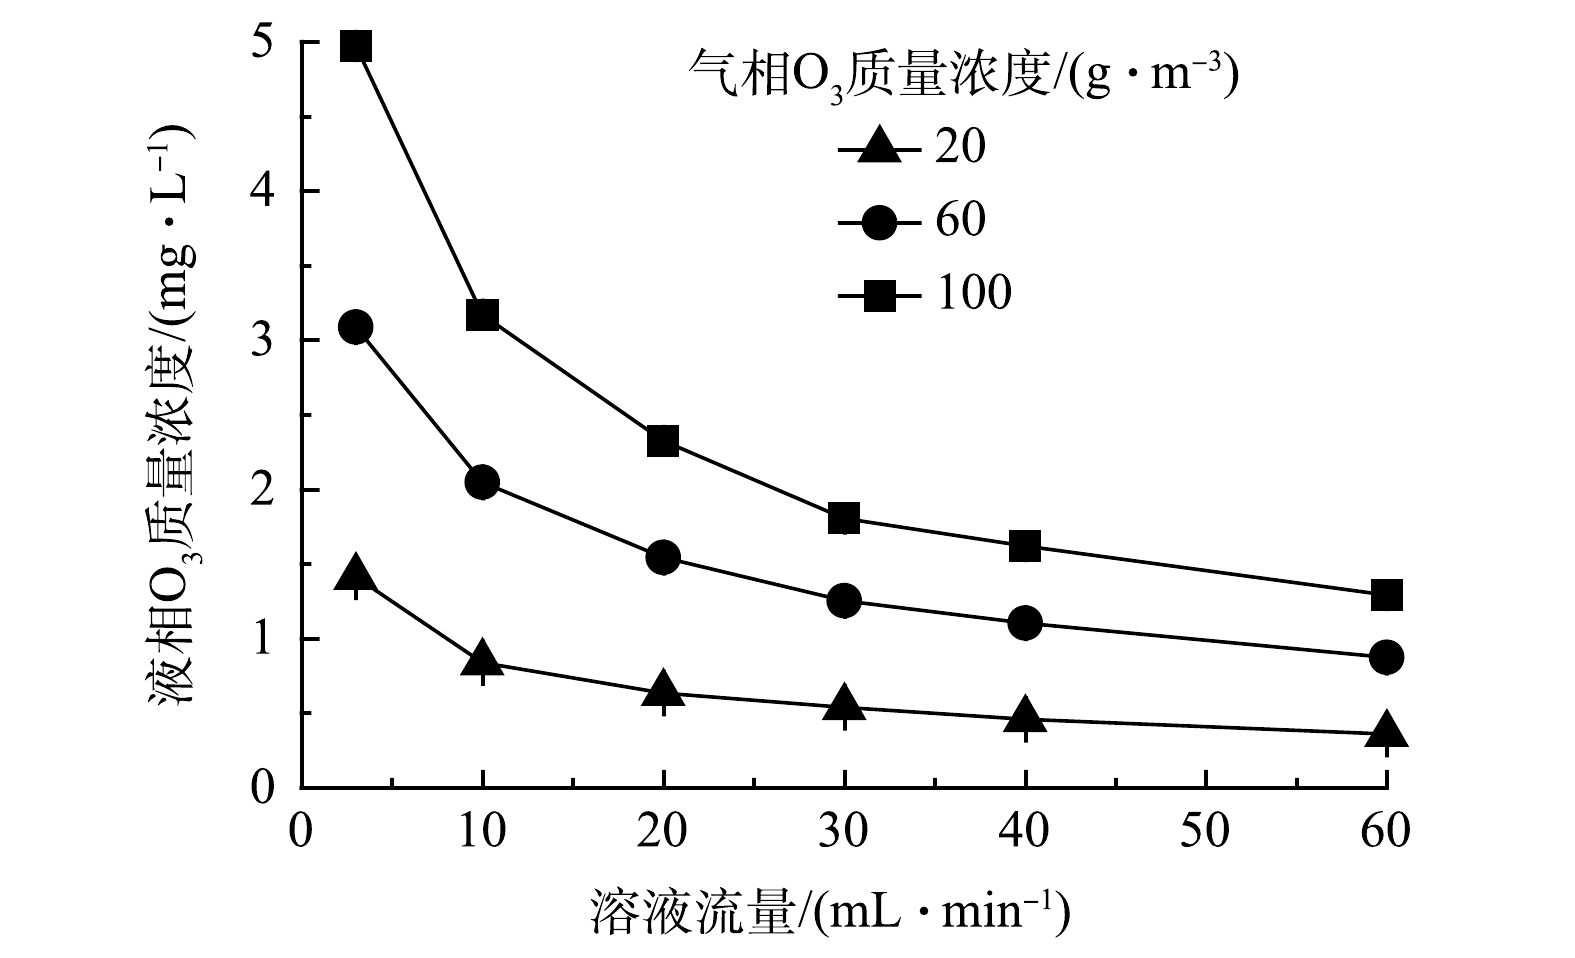
图 2 溶液流量、气相O3质量浓度对O3膜接触器出水液相O3质量浓度的影响
Figure 2. Effects of solution flow rate and gaseous O3 mass concentration on aqueous O3 mass concentration at the outlet of O3 membrane contactor
-

图 3 pH对O3膜接触器出水液相O3质量浓度的影响
Figure 3. Effect of pH on aqueous O3 mass concentration at the outlet of O3 membrane contactor
-

图 4 磷酸缓冲溶液对O3膜接触器出水液相O3质量浓度的影响
Figure 4. Effect of phosphate buffer on aqueous O3 mass concentration at the outlet of O3 membrane contactor
-
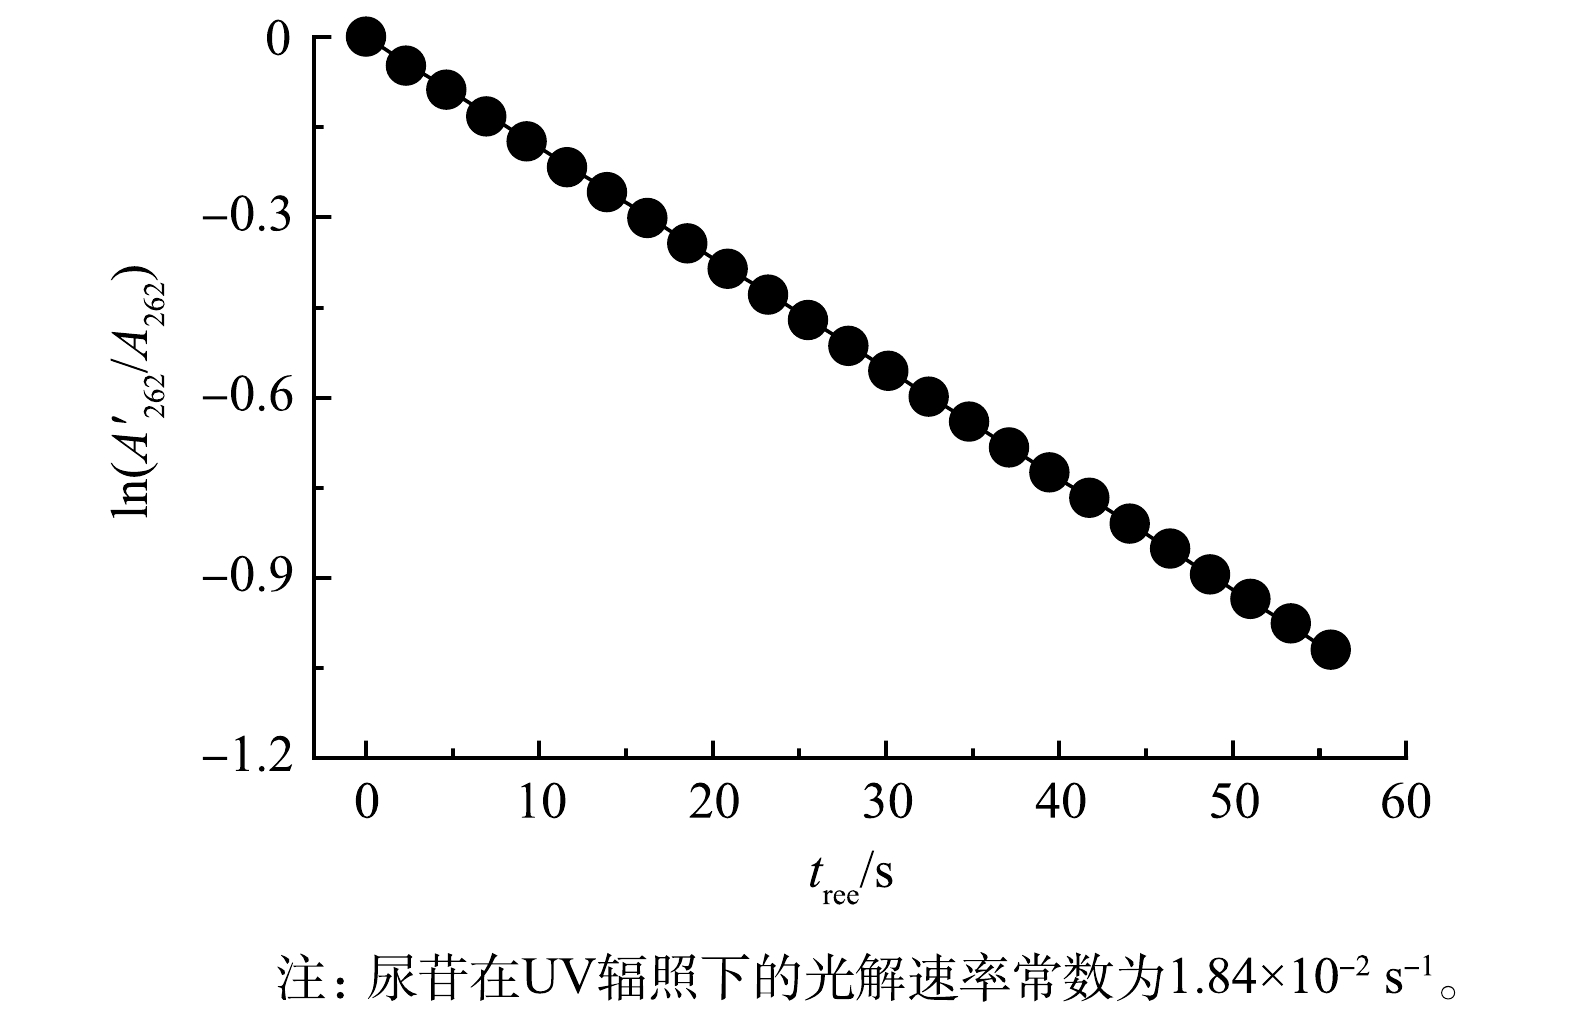
图 5 尿苷的UV光解动力学
Figure 5. UV photolysis kinetics of uridine
-
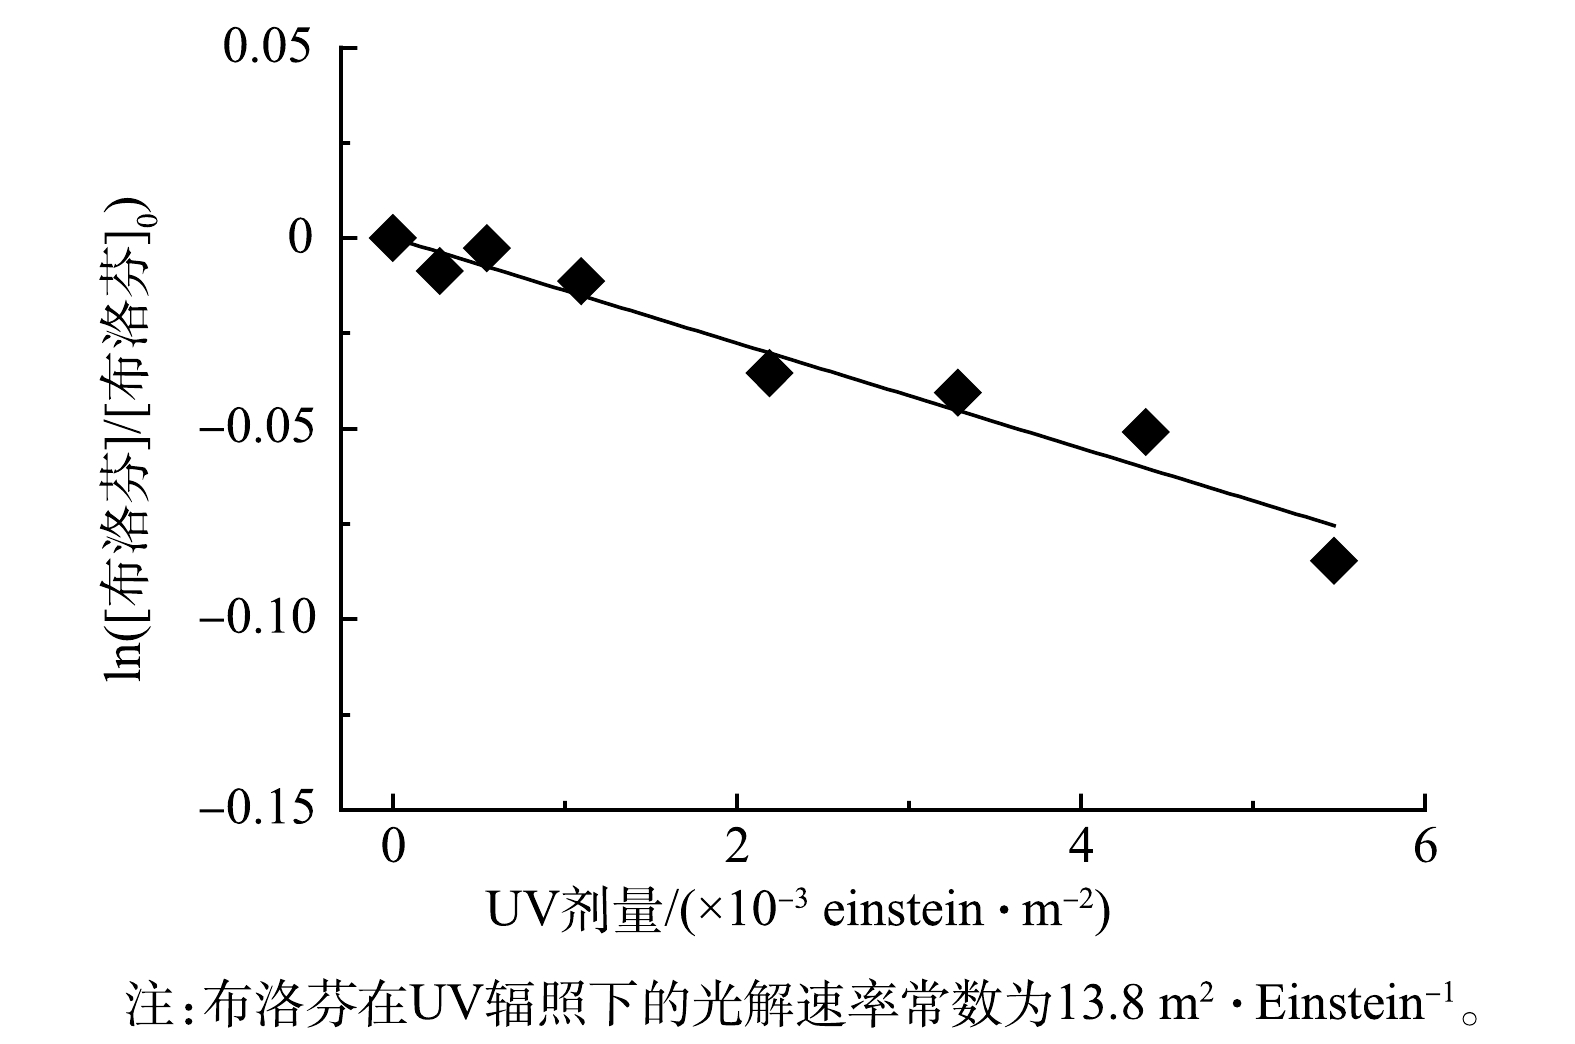
图 6 布洛芬的UV光解动力学
Figure 6. UV photolysis kinetics of ibuprofen
-

图 7 膜接触O3-UV联用下布洛芬降解及液相O3质量浓度变化
Figure 7. Ibuprofen degradation and change of aqueous O3 mass concentration in the combination of membrane contact O3 and UV processes
-
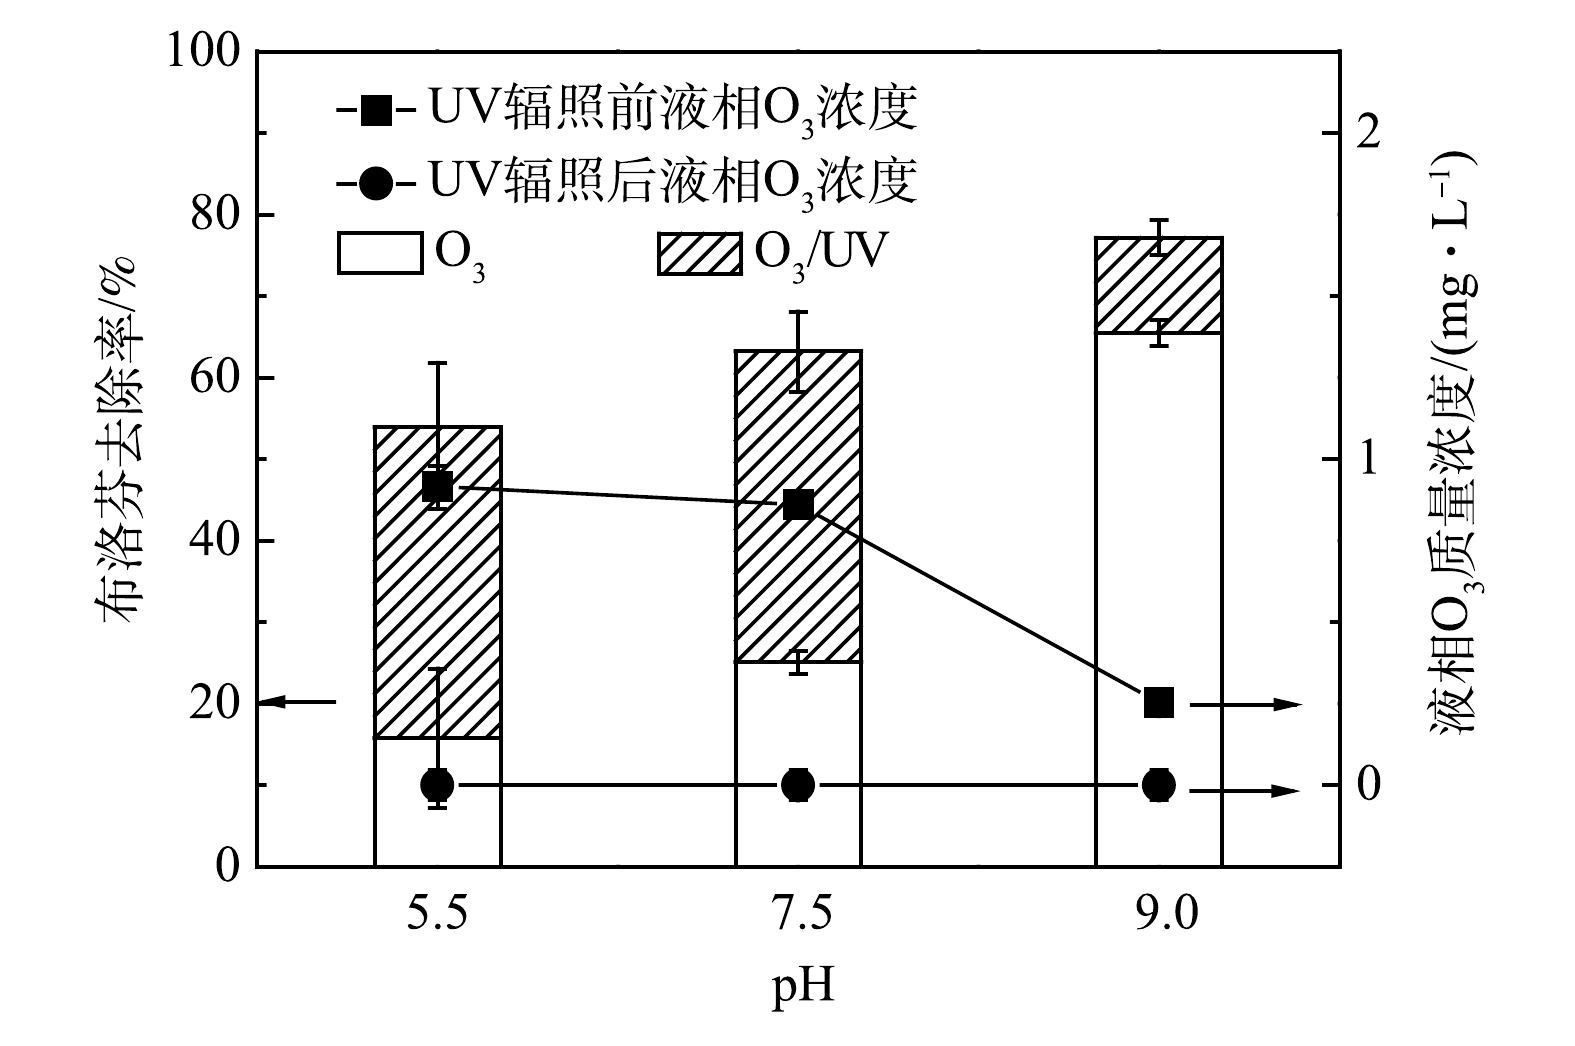
图 8 pH对膜接触O3-UV联用降解布洛芬的影响
Figure 8. Effect of pH on ibuprofen degradation by the combination of membrane contact O3 and UV processes
-
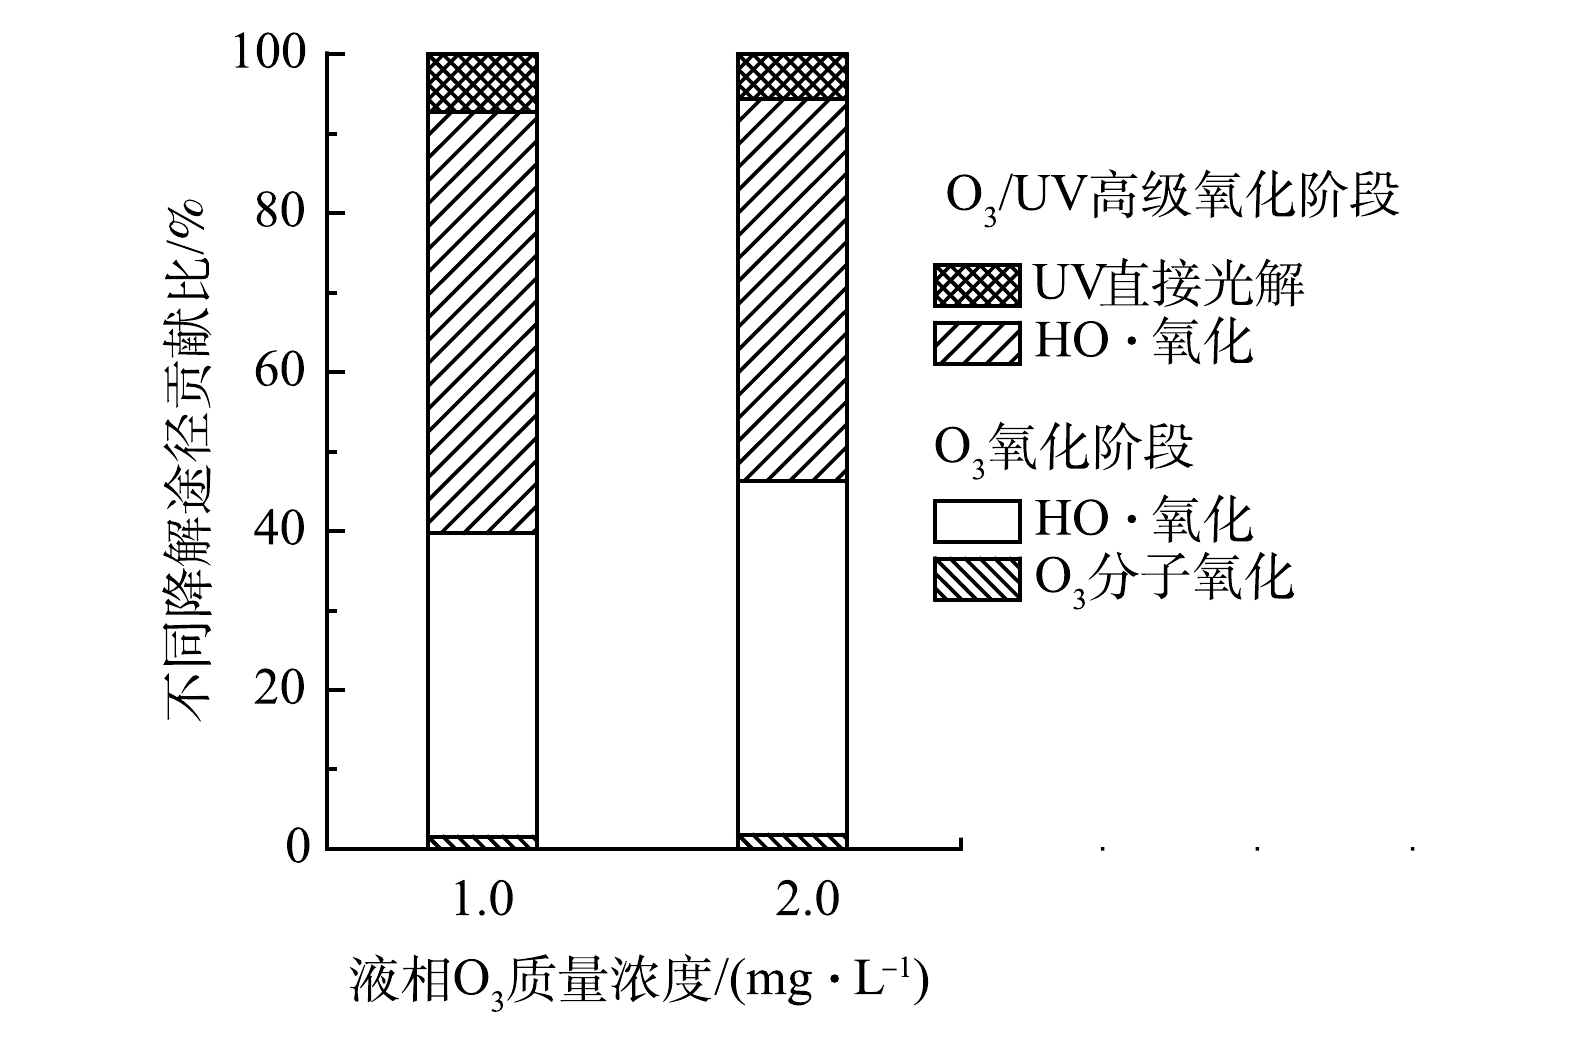
图 9 膜接触O3-UV联用下布洛芬的降解途径贡献比
Figure 9. Contributions of different degradation pathways of ibuprofen in the combination of membrane contact O3 and UV processes
Figure
9 ,Table
0 个