-
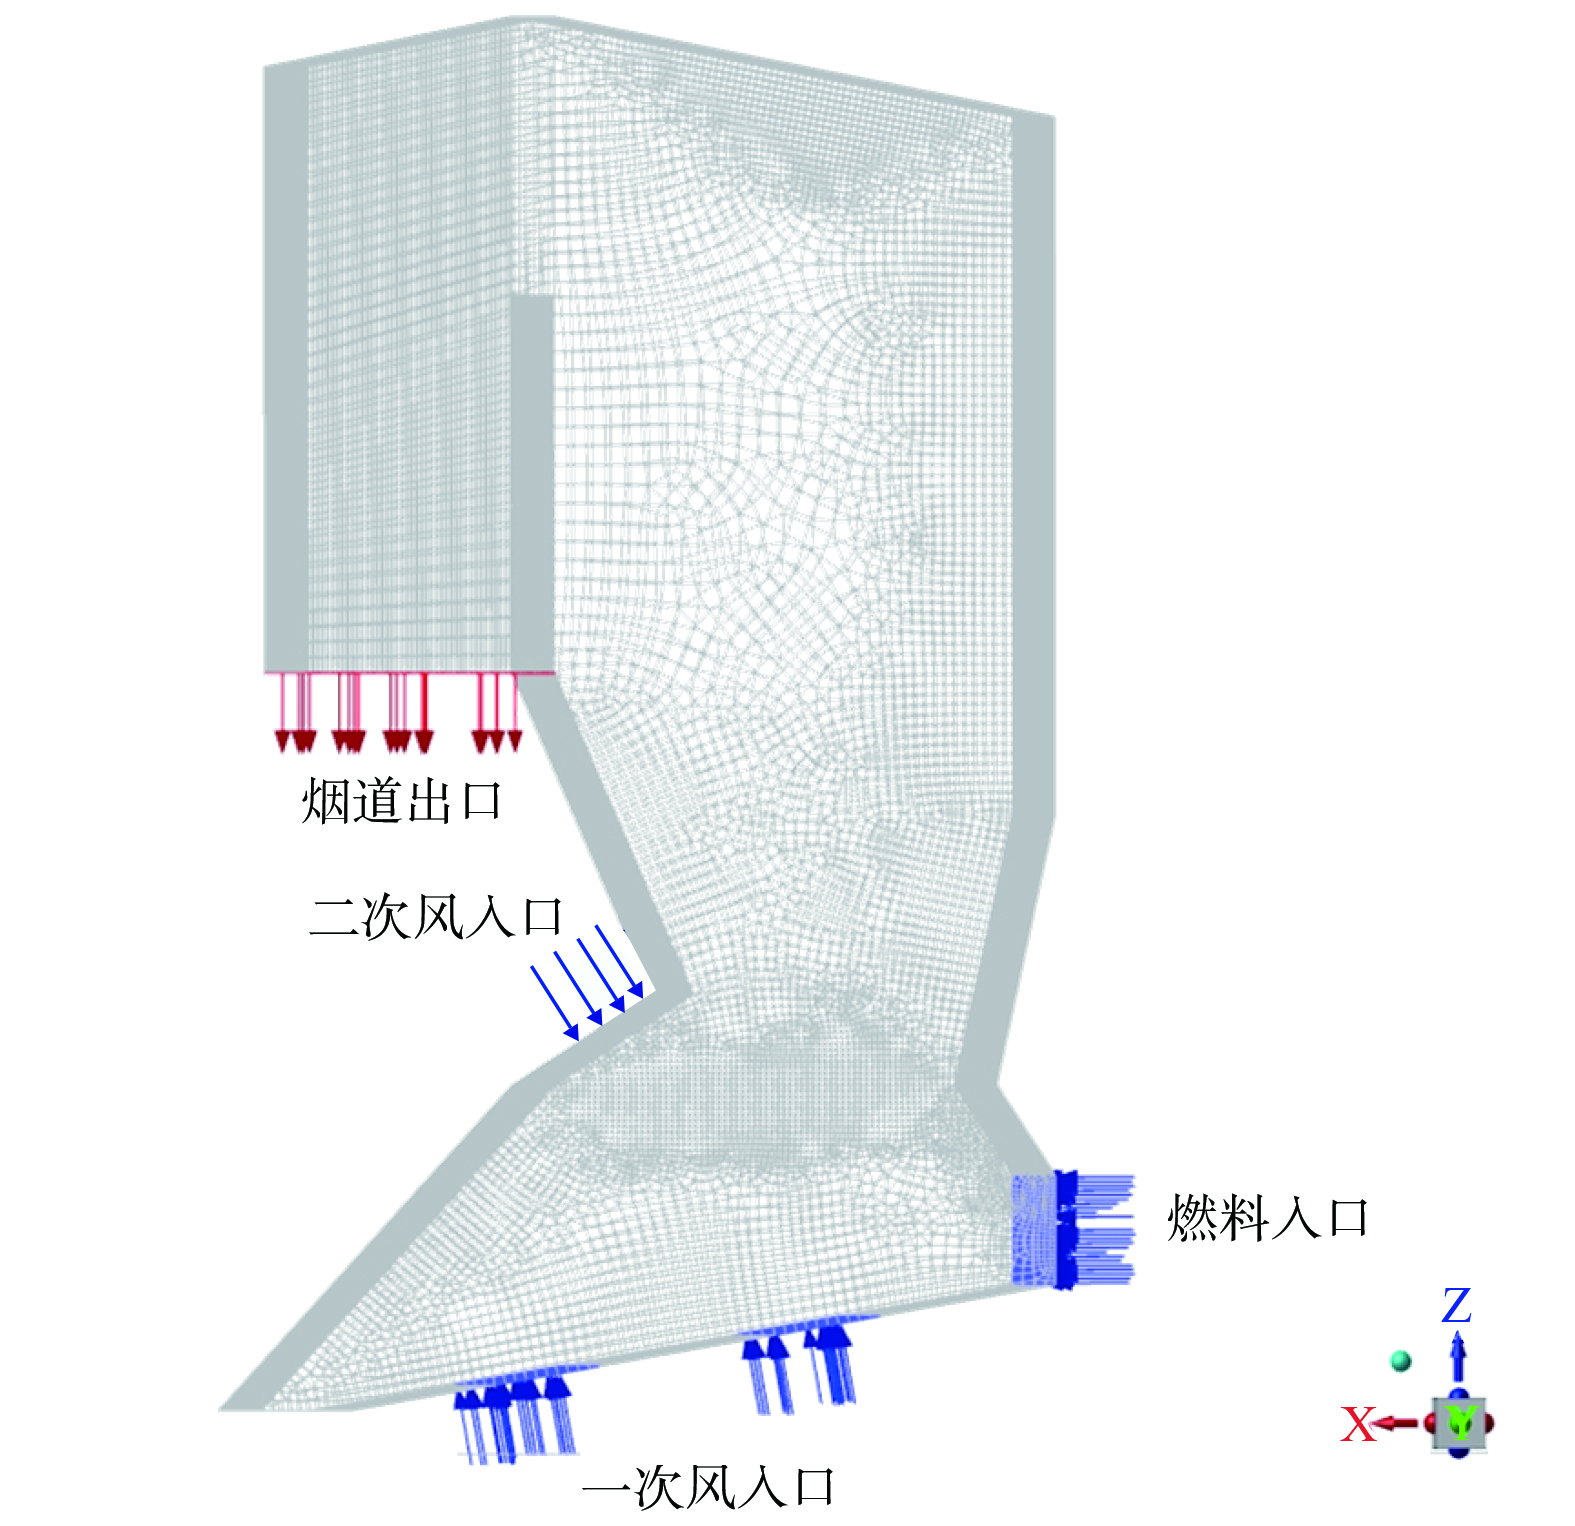
图 1 生物质锅炉炉膛网格划分简图
Figure 1. Biomass boiler furnace grid division diagram
-

图 2 燃烧模型燃料参数设置
Figure 2. Fuel parameter setting of combustion model
-
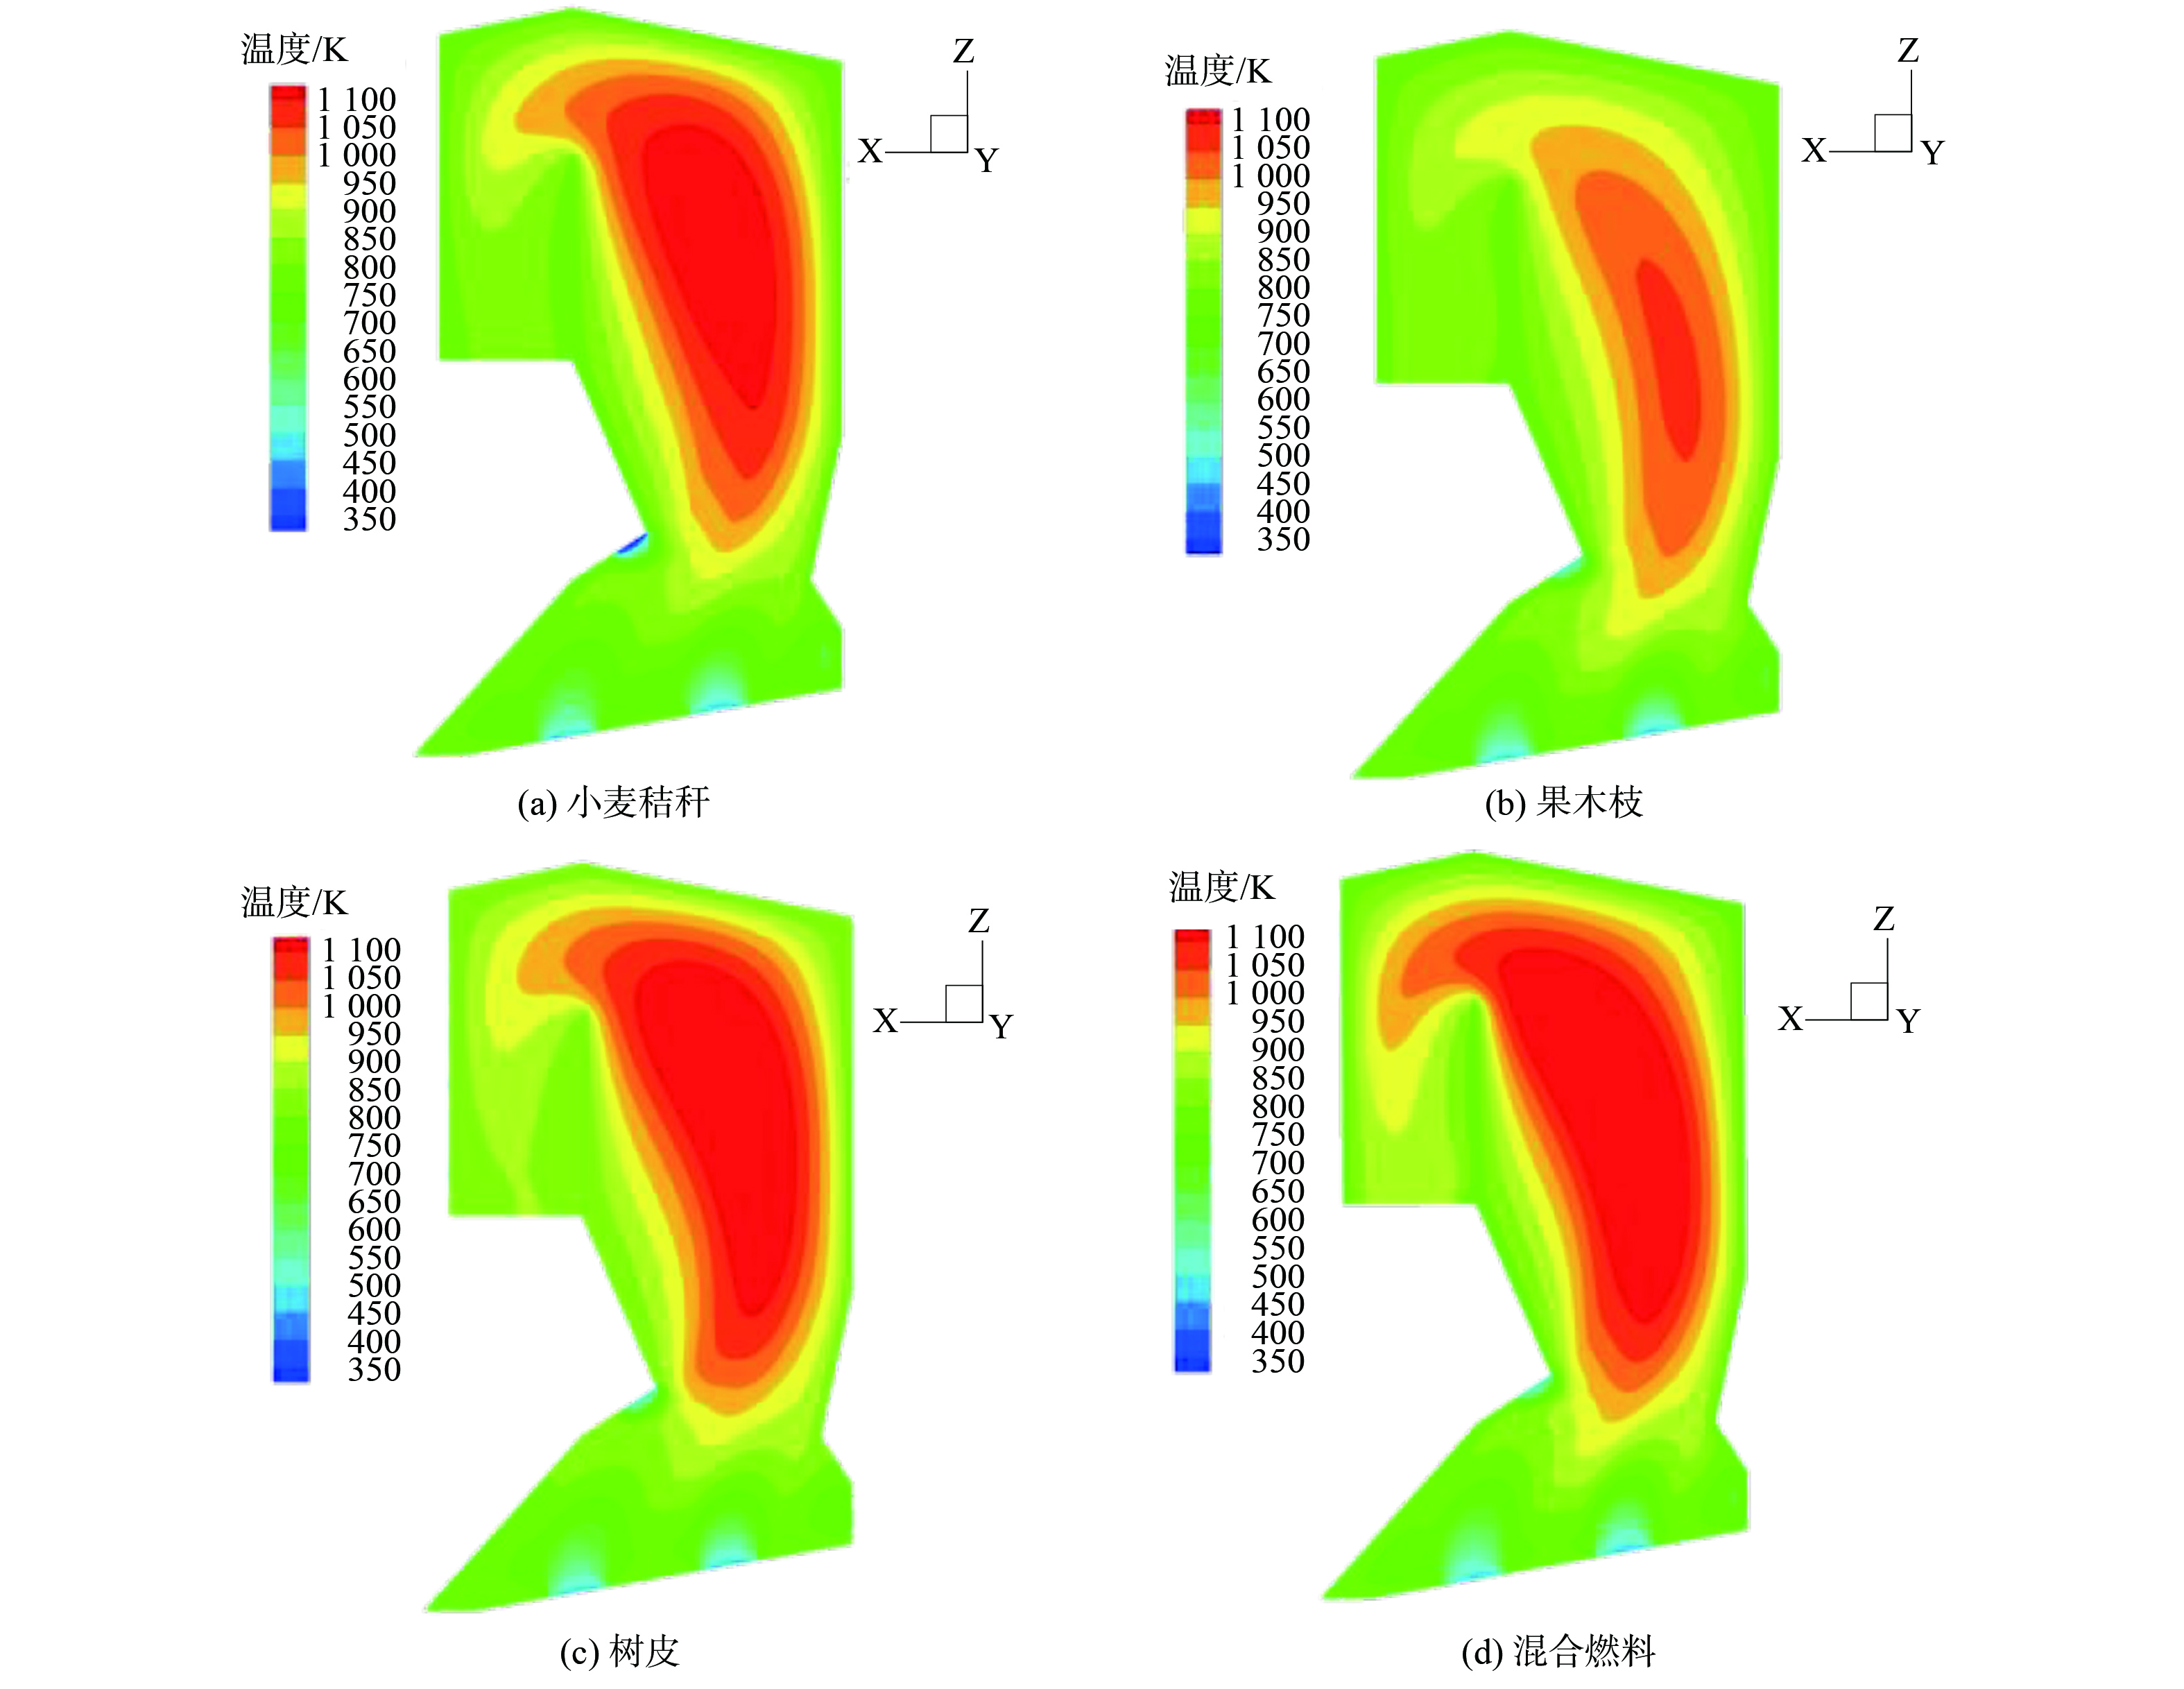
图 3 不同生物质燃料在炉膛y=4.6截面处的温度分布
Figure 3. Temperature distribution diagram of different biomass fuels at y=4.6 section of furnace
-

图 4 不同生物质燃料在炉膛y=4.6 m处NO的质量浓度分布
Figure 4. NO concentration distribution diagram of different biomass fuels at y=4.6 m in the furnace
-
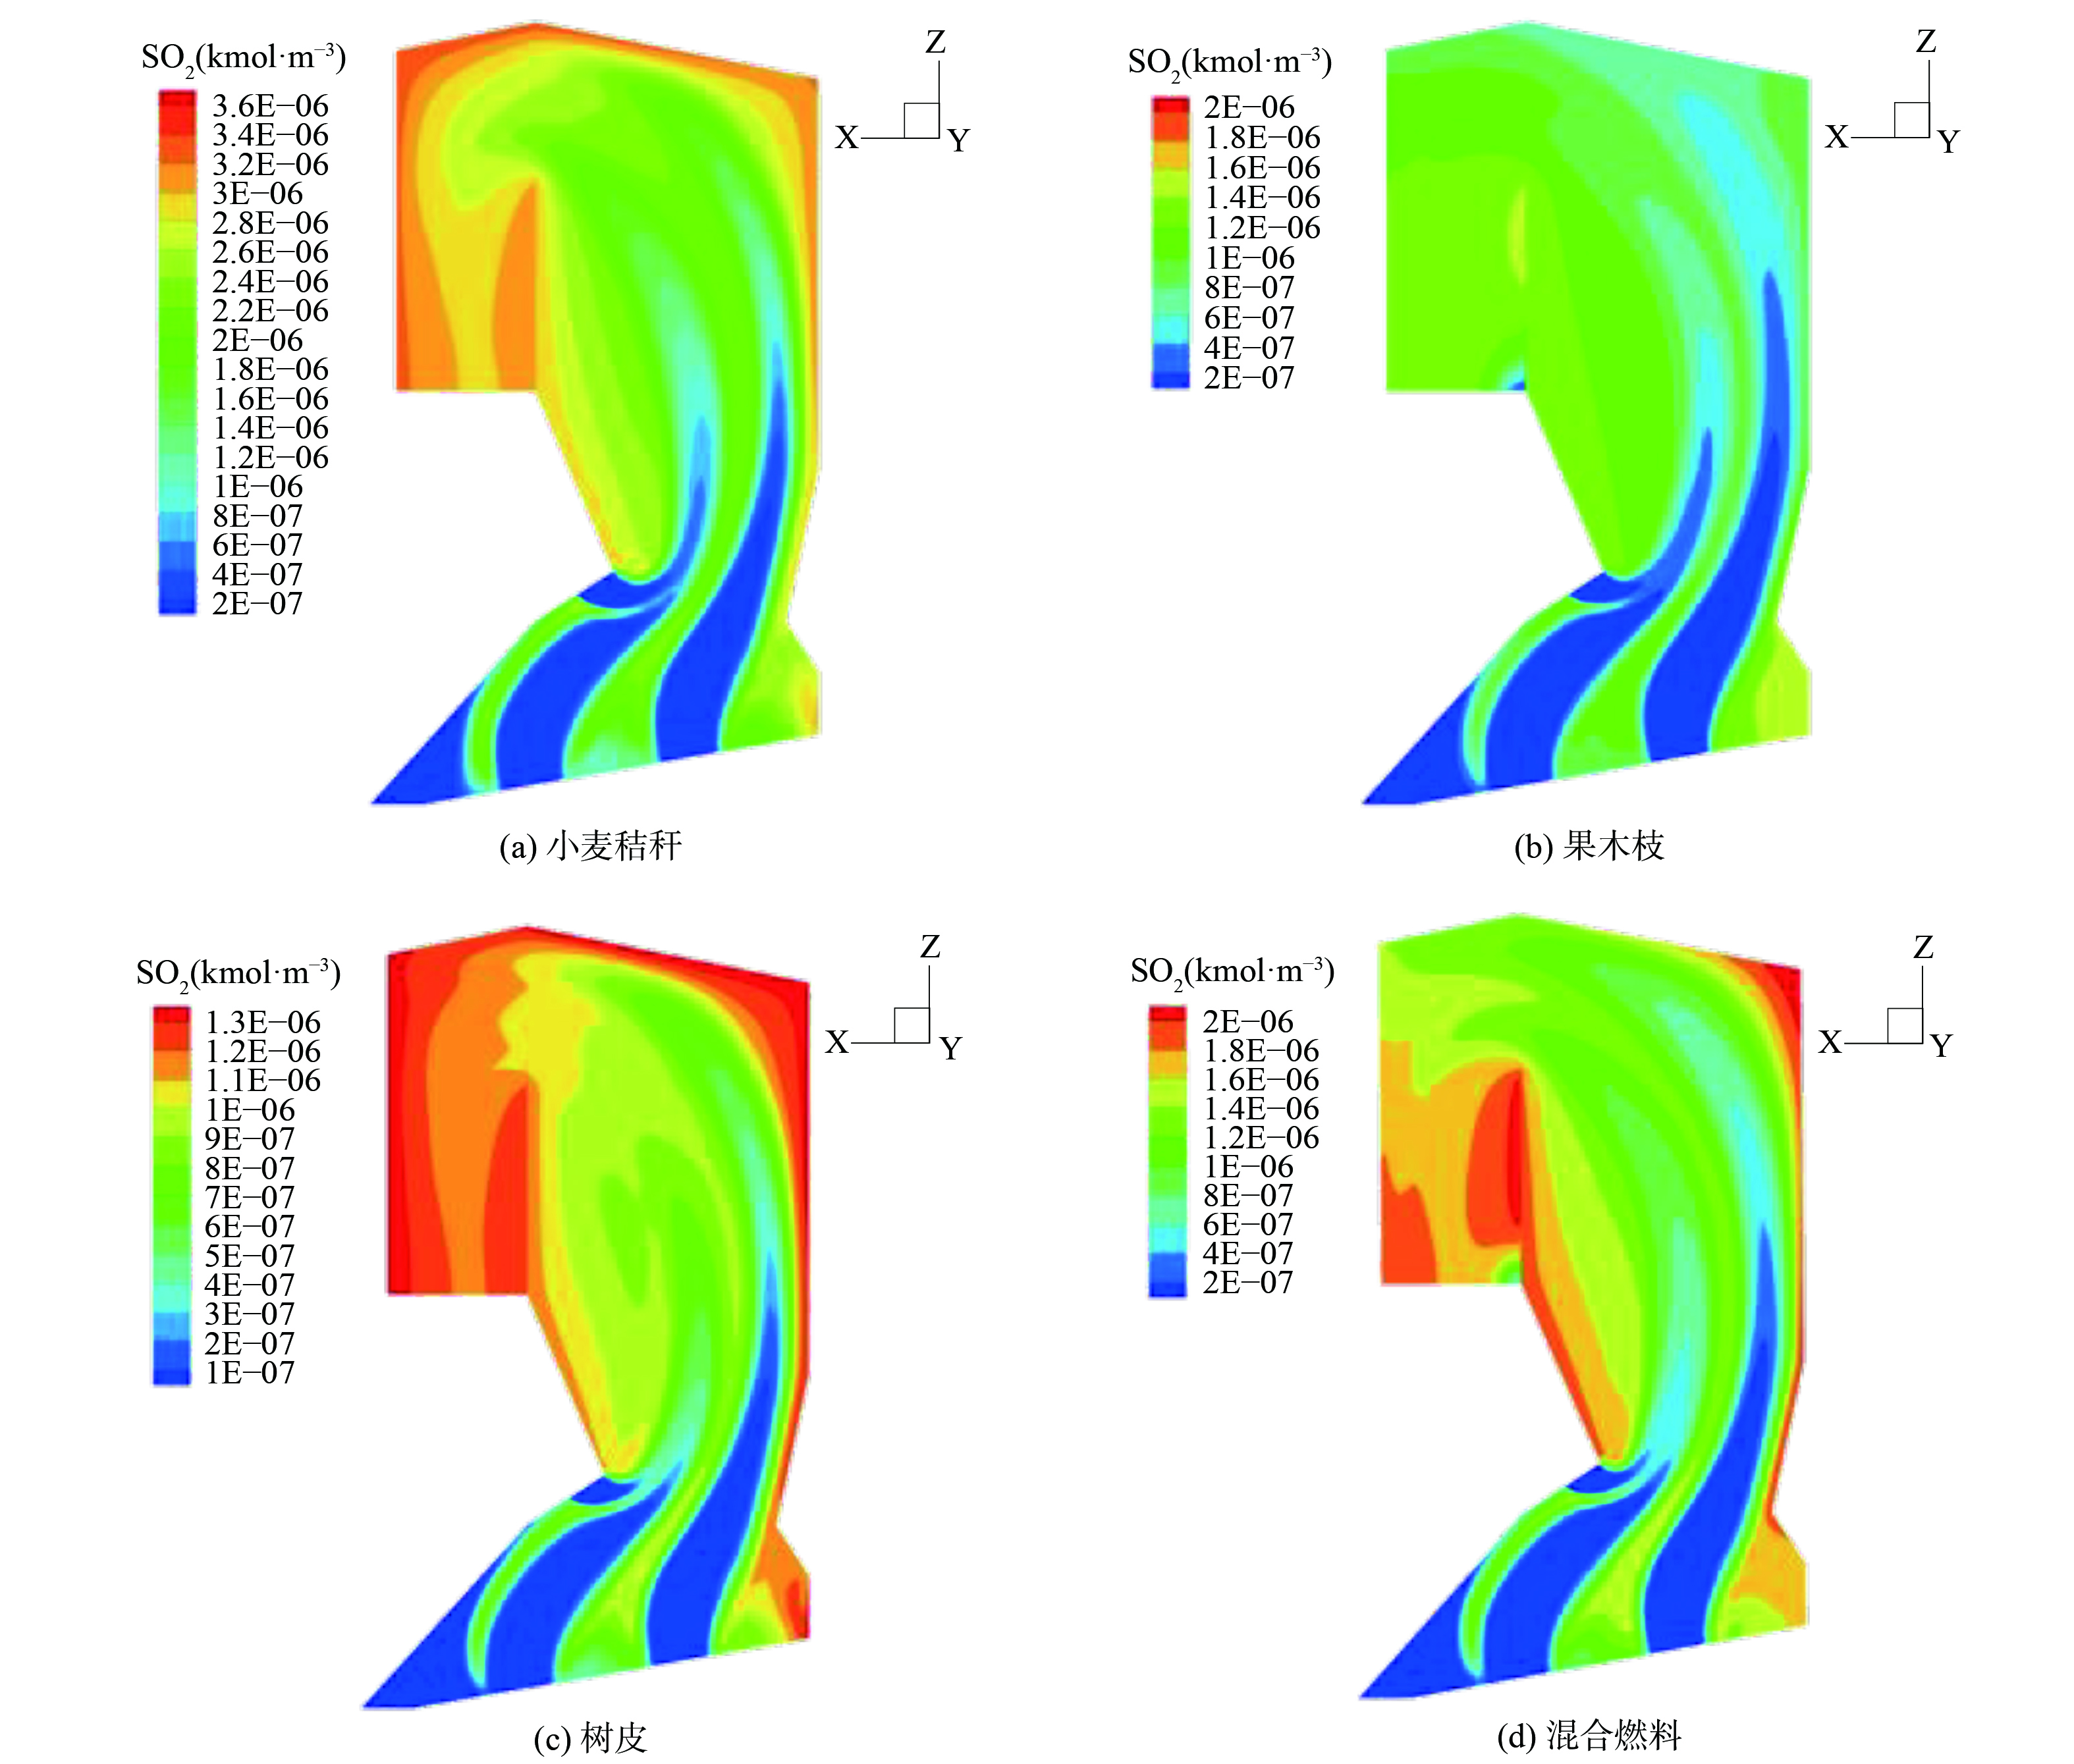
图 5 不同生物质燃料在炉膛y=4.6 m处SO2的质量浓度分布
Figure 5. SO2 concentration distribution of different biomass fuels at y=4.6m in the furnace
-

图 6 不同生物质燃料在炉膛y=4.6m处CO的浓度分布图
Figure 6. CO concentration distribution of different biomass fuels at y=4.6m in the furnace
-

图 7 不同生物质燃料在炉膛y=4.6m处CO2的浓度分布图
Figure 7. CO2 concentration distribution of different biomass fuels at y=4.6m in the furnace
-
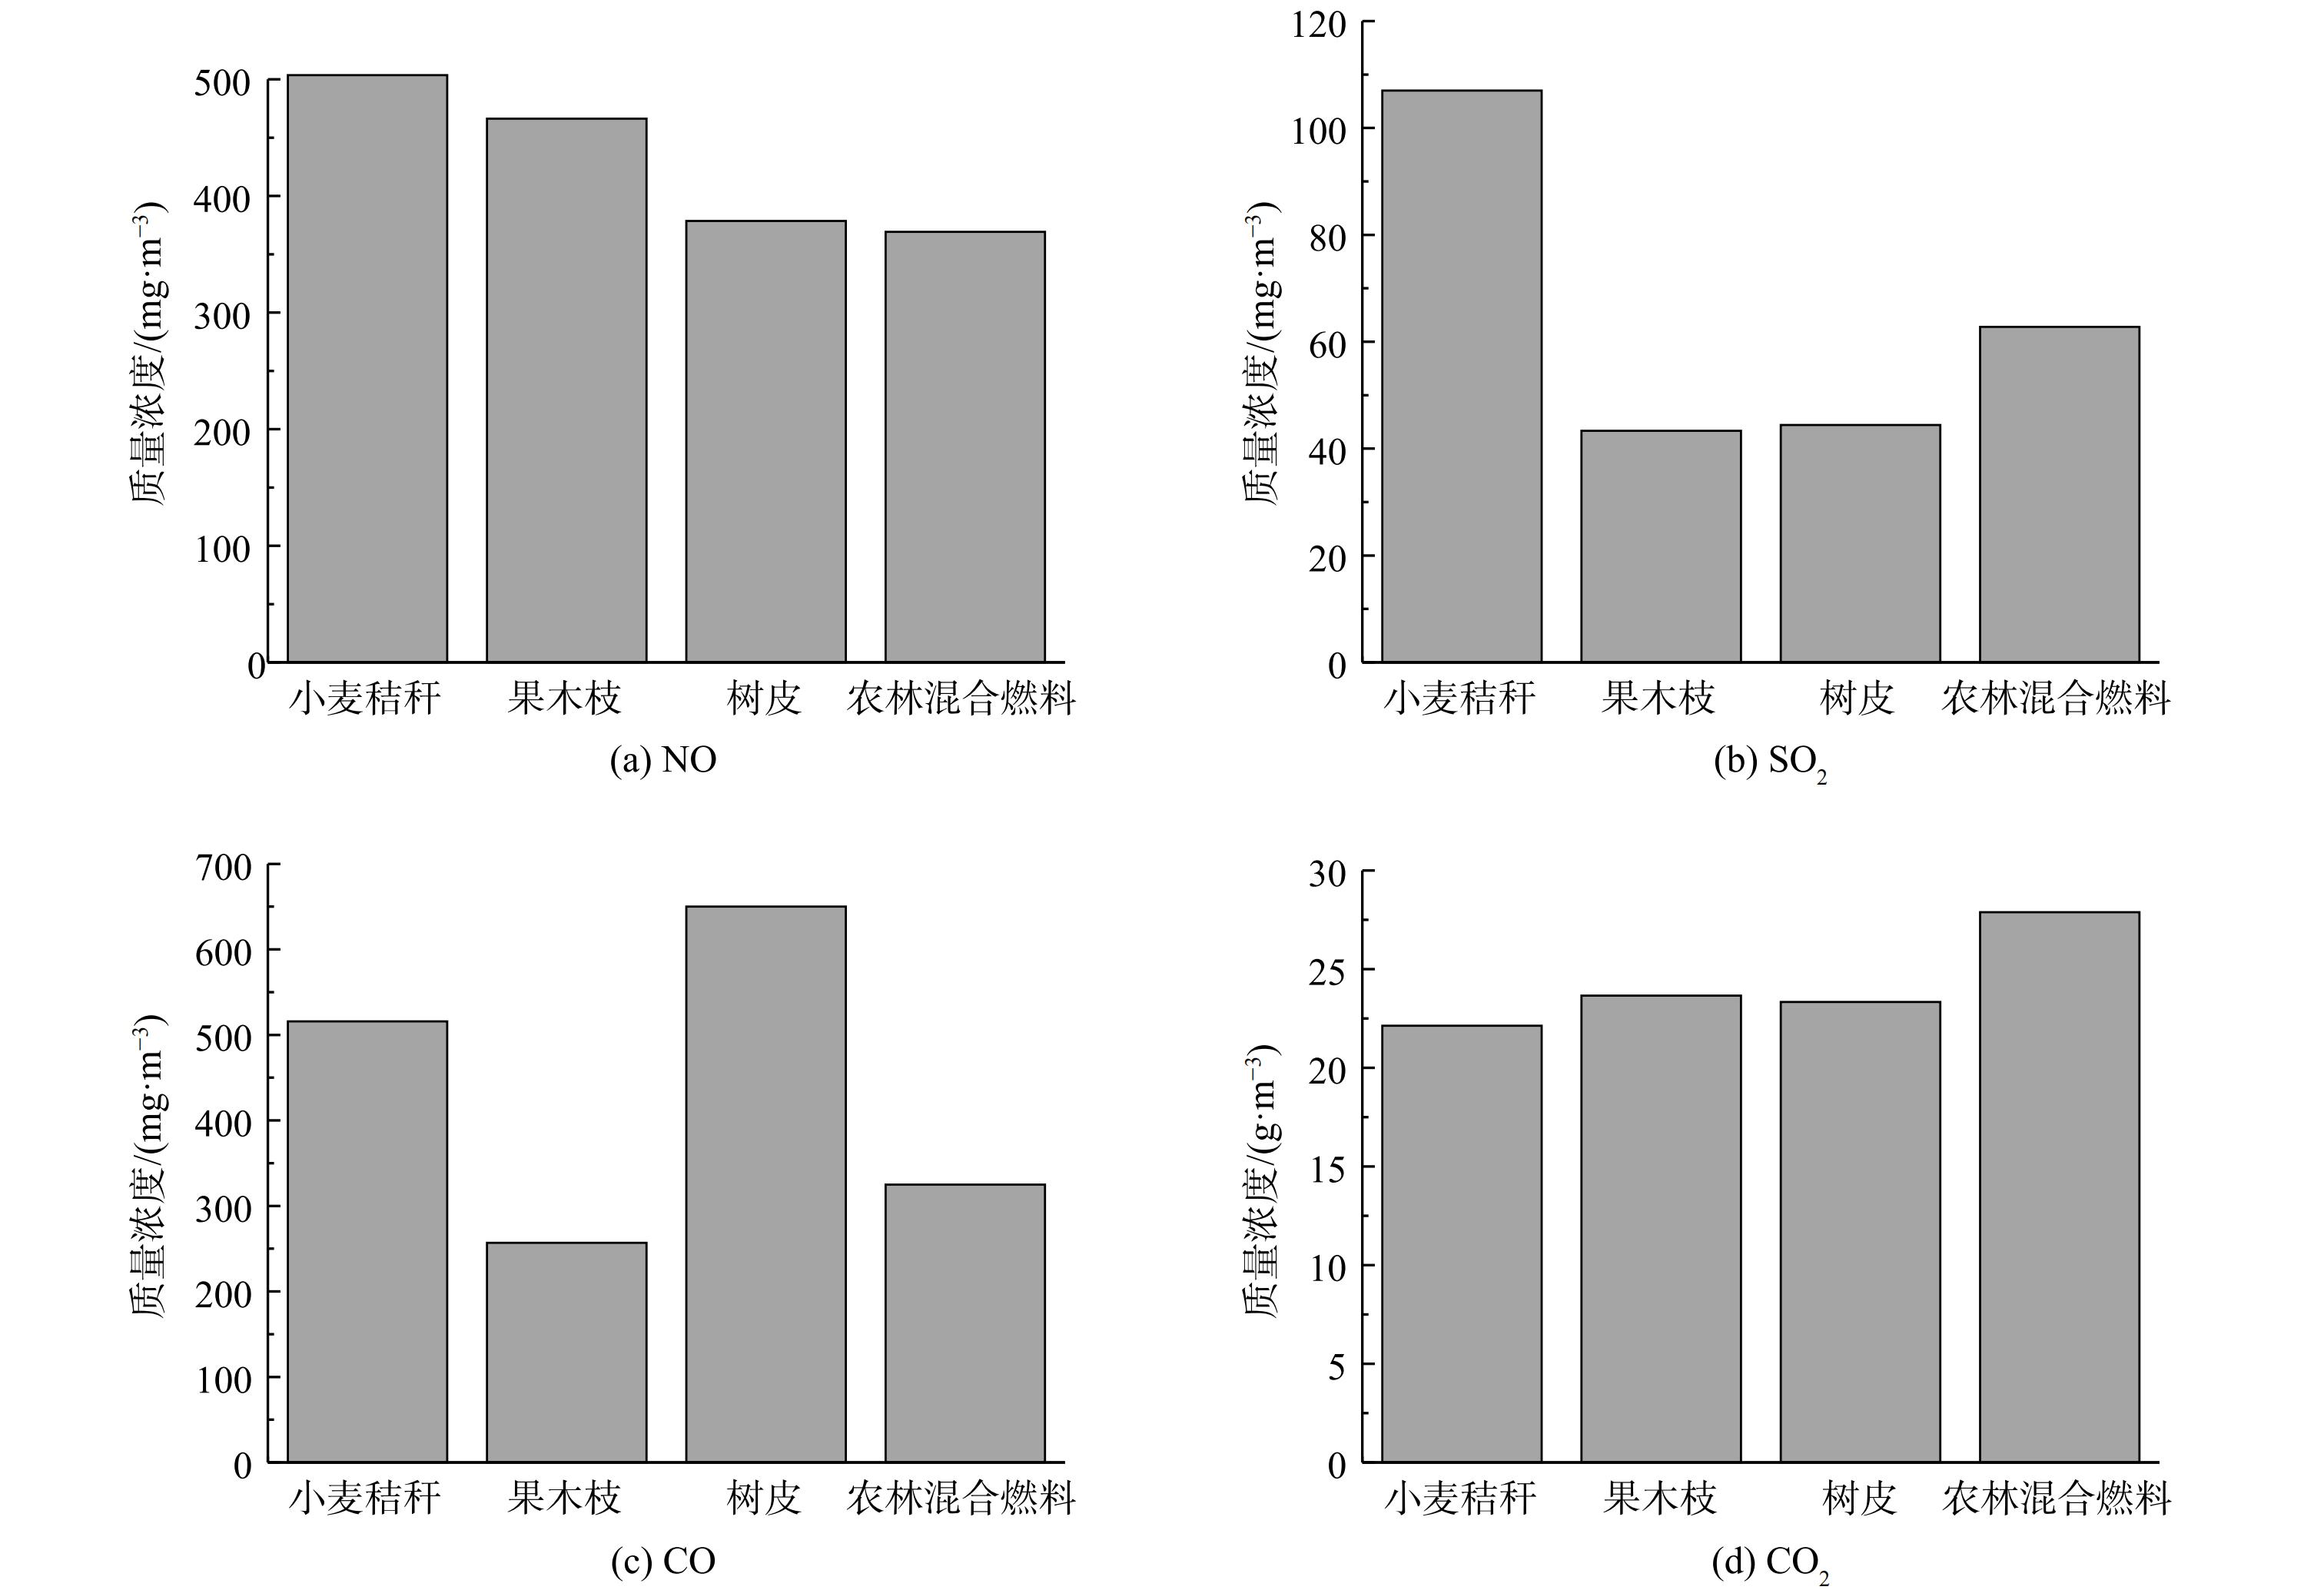
图 8 不同生物质燃料在炉膛内烟气组分浓度对比图
Figure 8. Comparison diagrams of flue gas component concentration of different biomass fuels in furnace
-
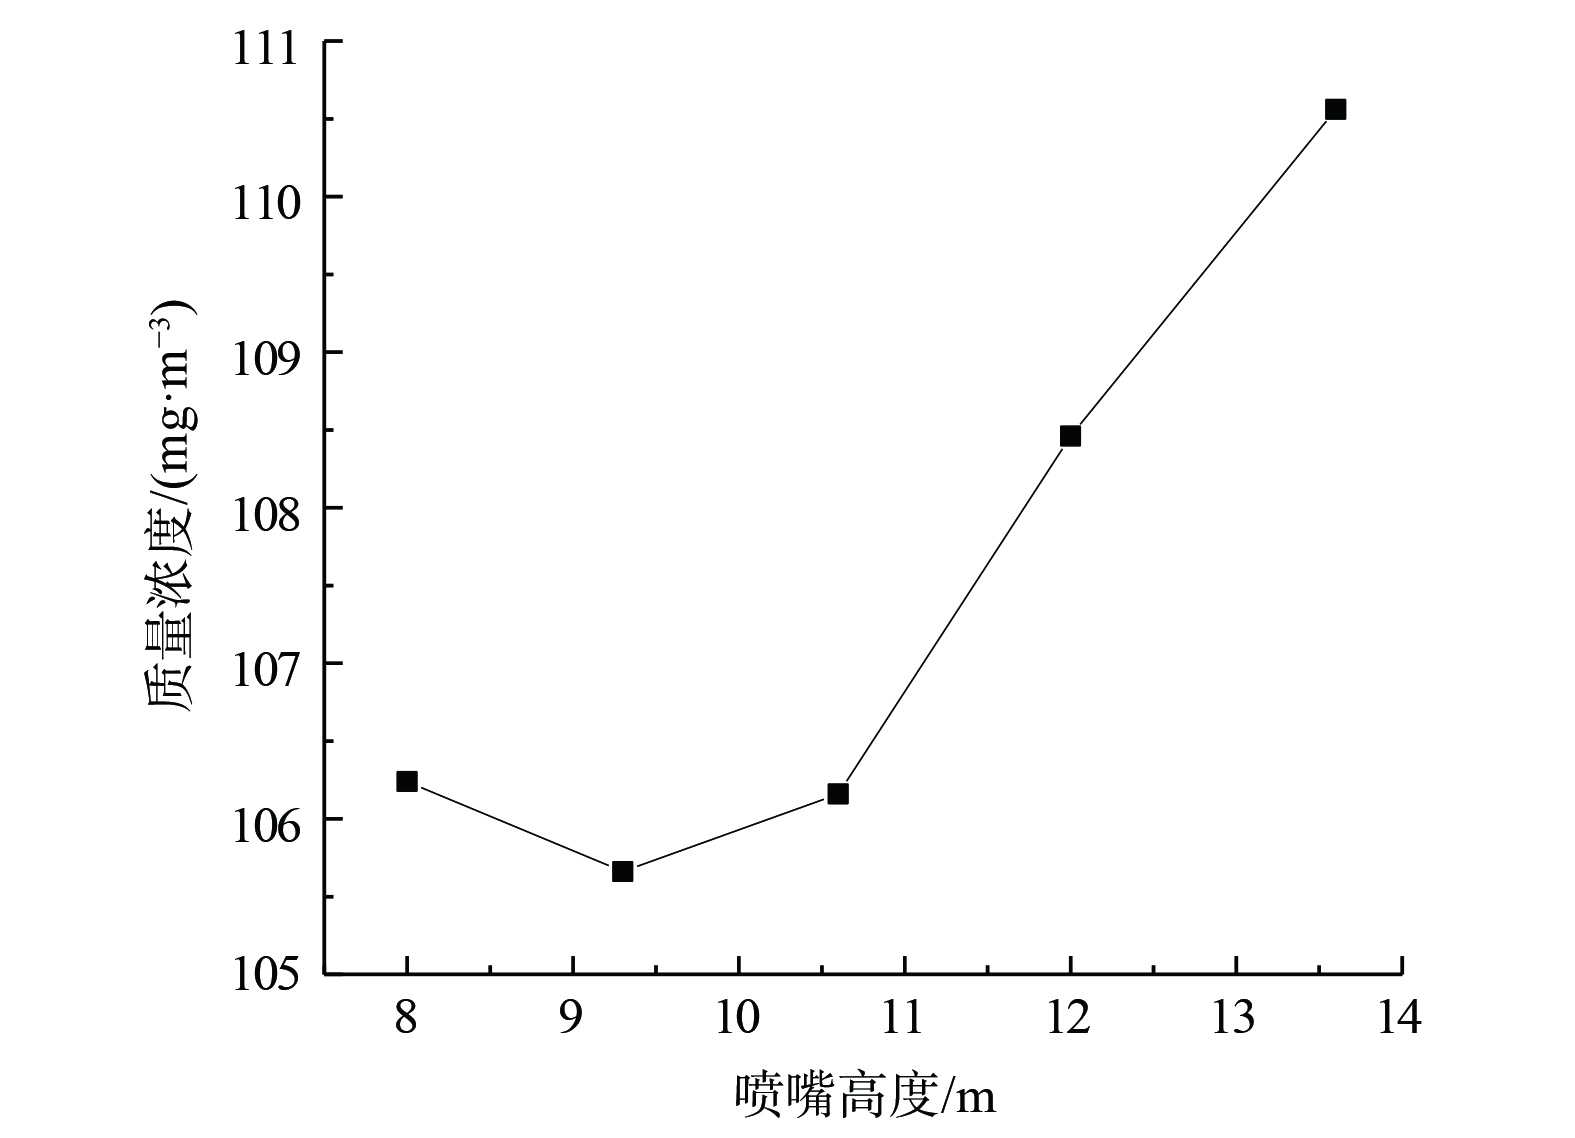
图 9 还原剂喷嘴高度与烟道出口处NO浓度关系图
Figure 9. Diagram of relationship between reducing agent nozzle height and NO concentration at flue exit
-
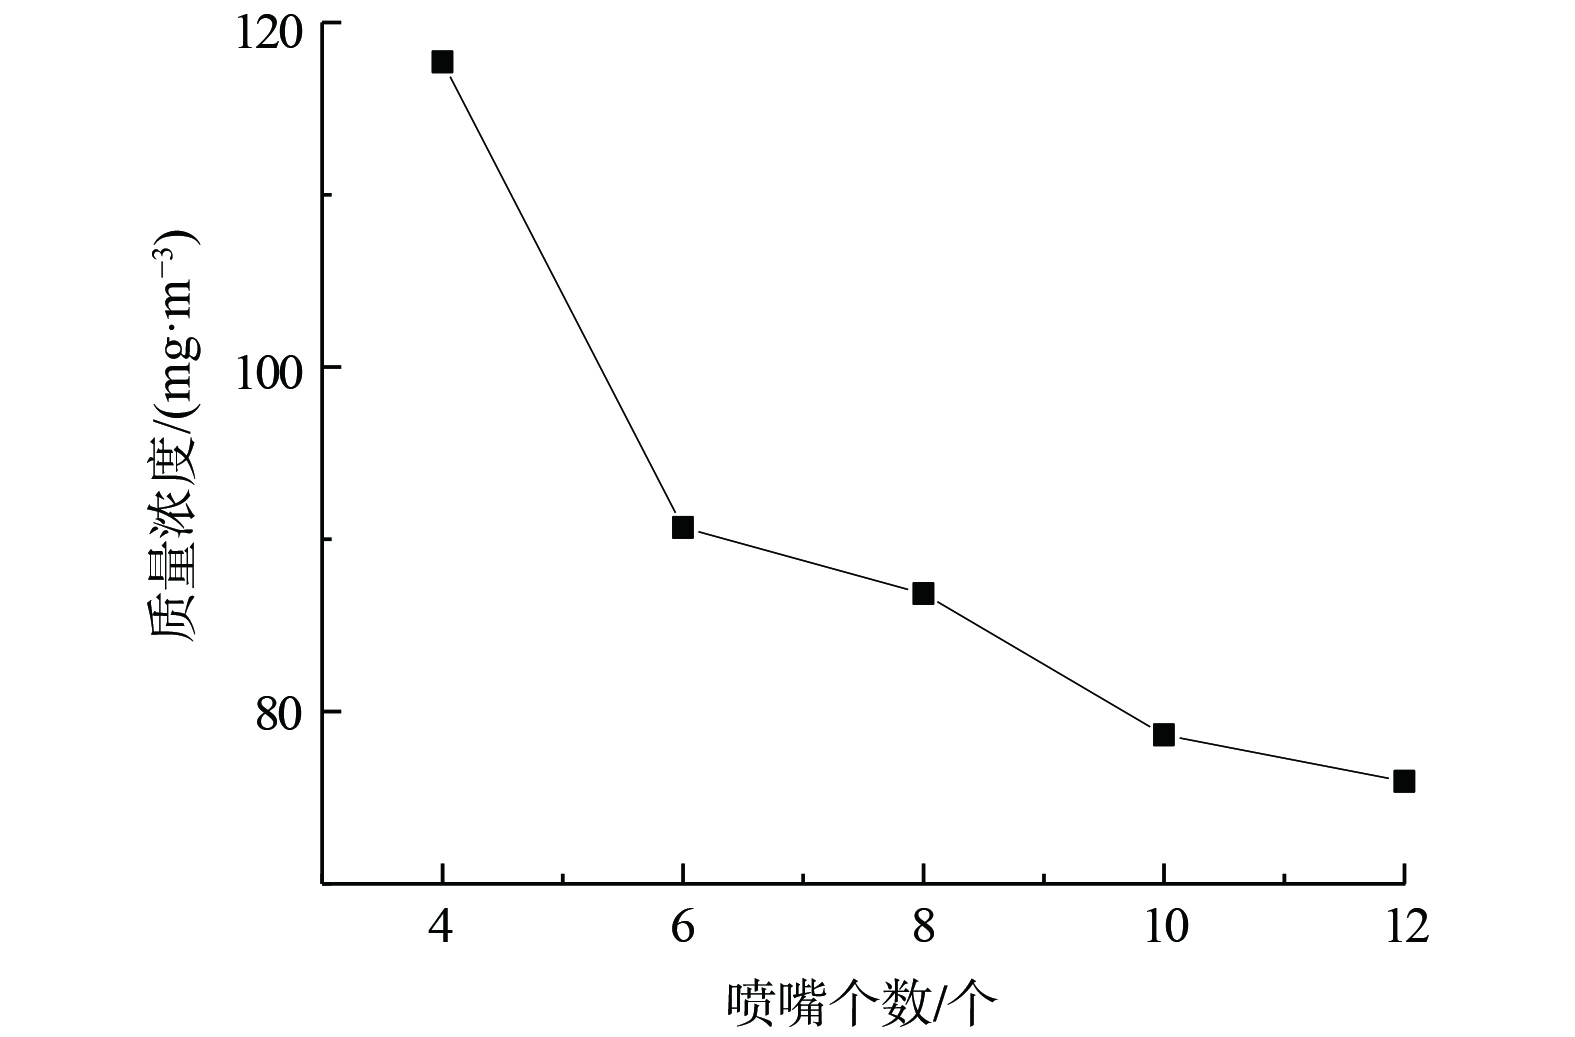
图 10 喷嘴数量与烟道出口处NO质量浓度的关系
Figure 10. Diagram of the relationship between the number of nozzles and NO concentration at flue exit
-
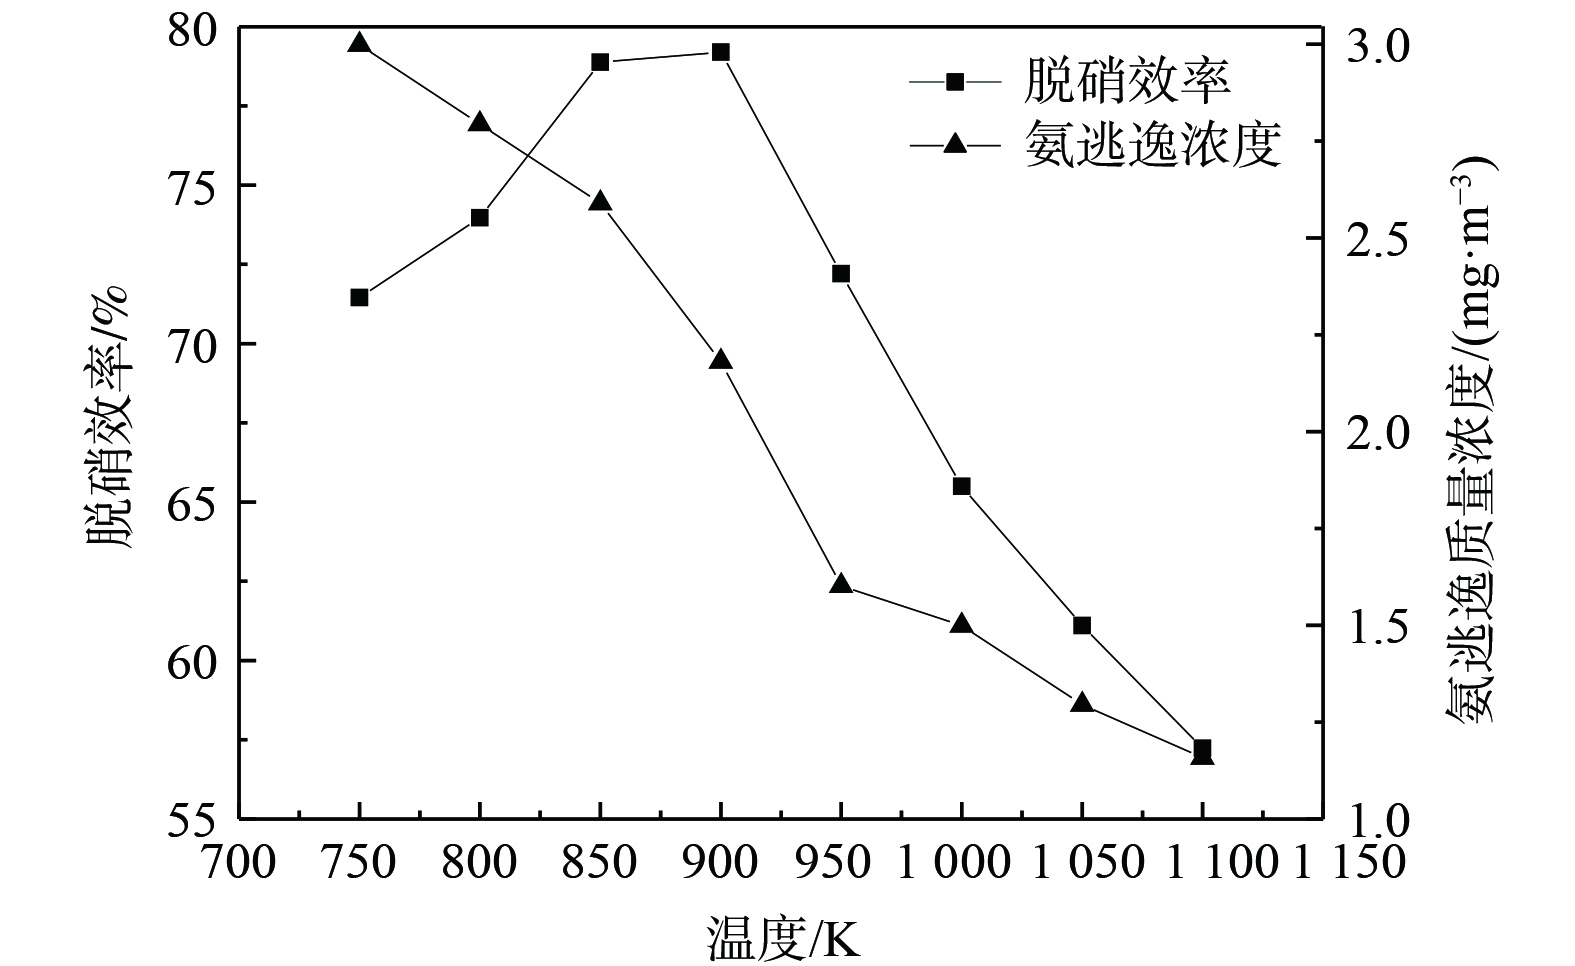
图 11 反应温度对脱硝率和氨逃逸的影响
Figure 11. Effect of reaction temperature on denitrification rate and ammonia escape amount
-
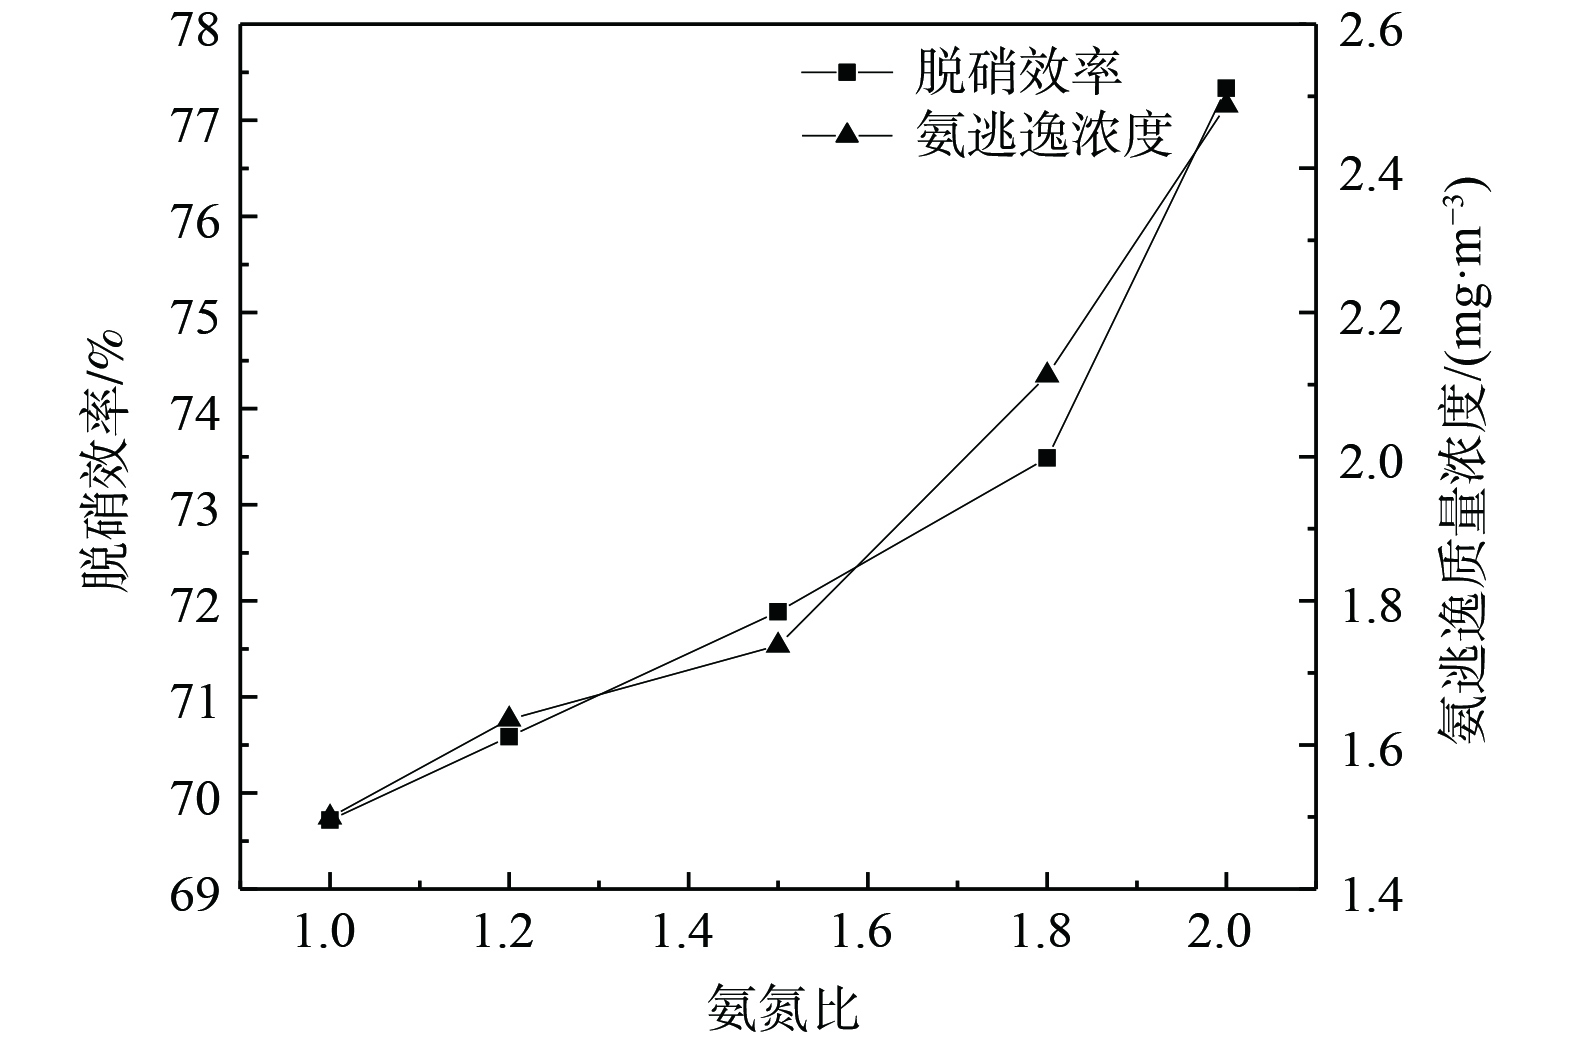
图 12 氨氮比对脱硝率和氨逃逸的影响
Figure 12. Effect of ammonia nitrogen ratio on denitrification rate and ammonia escape amount
Figure
12 ,Table
3 个