-
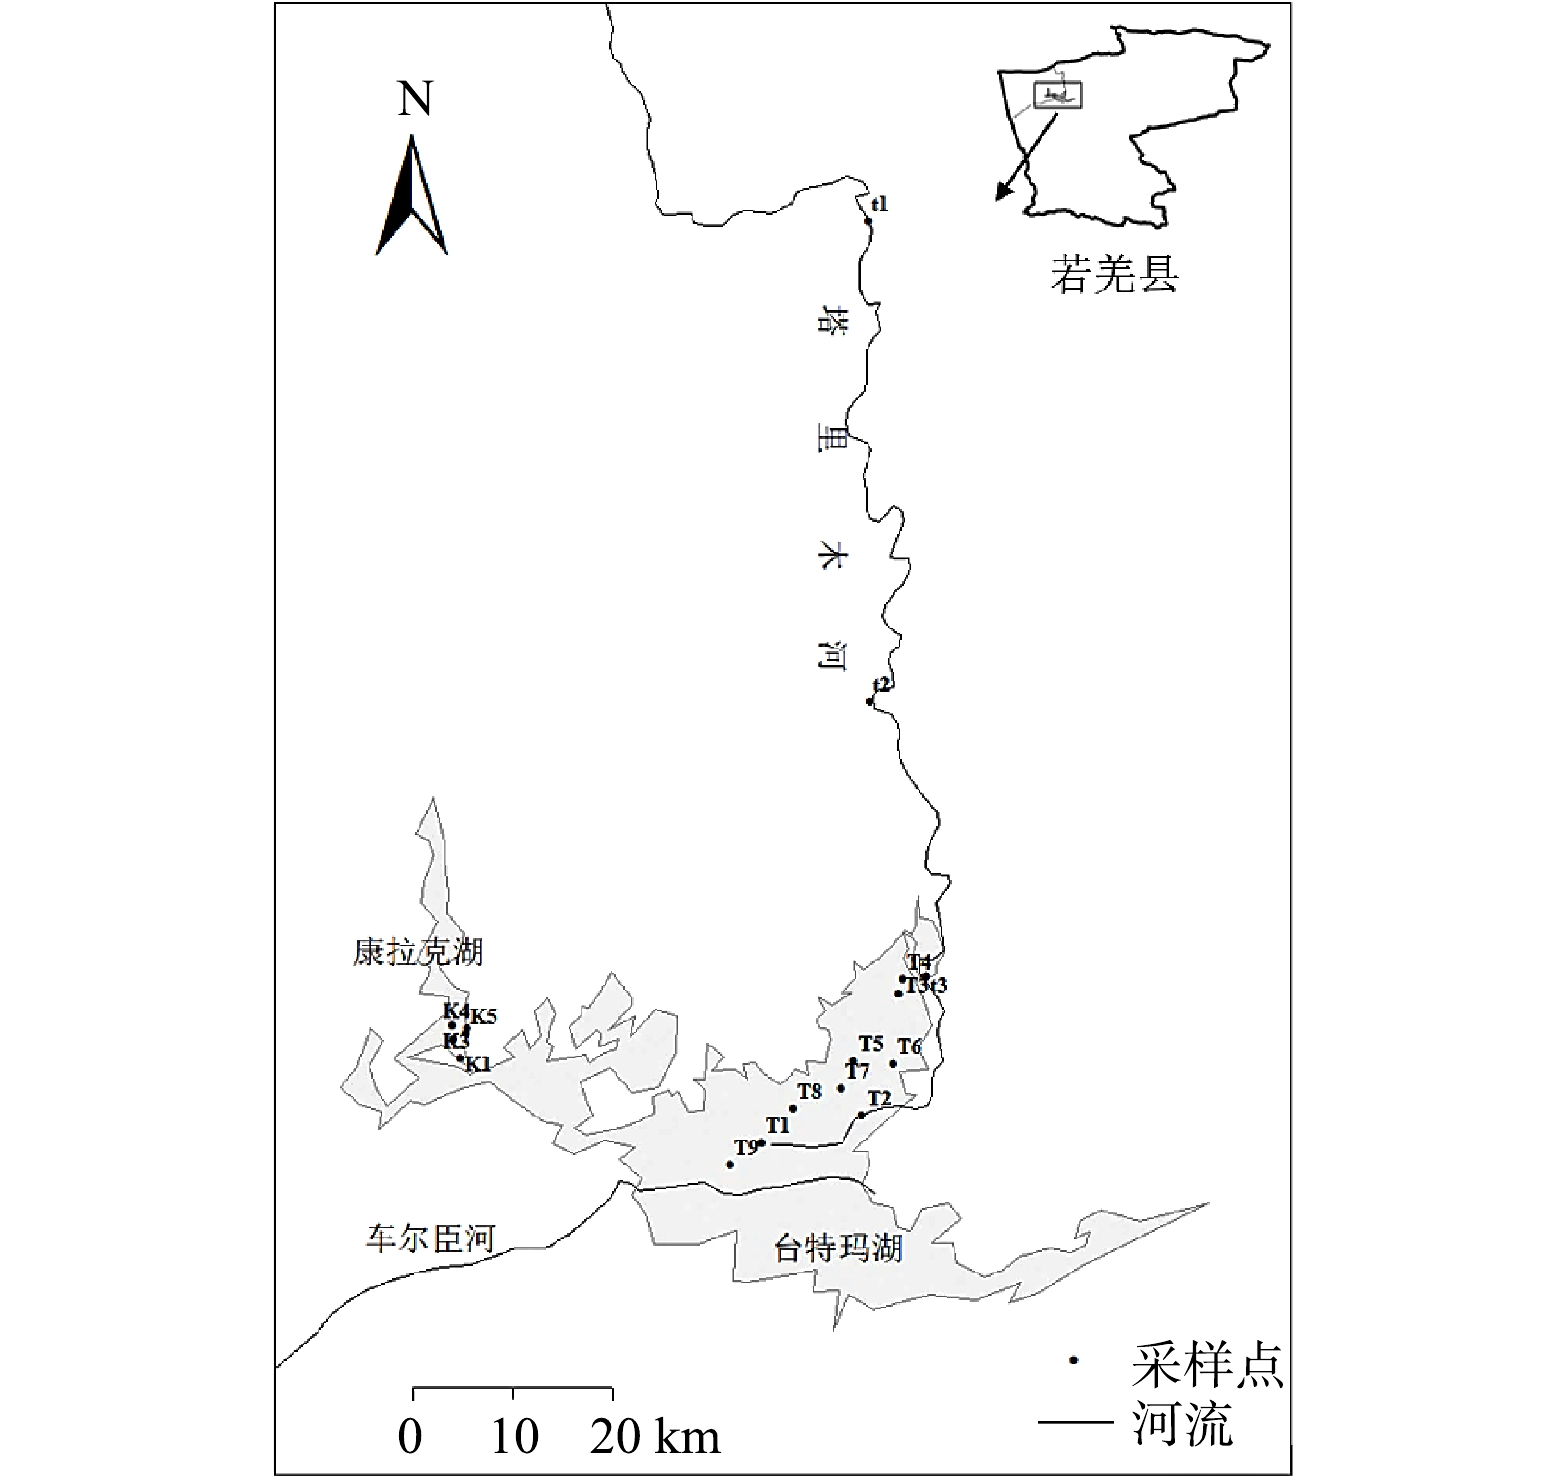
图 1 采样点分布图
Figure 1. Distribution of sampling sites
-
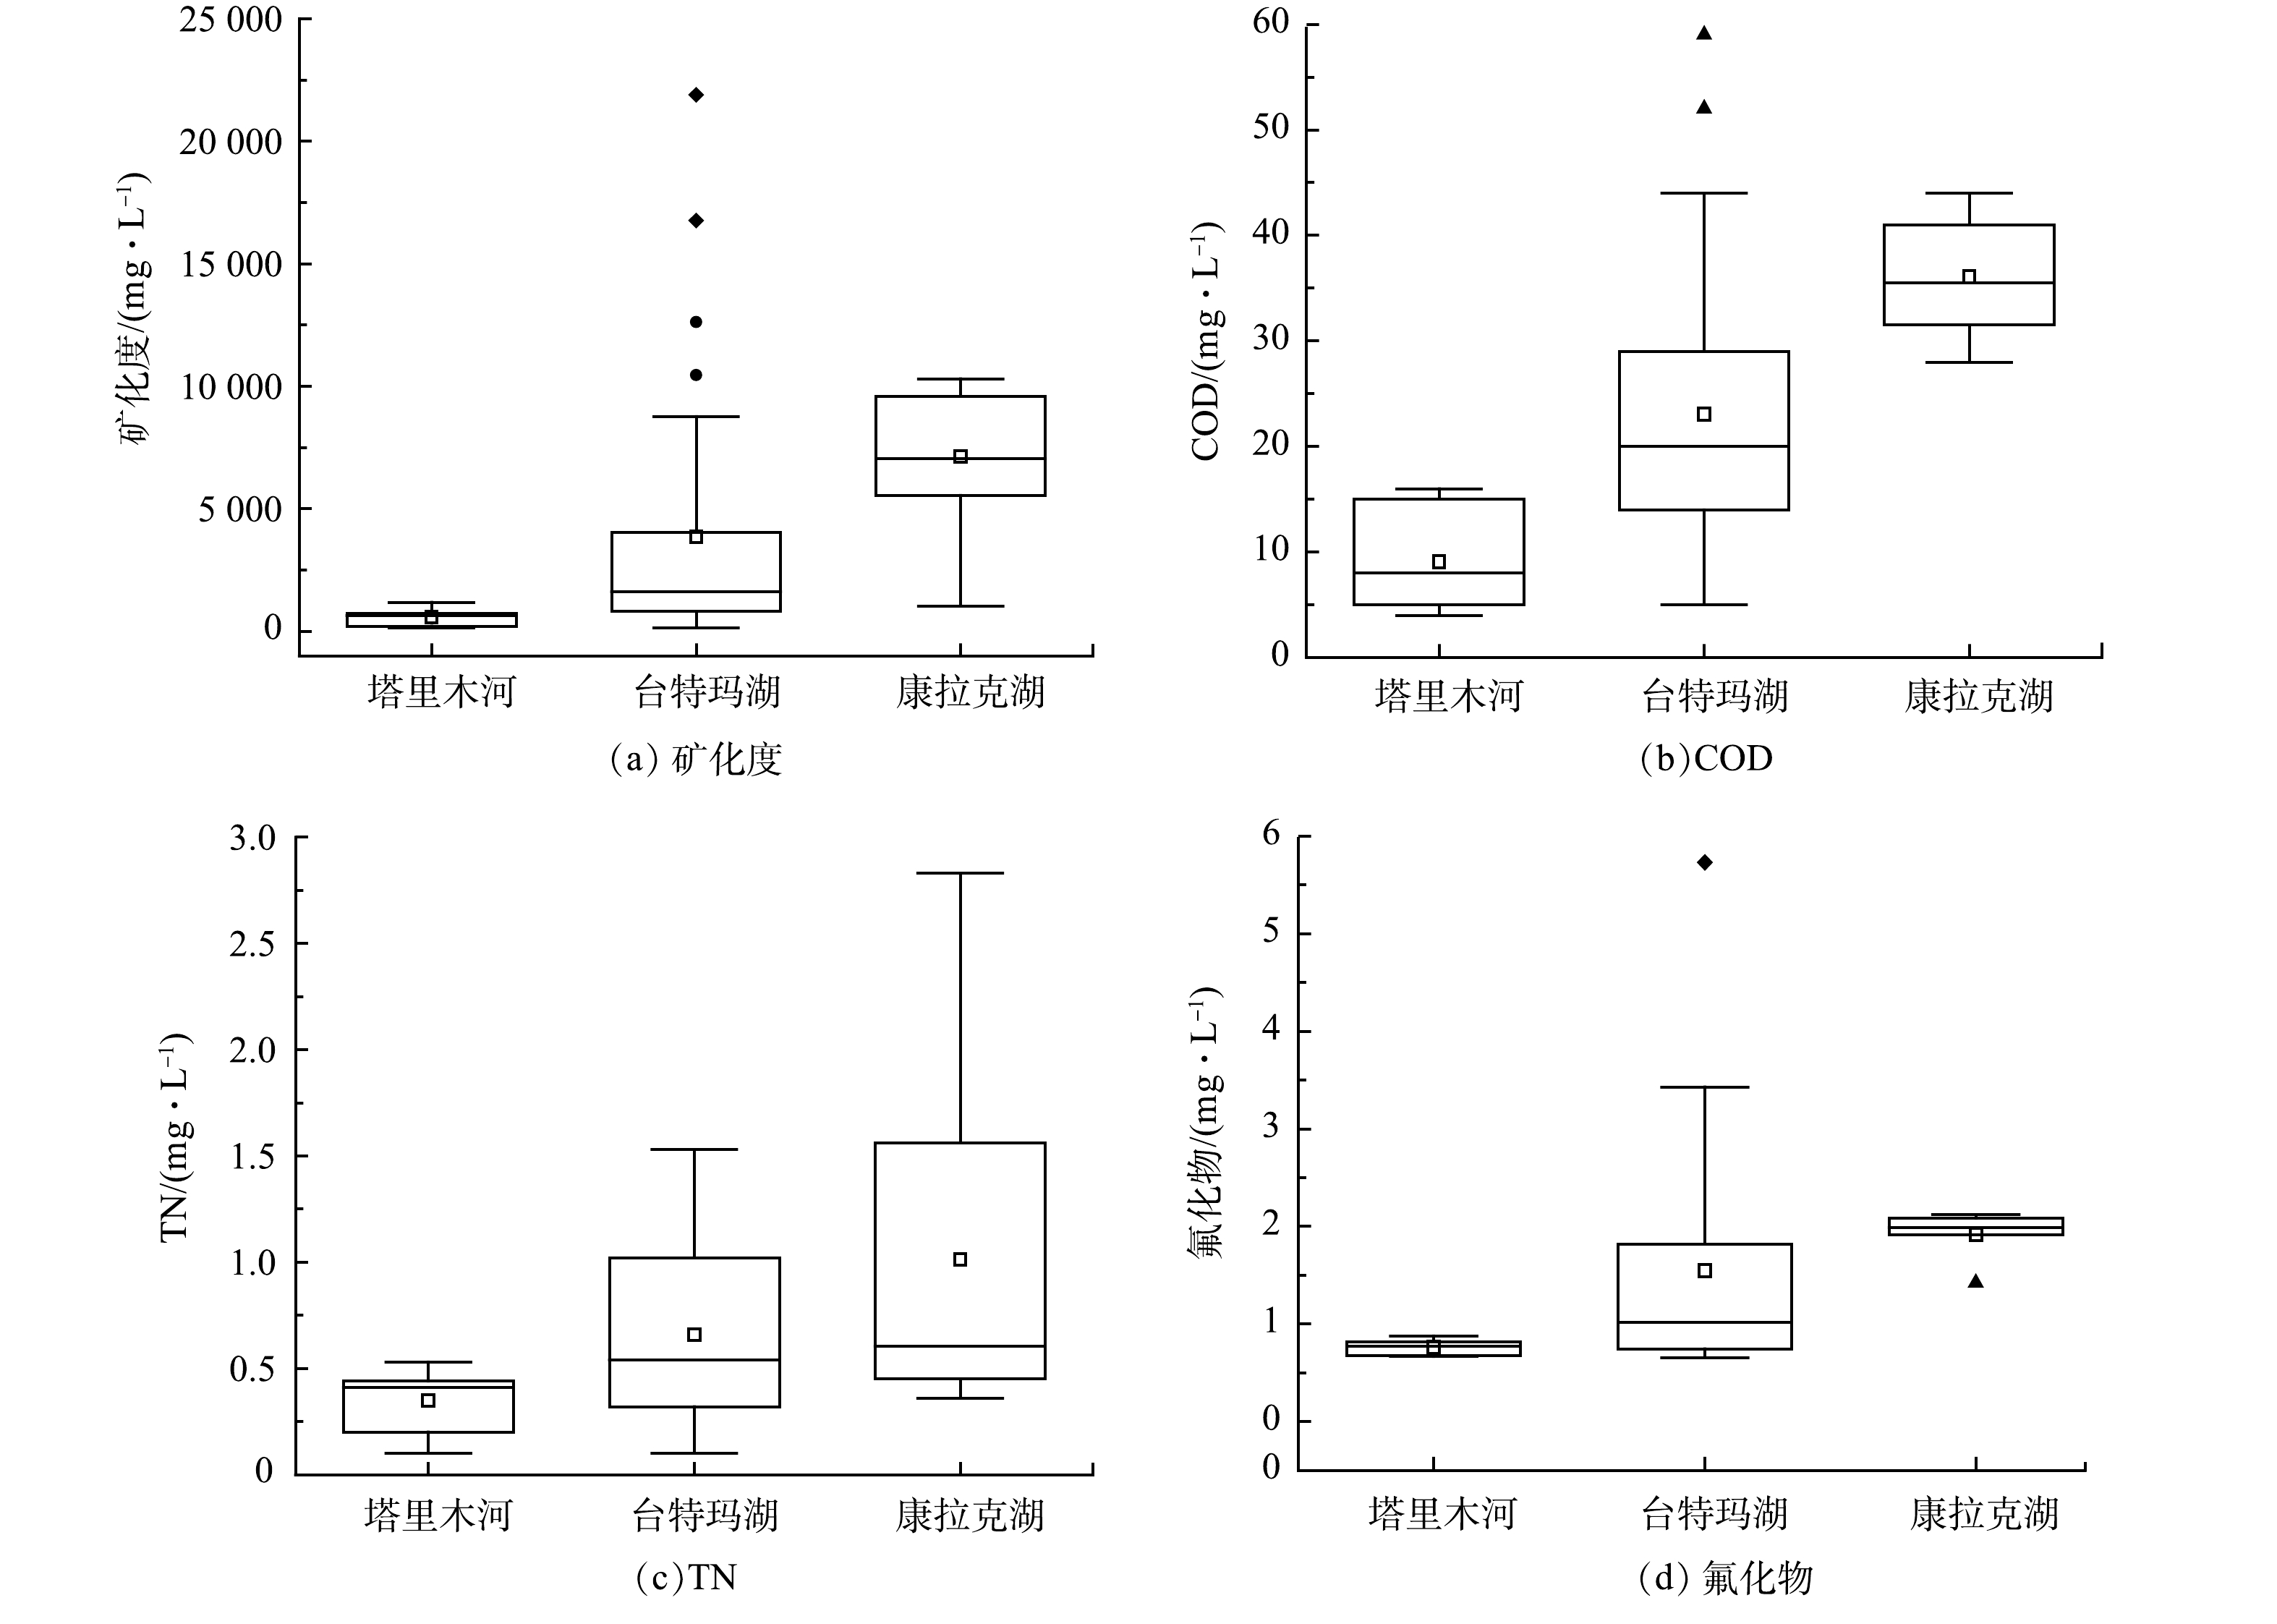
图 2 台特玛湖流域矿化度、COD、TN、氟化物浓度箱图
Figure 2. Boxplots of salinity, COD, TN and fluoride in Tetma Lake
-
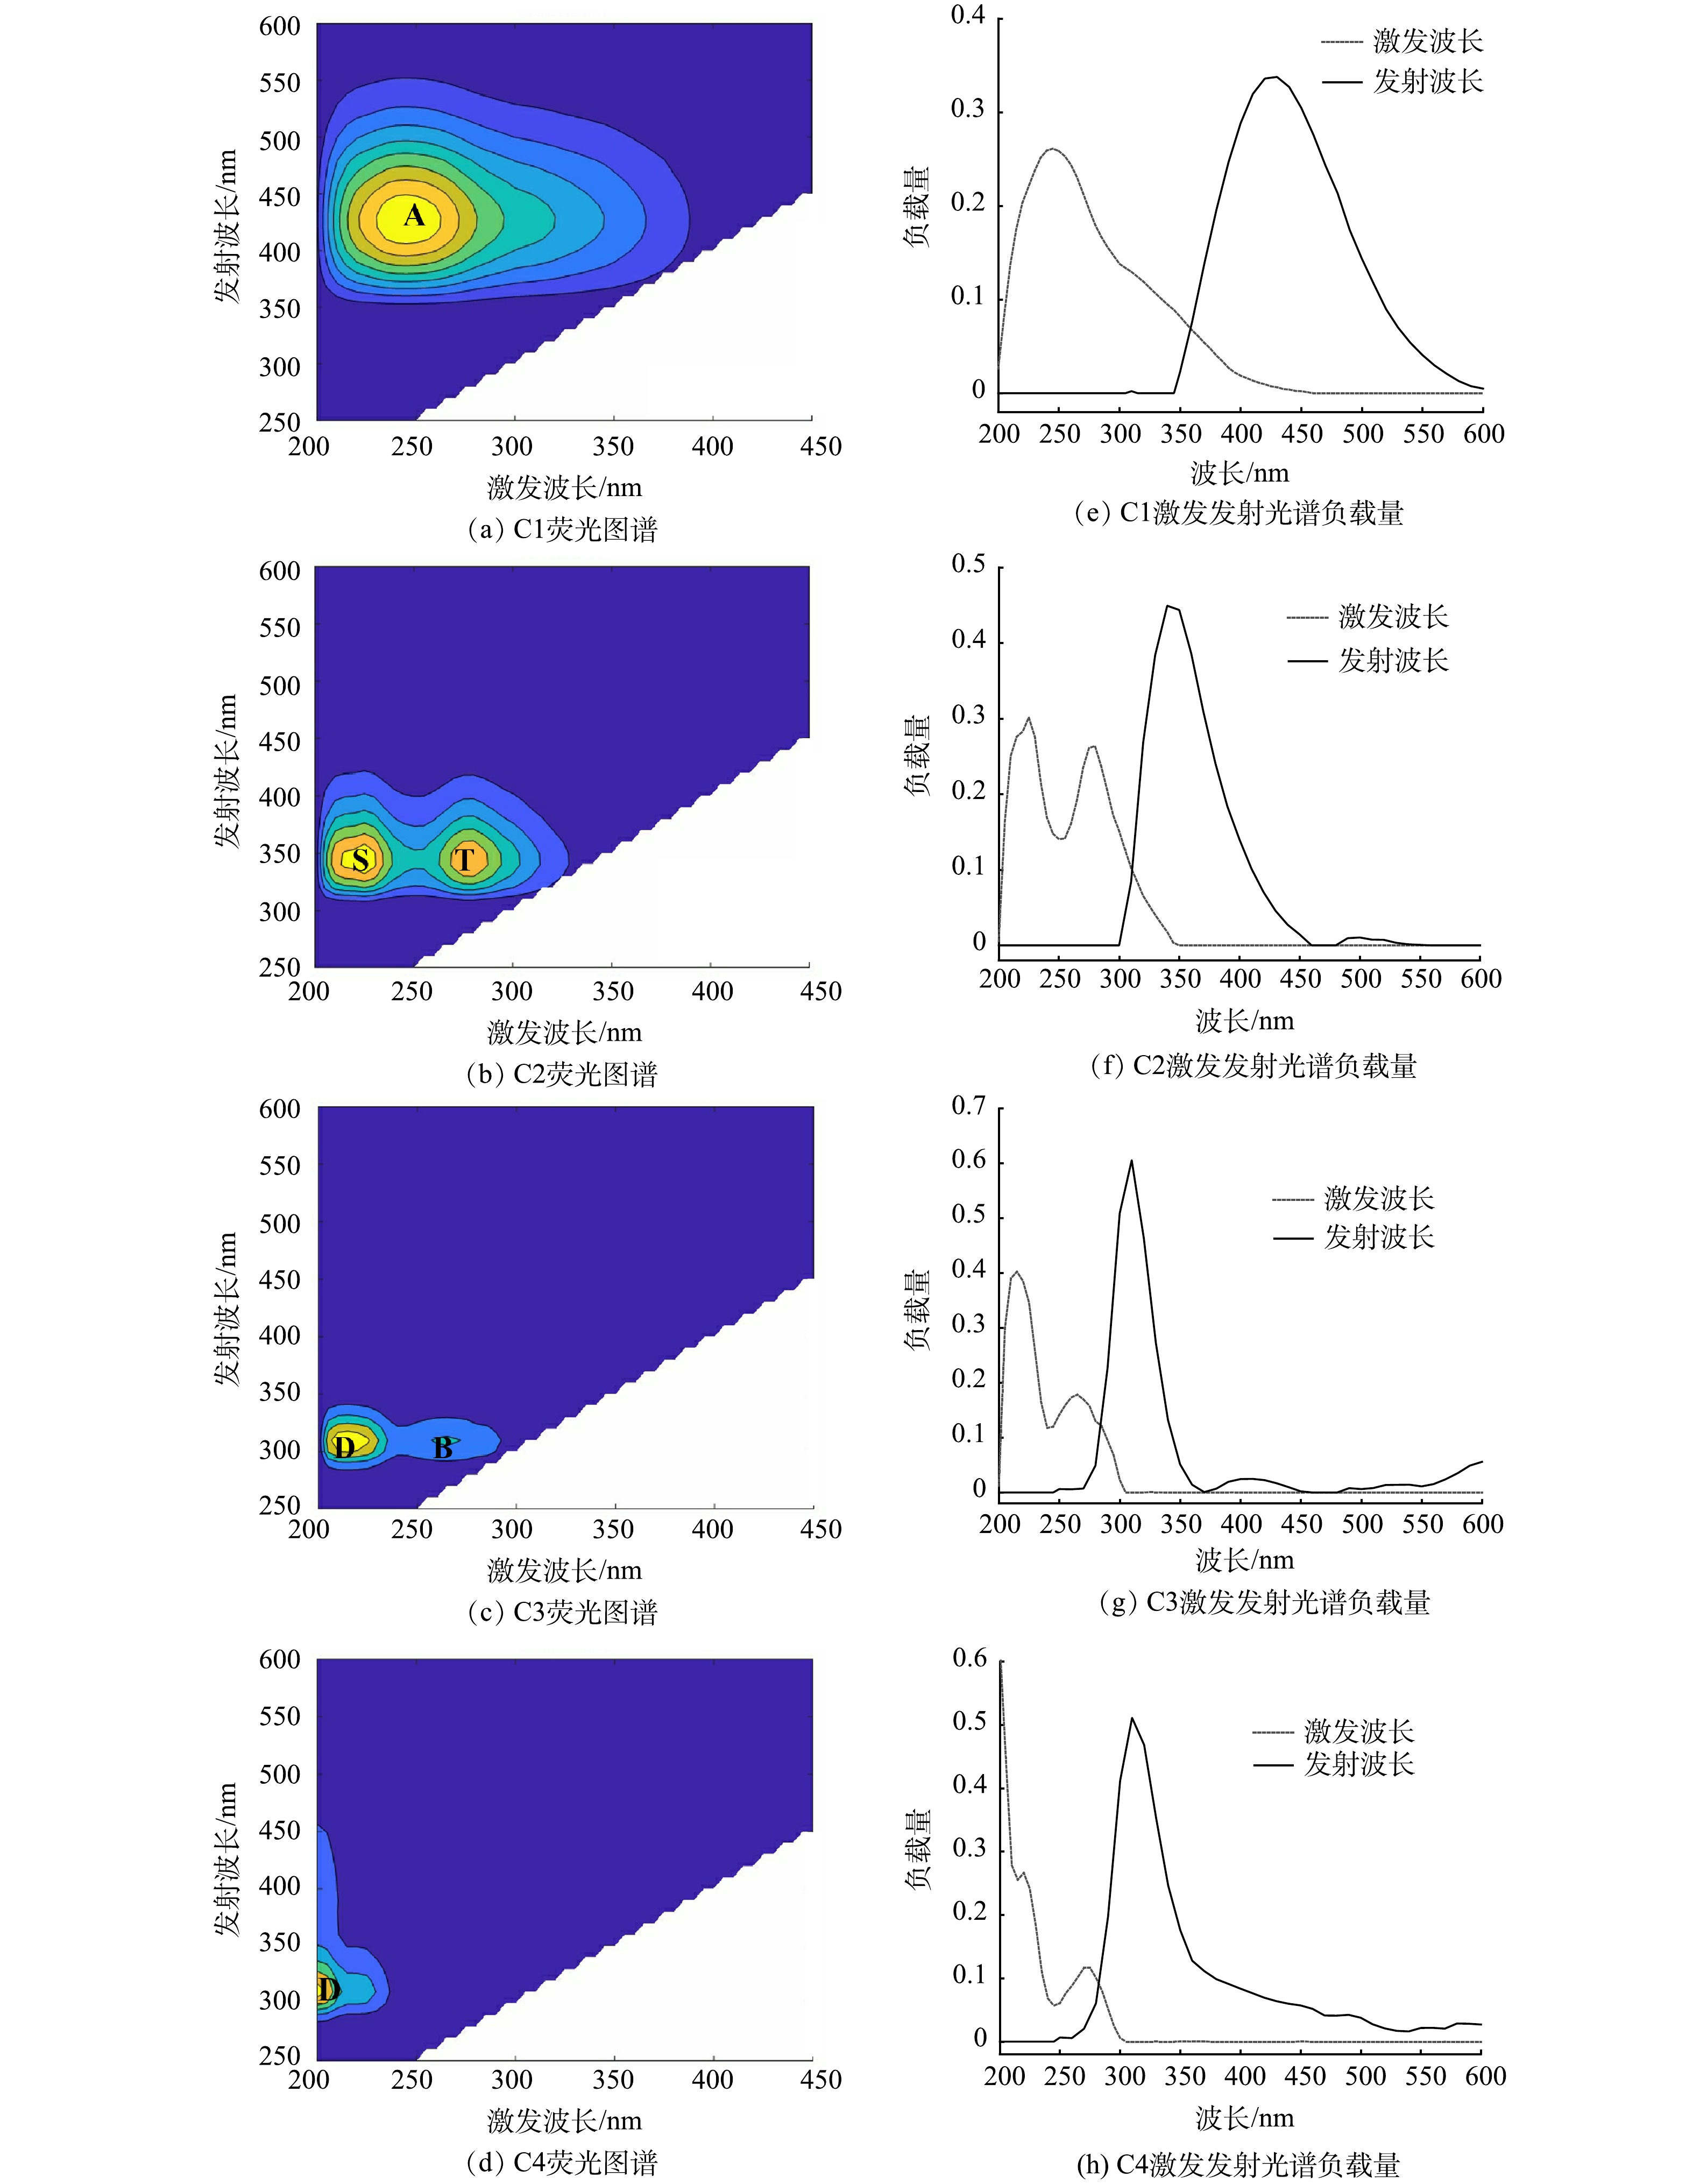
图 3 DOM组分光谱图和波长曲线
Figure 3. EEMs spectra and wavelength curves of DOM components
-
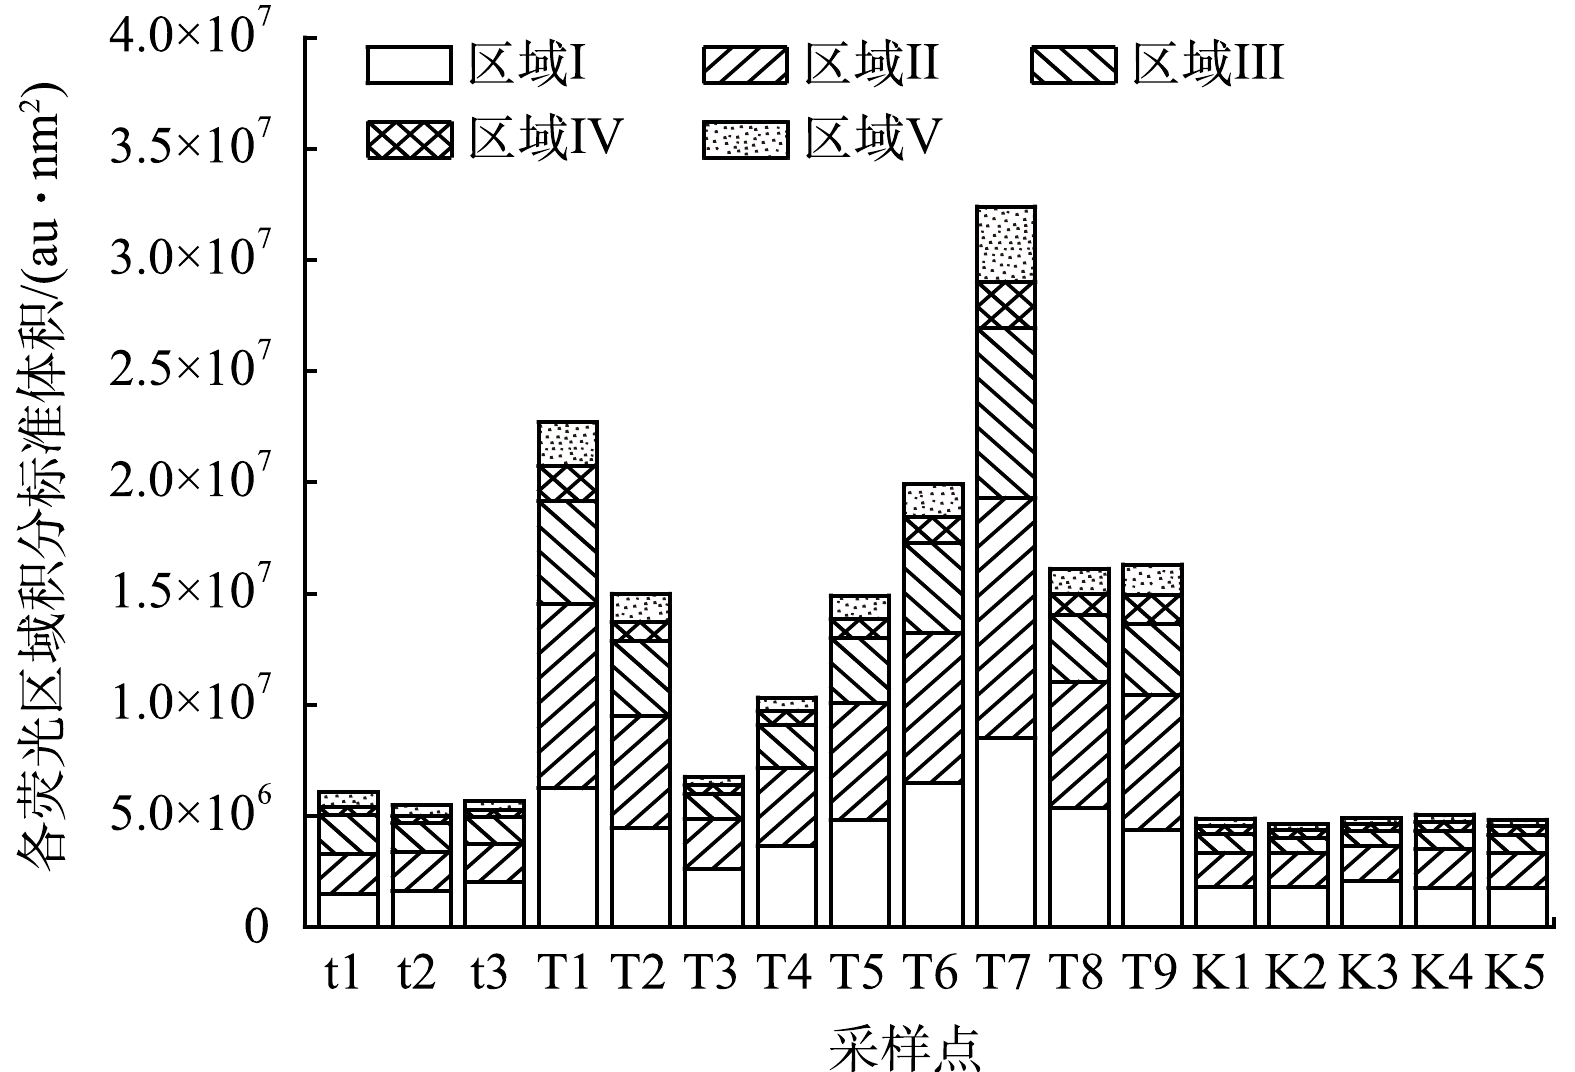
图 4 各水样标准荧光积分体积
Figure 4. Normalized fluorescence integral volume of water samples
-
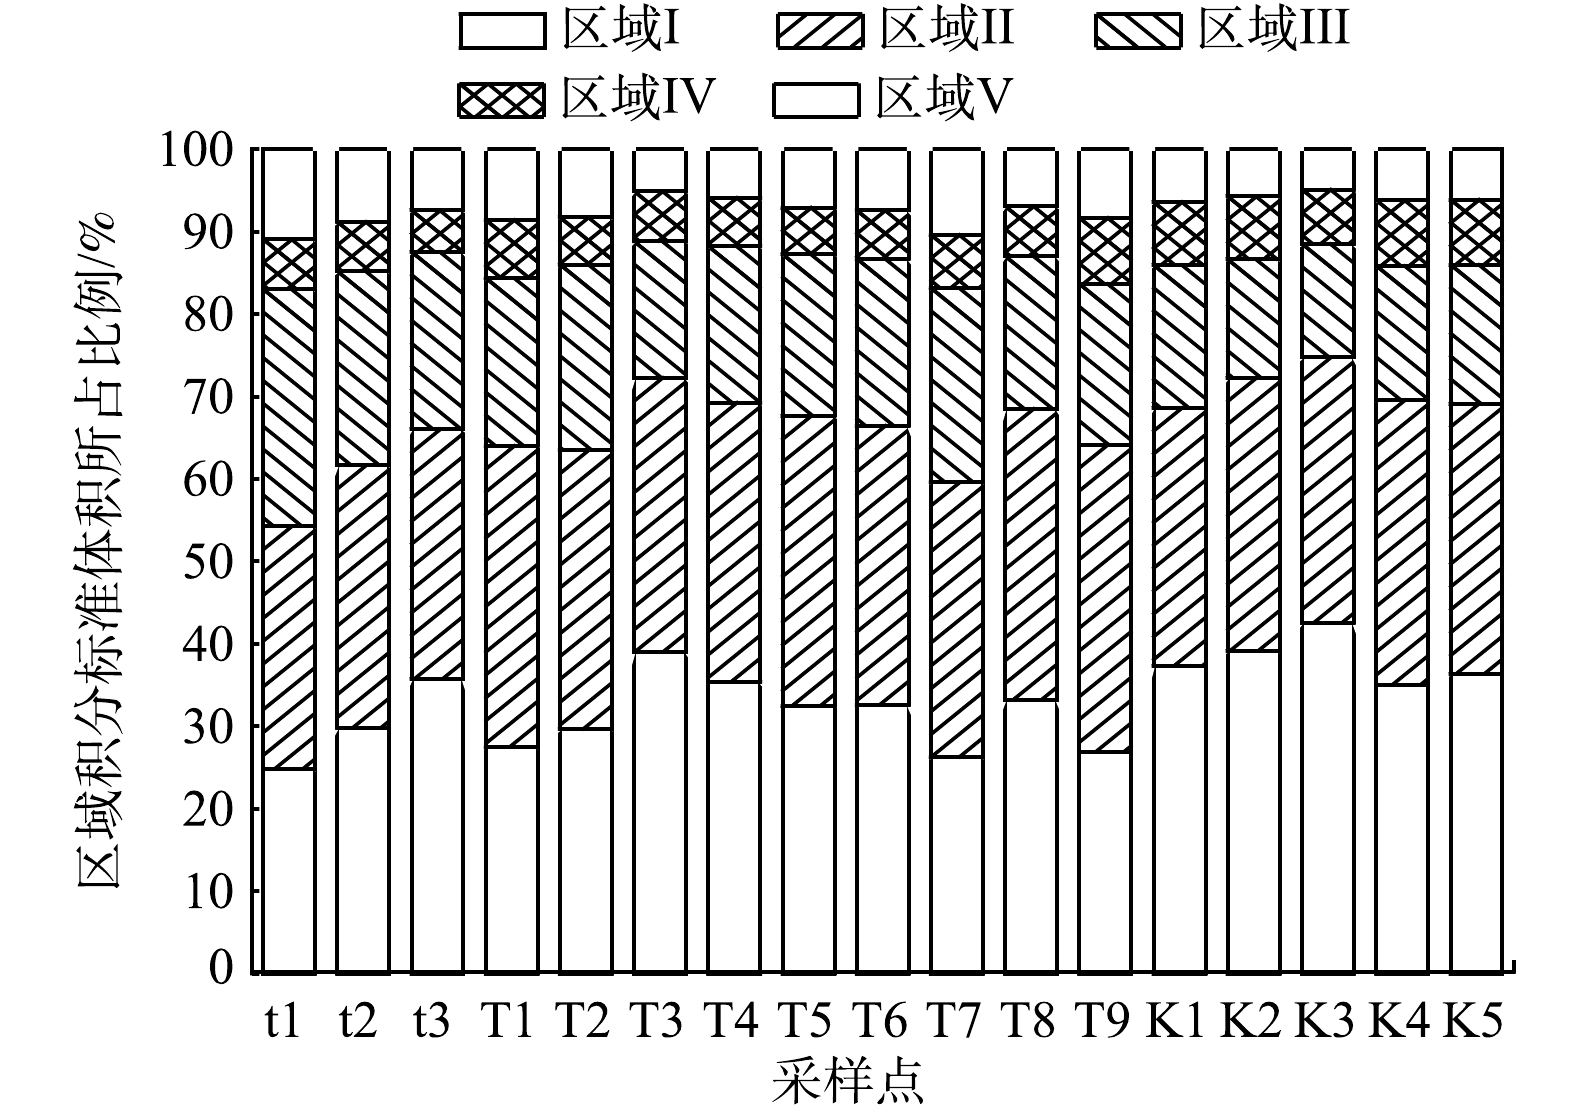
图 5 各区域积分占比情况
Figure 5. The proportion of each region
-
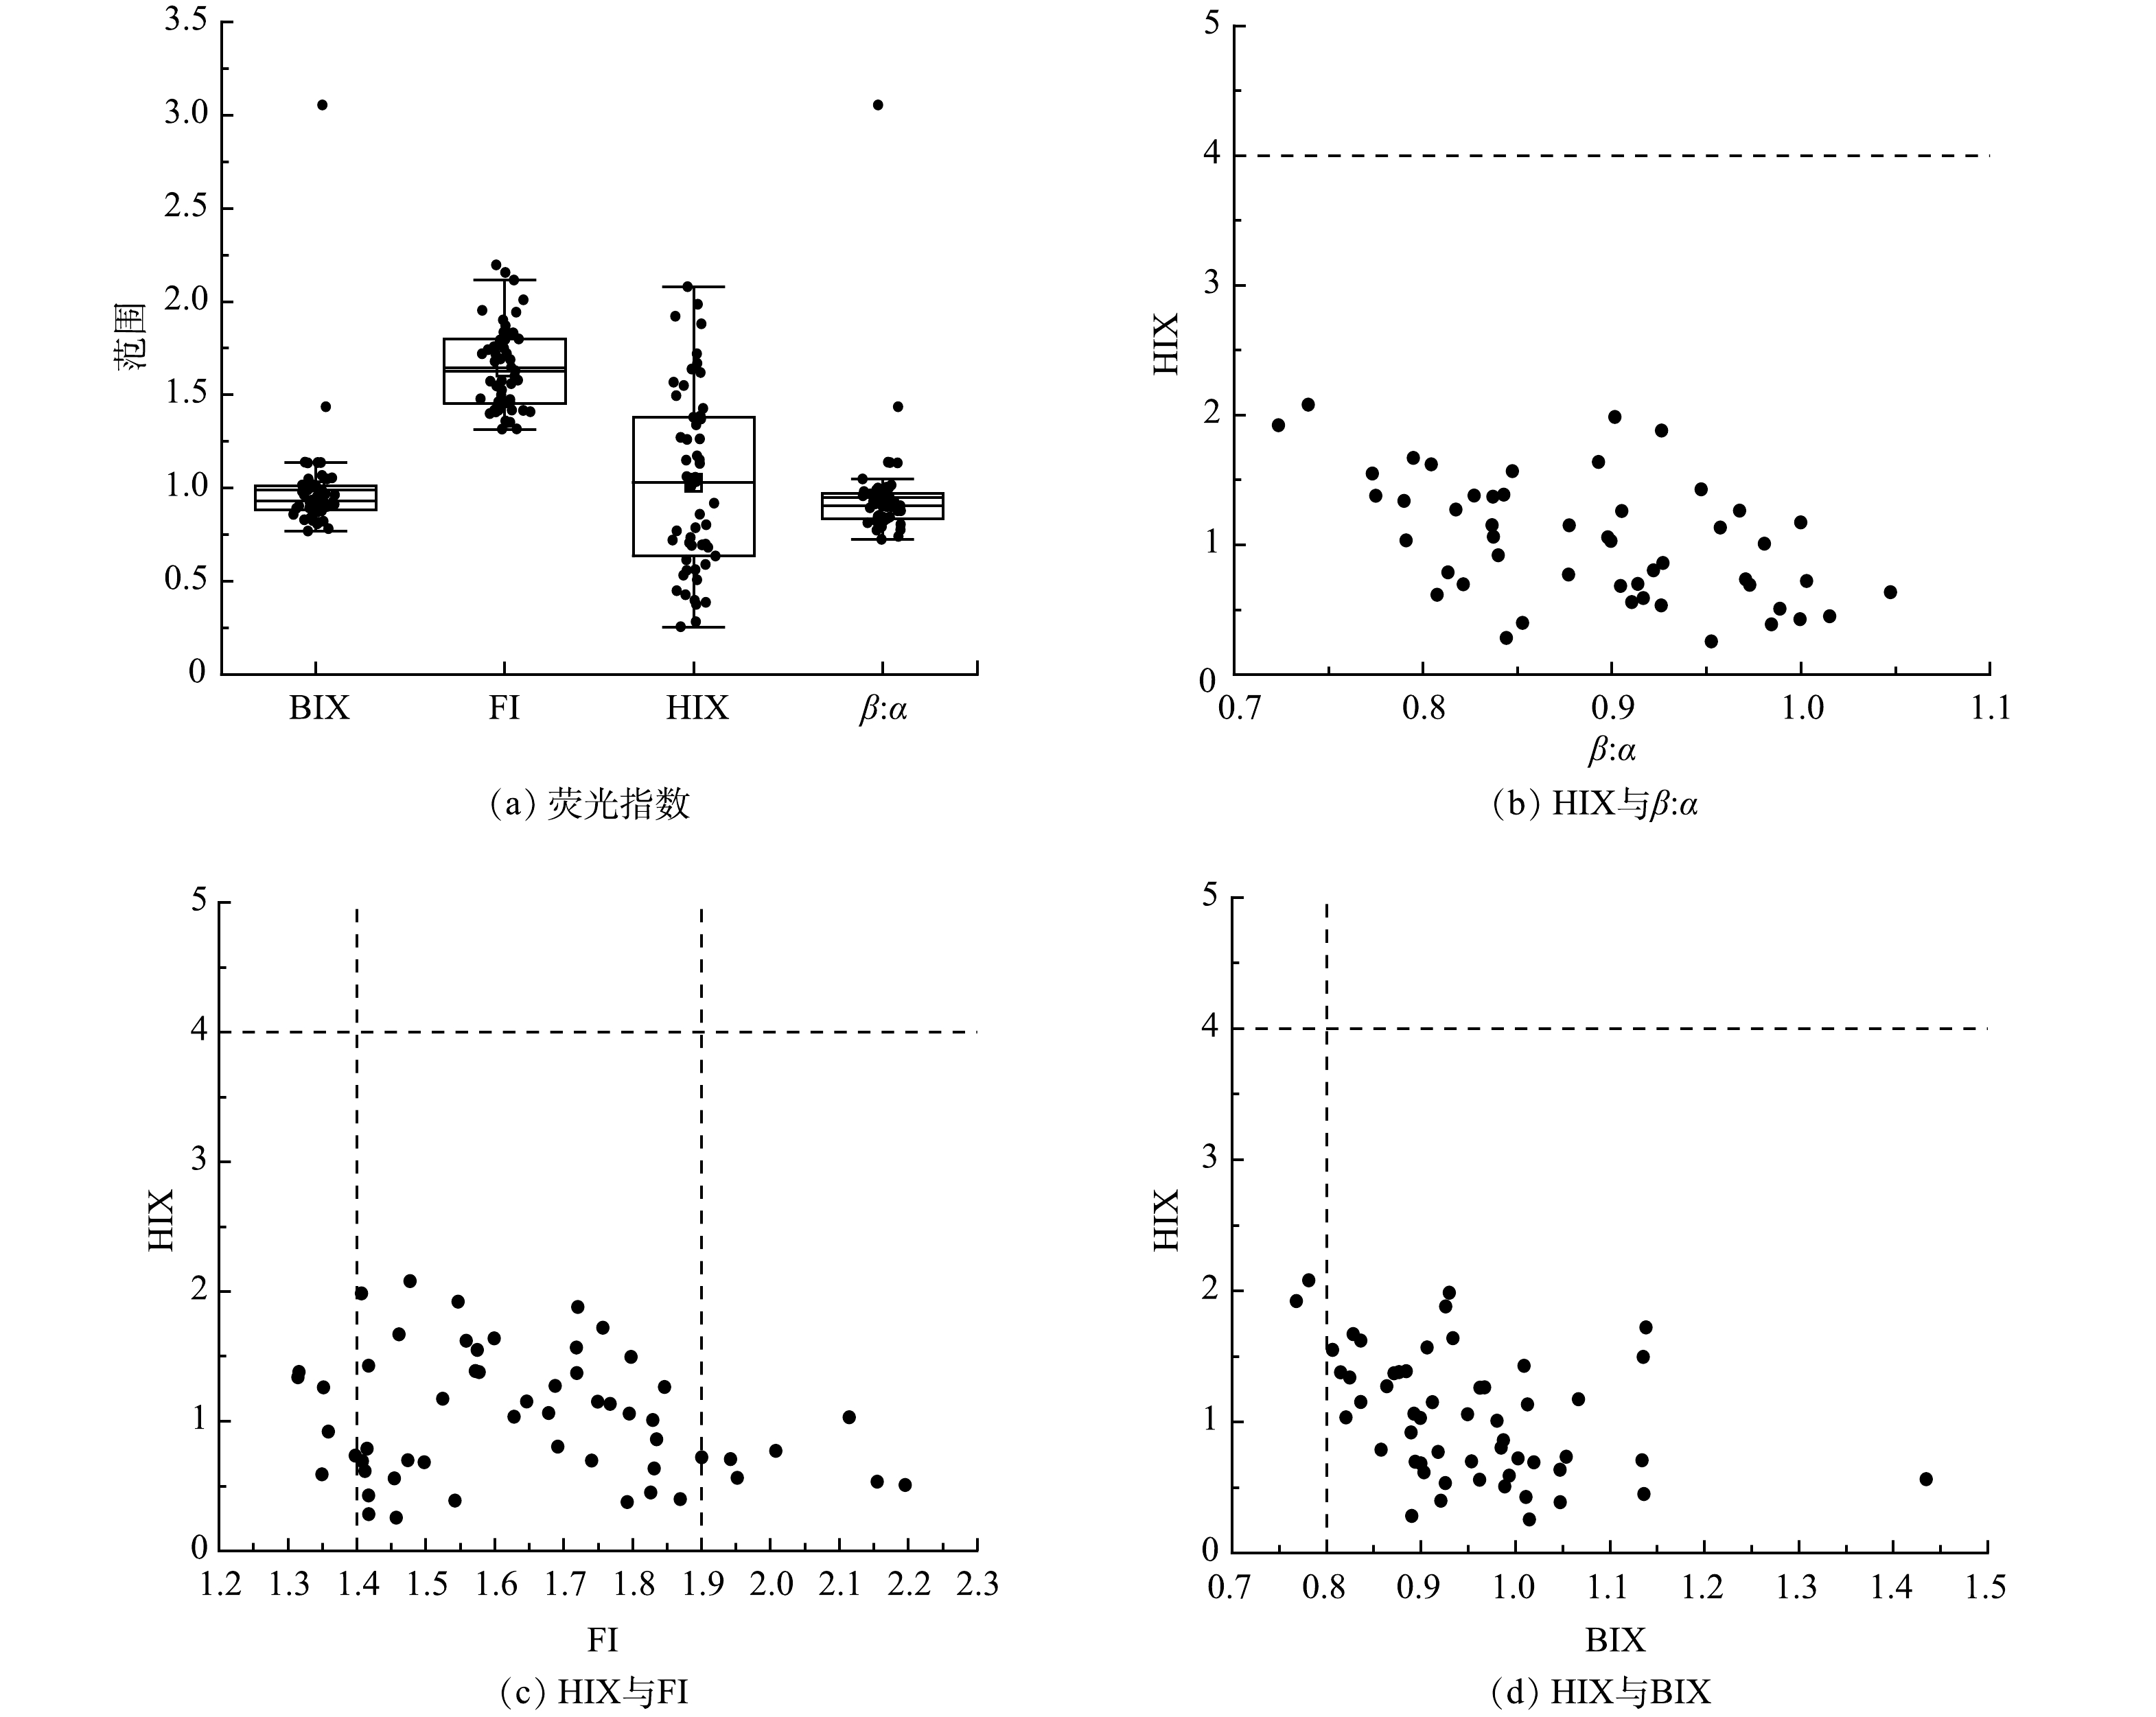
图 6 荧光特征参数
Figure 6. Fluorescence characteristics of water samples
Figure
6 ,Table
0 个