-
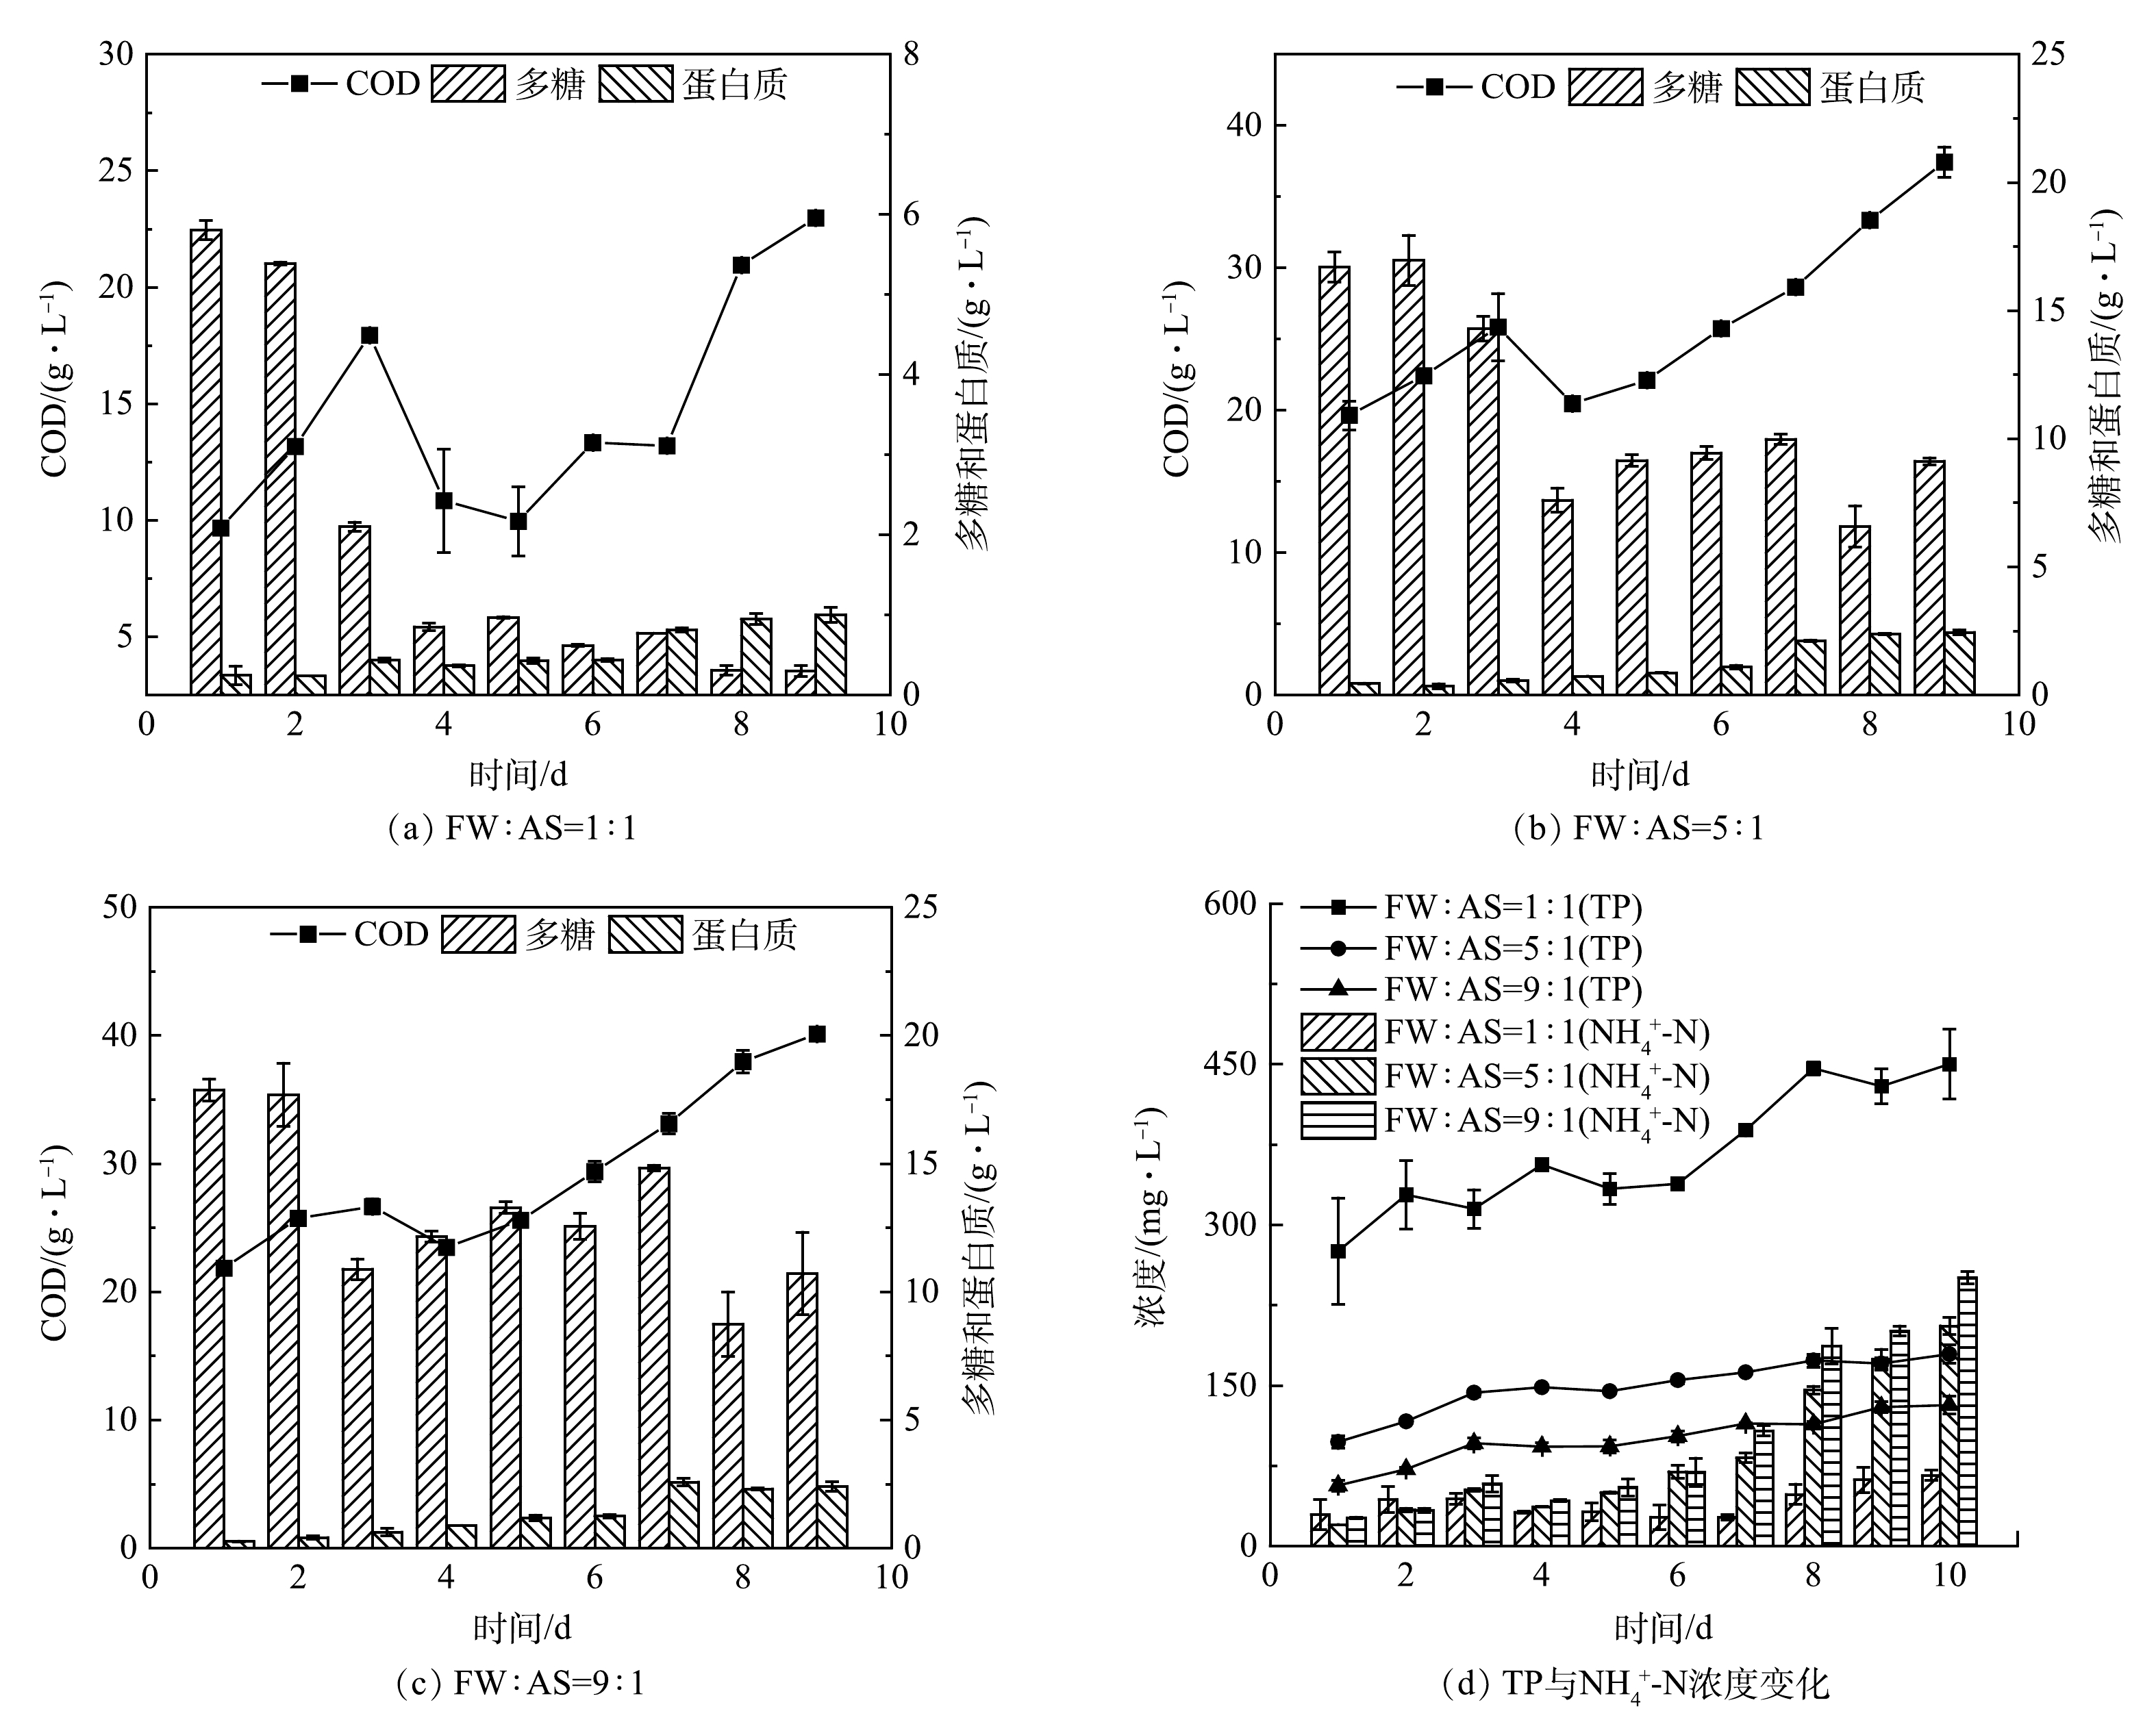
图 1 FWFL的COD、多糖、蛋白质、NH4+-N和TP随发酵时间的质量浓度变化
Figure 1. Changes in COD, the mass concentrations of polysaccharides, proteins, NH4+-N and TP of the food waste fermentation with the fermentation time
-
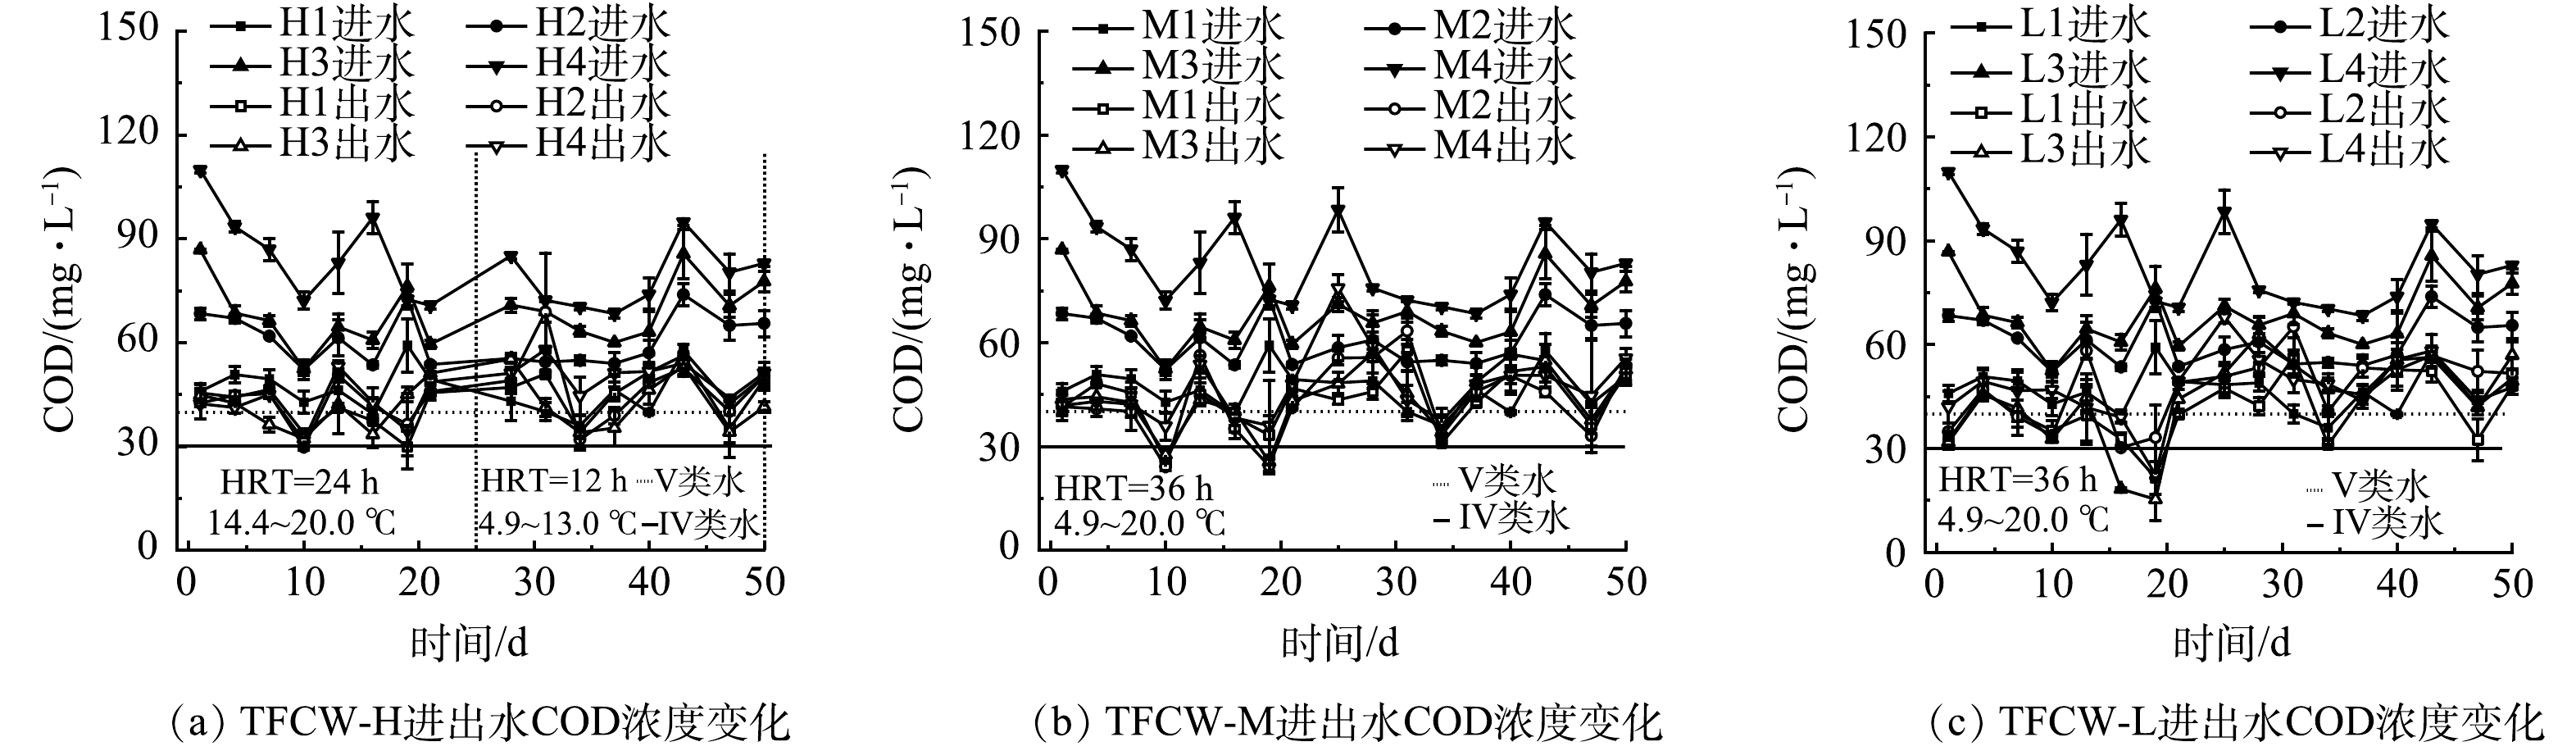
图 2 C/N和人工湿地高度对COD去除效果的影响
Figure 2. Effects of C/N ratio and constructed wetland height on COD removal
-
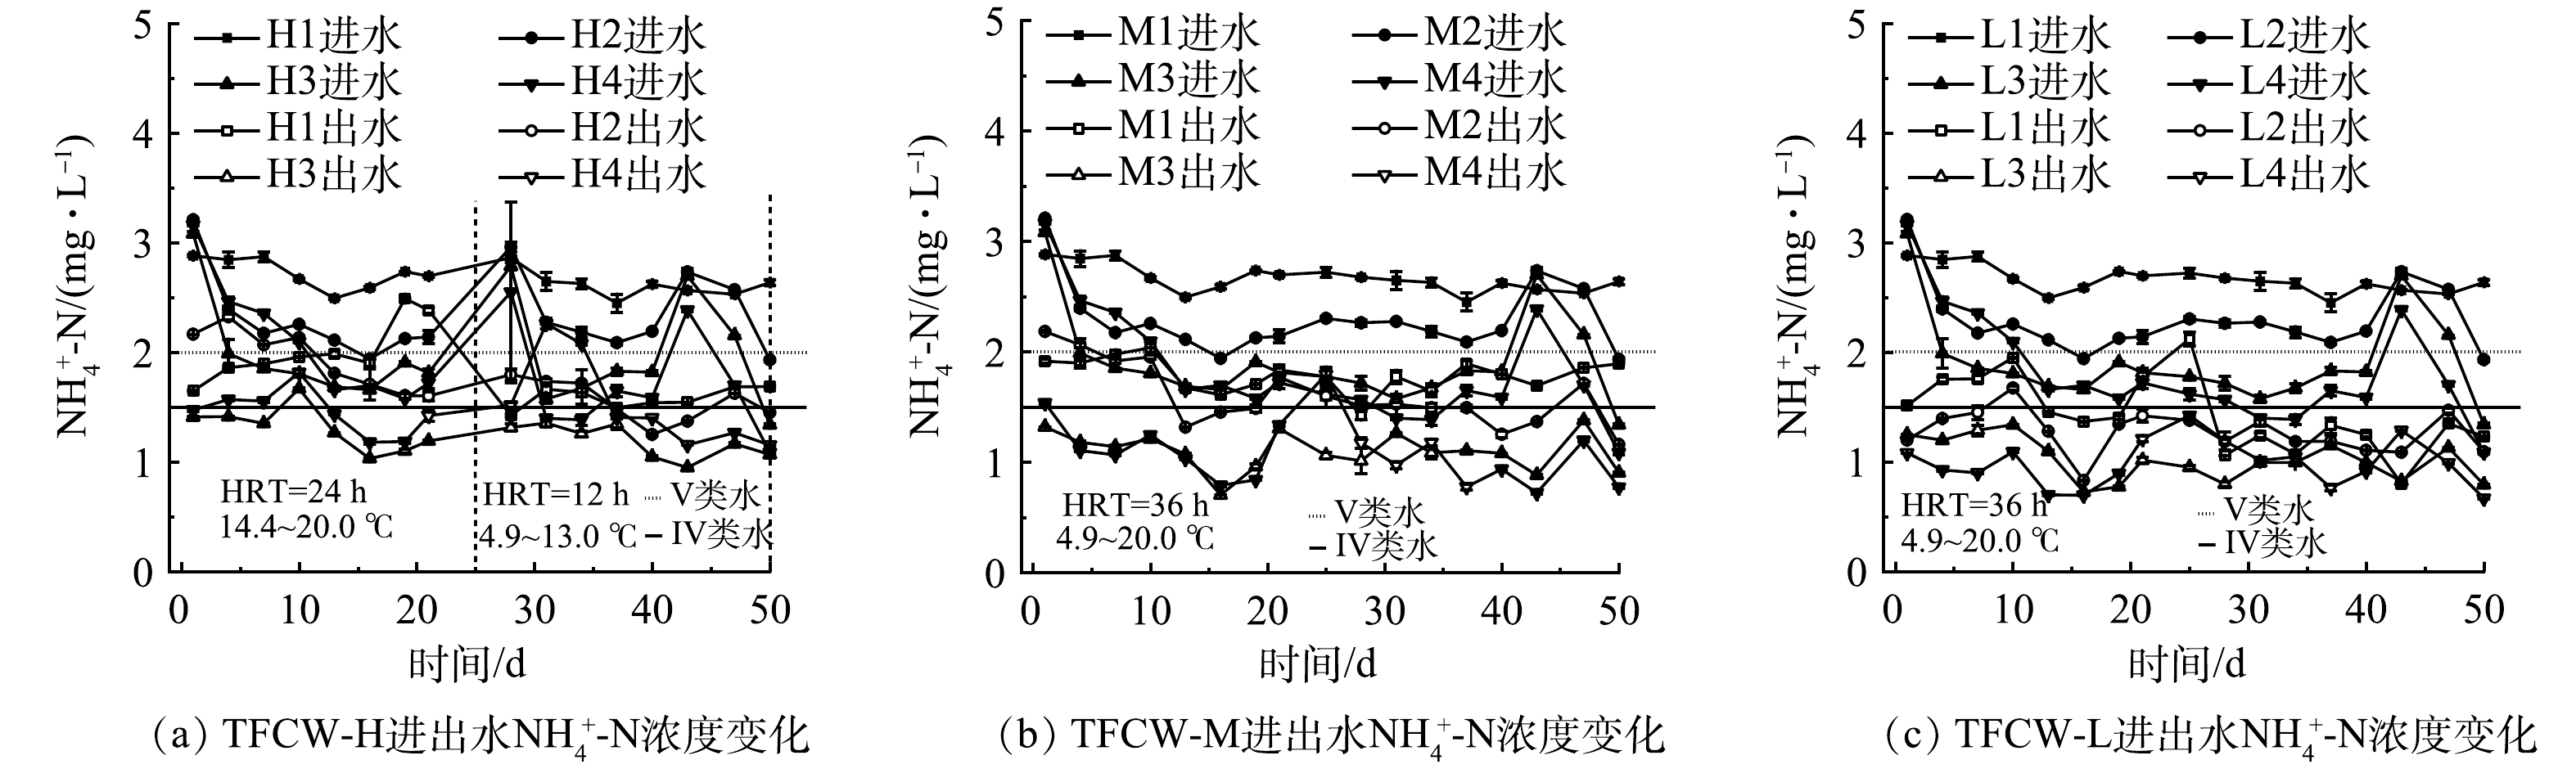
图 3 C/N和人工湿地高度对NH4+-N去除效果的影响
Figure 3. Effects of C/N ratio and constructed wetland height on NH4+-N removal
-
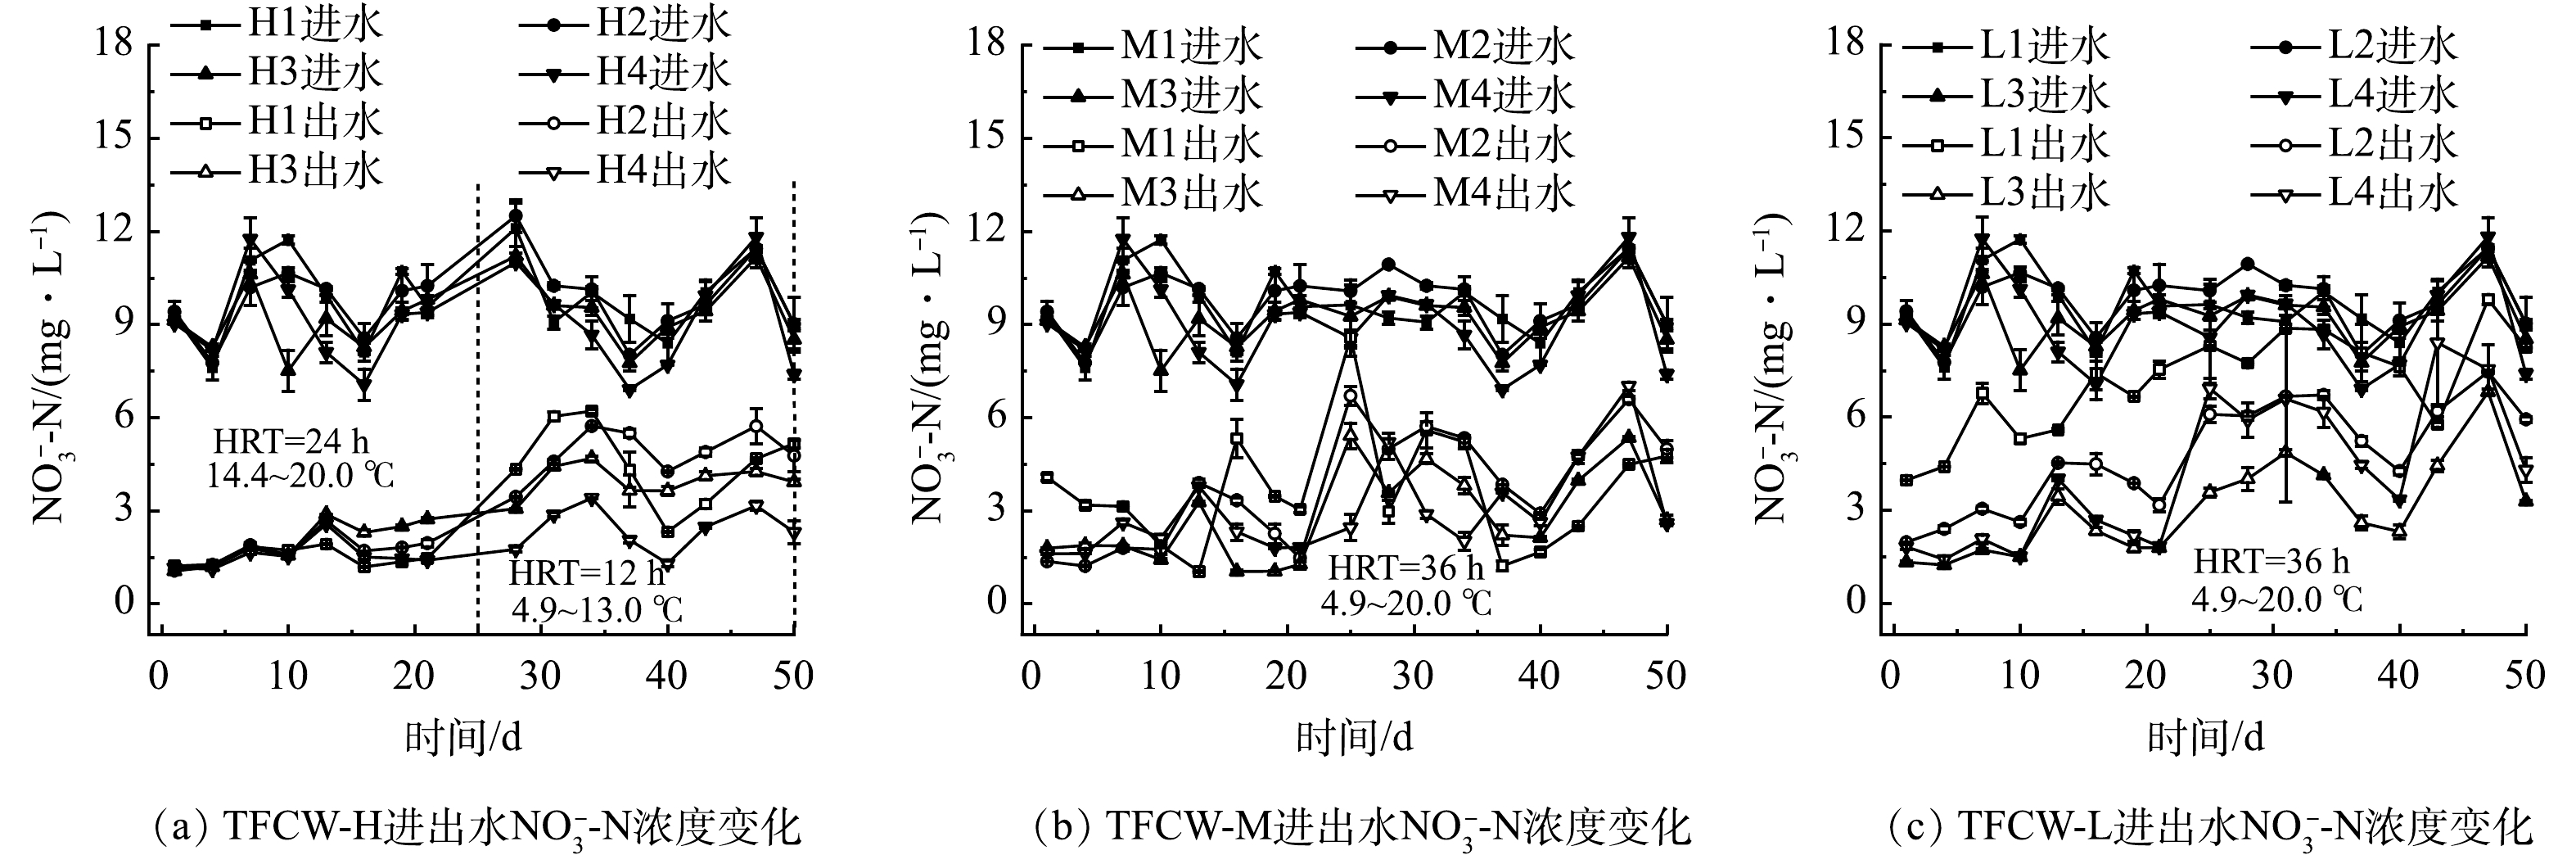
图 4 C/N和人工湿地高度对NO3−-N去除效果的影响
Figure 4. Effects of C/N ratio and constructed wetland height on NO3−-N removal
-
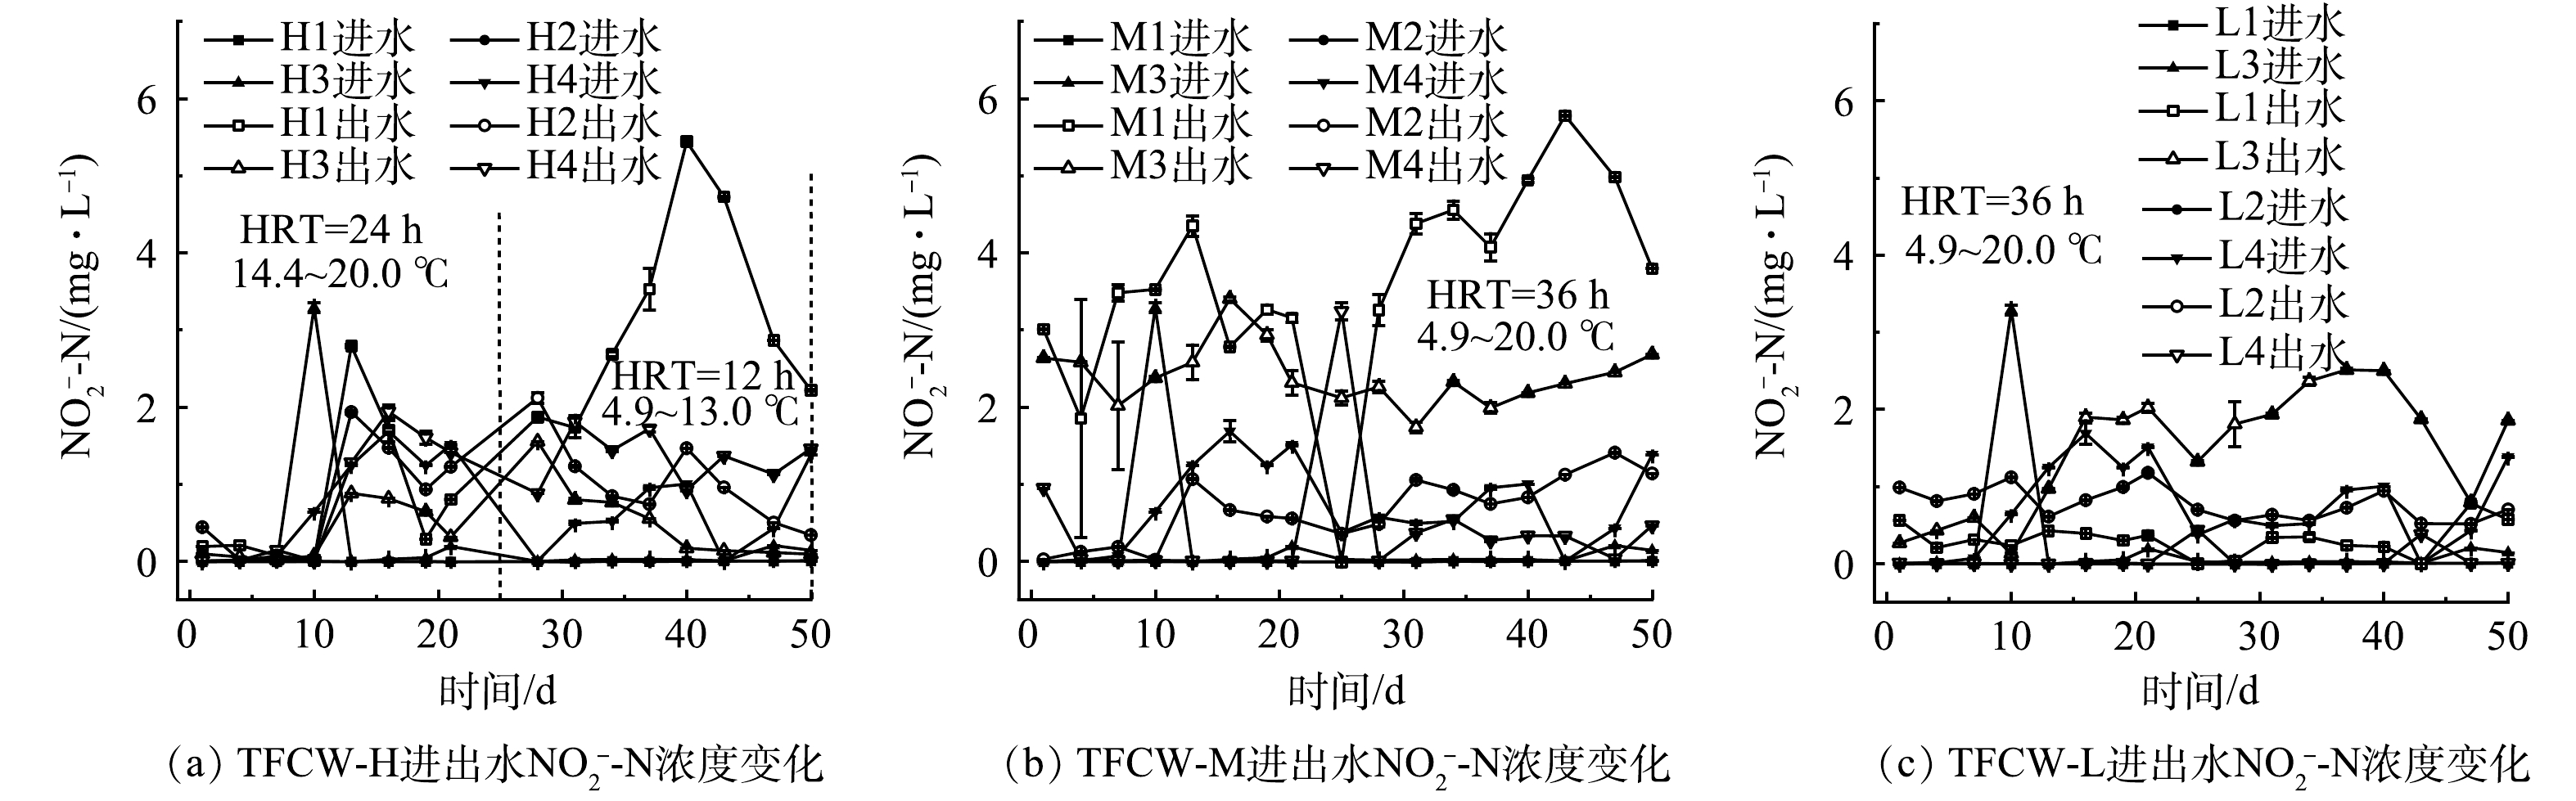
图 5 C/N和人工湿地高度对NO2−-N去除效果的影响
Figure 5. Effects of C/N ratio and constructed wetland height on NO2−-N removal
-
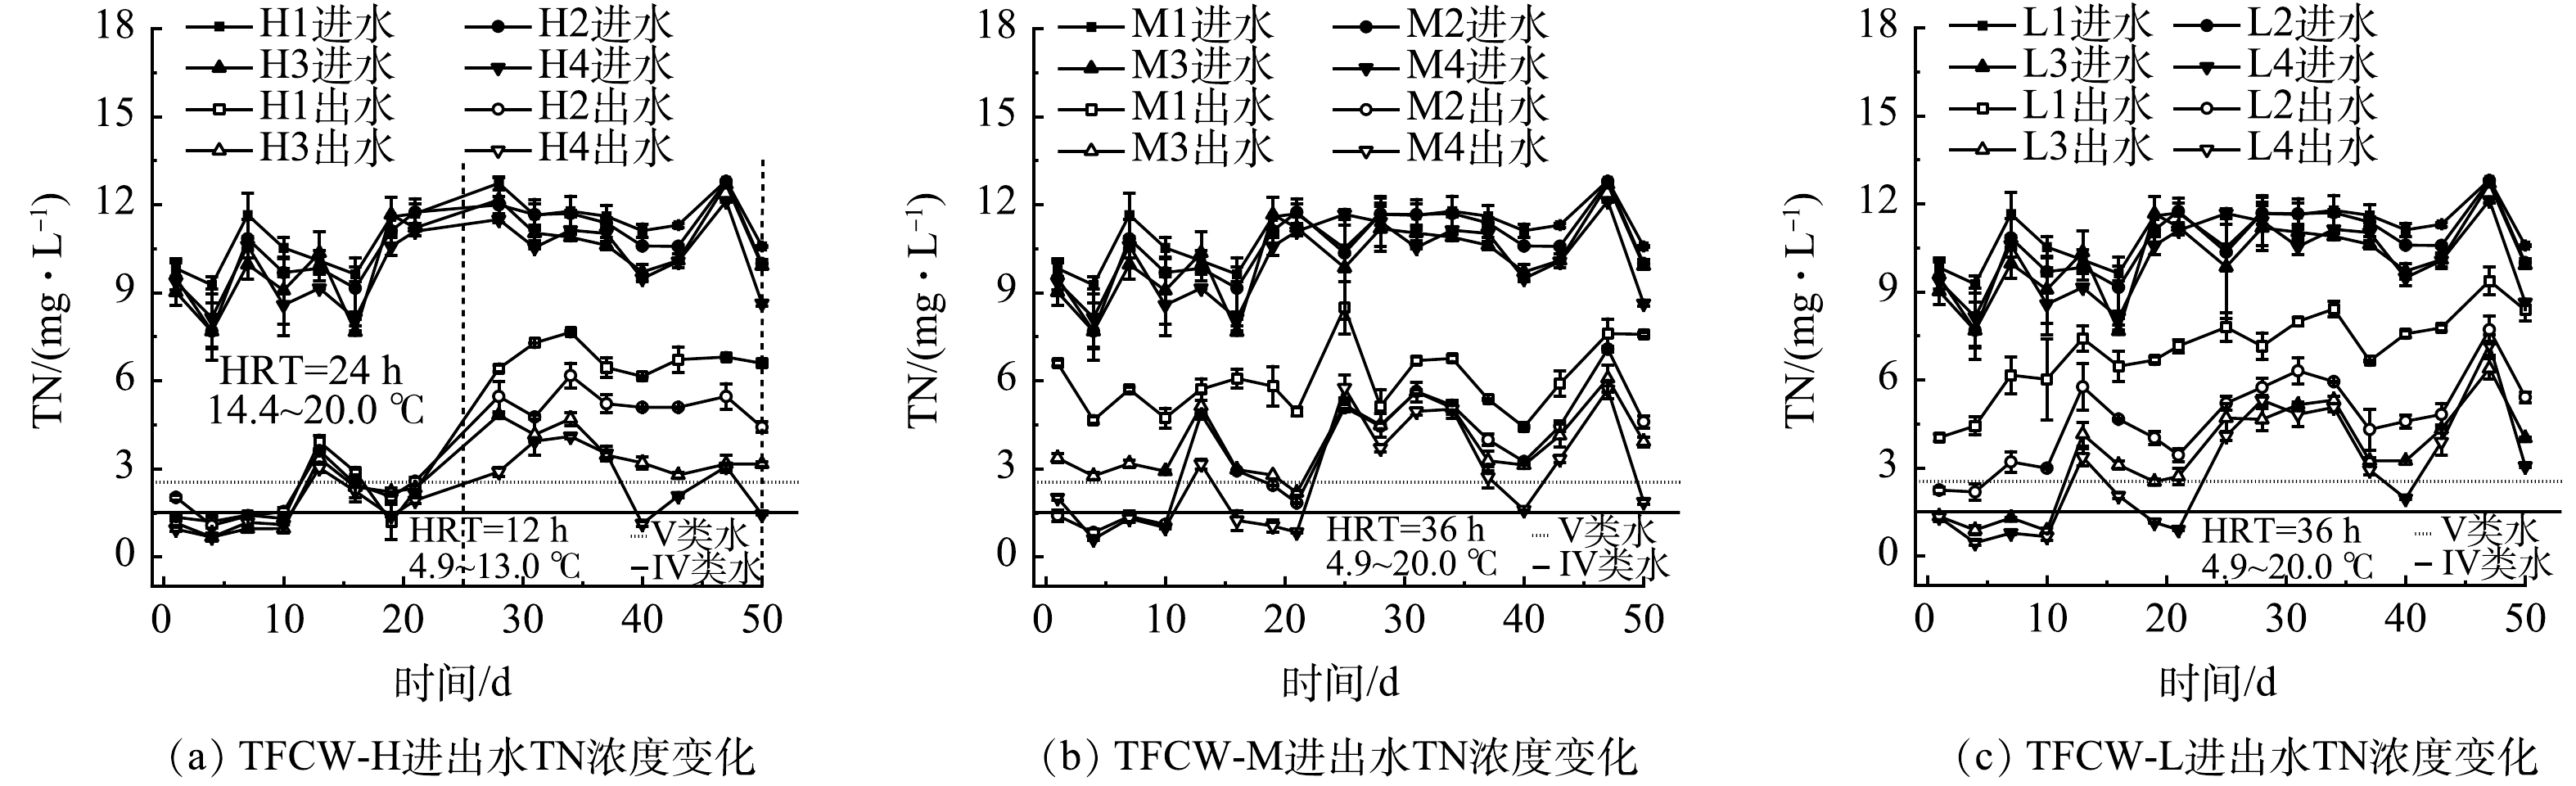
图 6 C/N和人工湿地高度对TN去除效果的影响
Figure 6. Effects of C/N ratio and constructed wetland height on TN removal
-
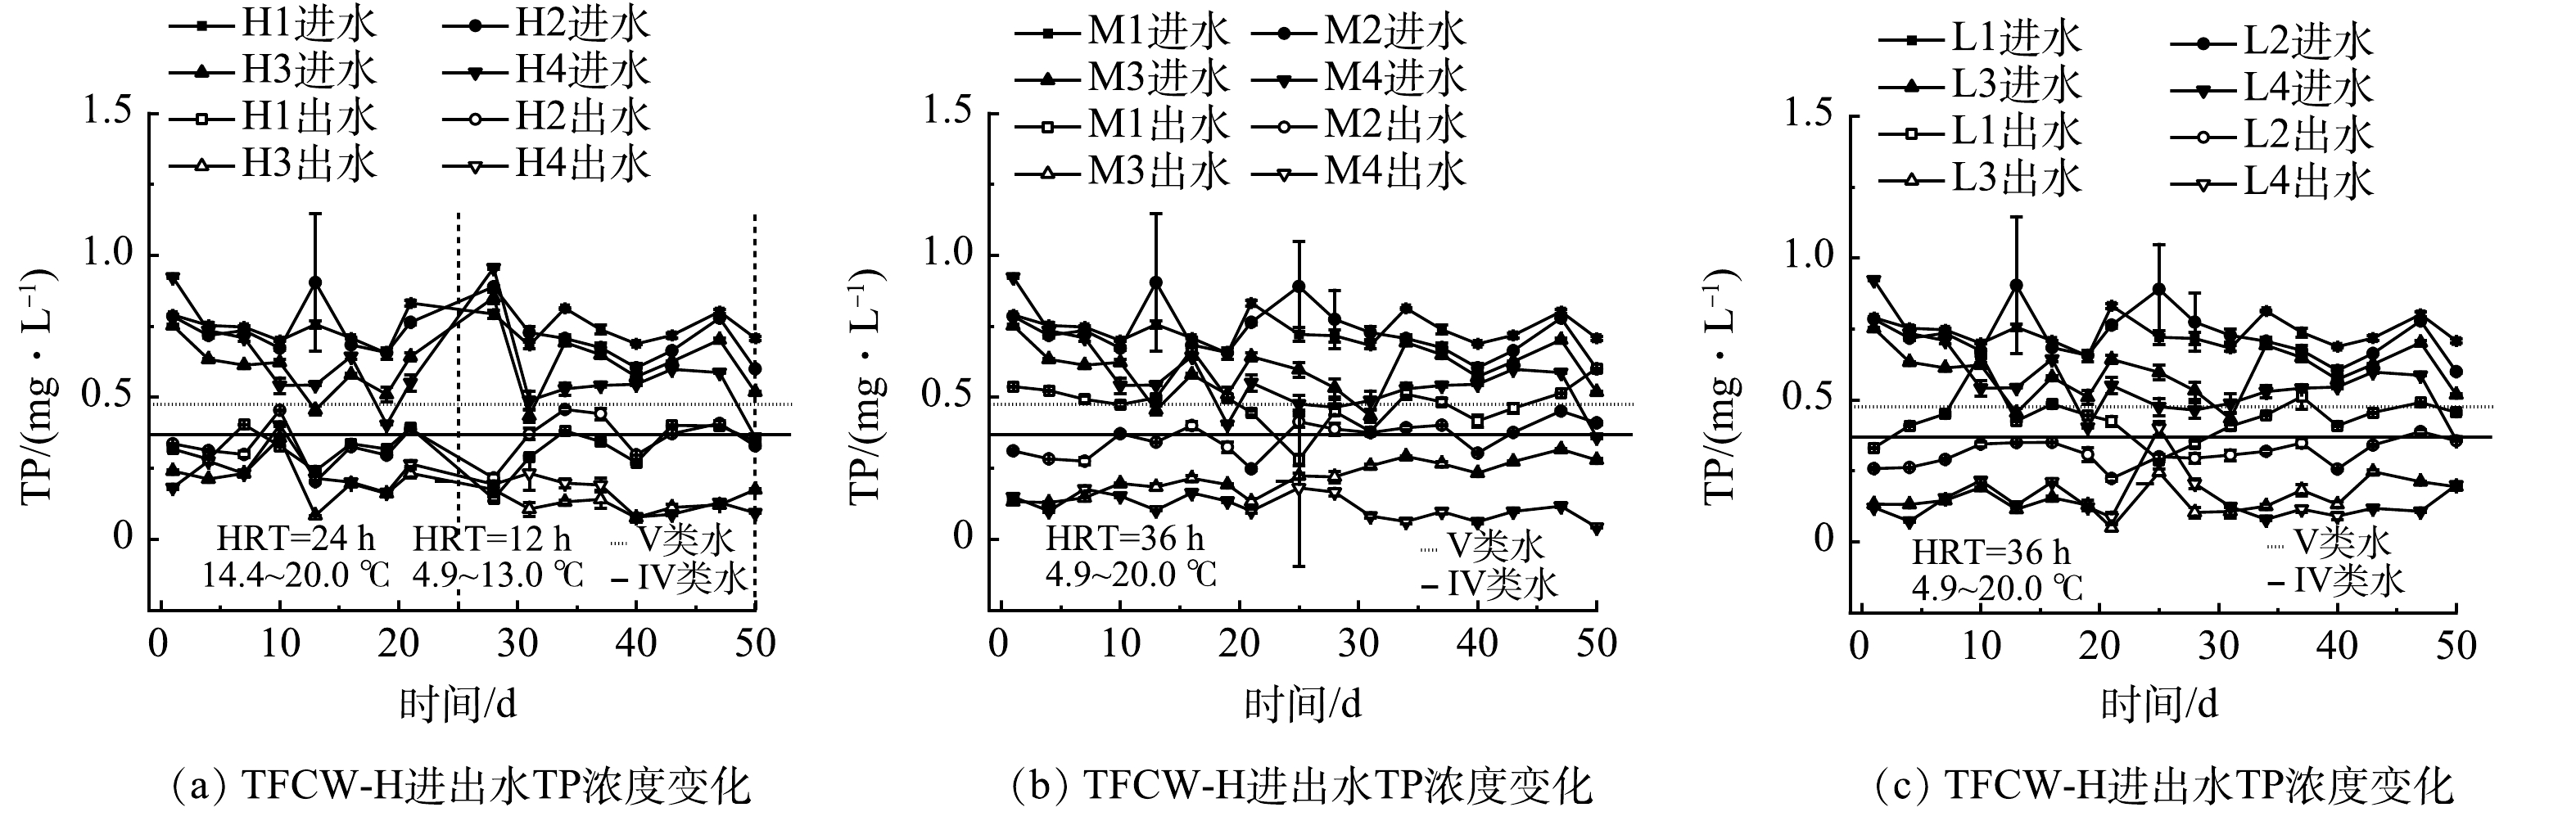
图 7 C/N和人工湿地高度对TP去除效果的影响
Figure 7. Effects of C/N ratio and constructed wetland height on TP removal
-
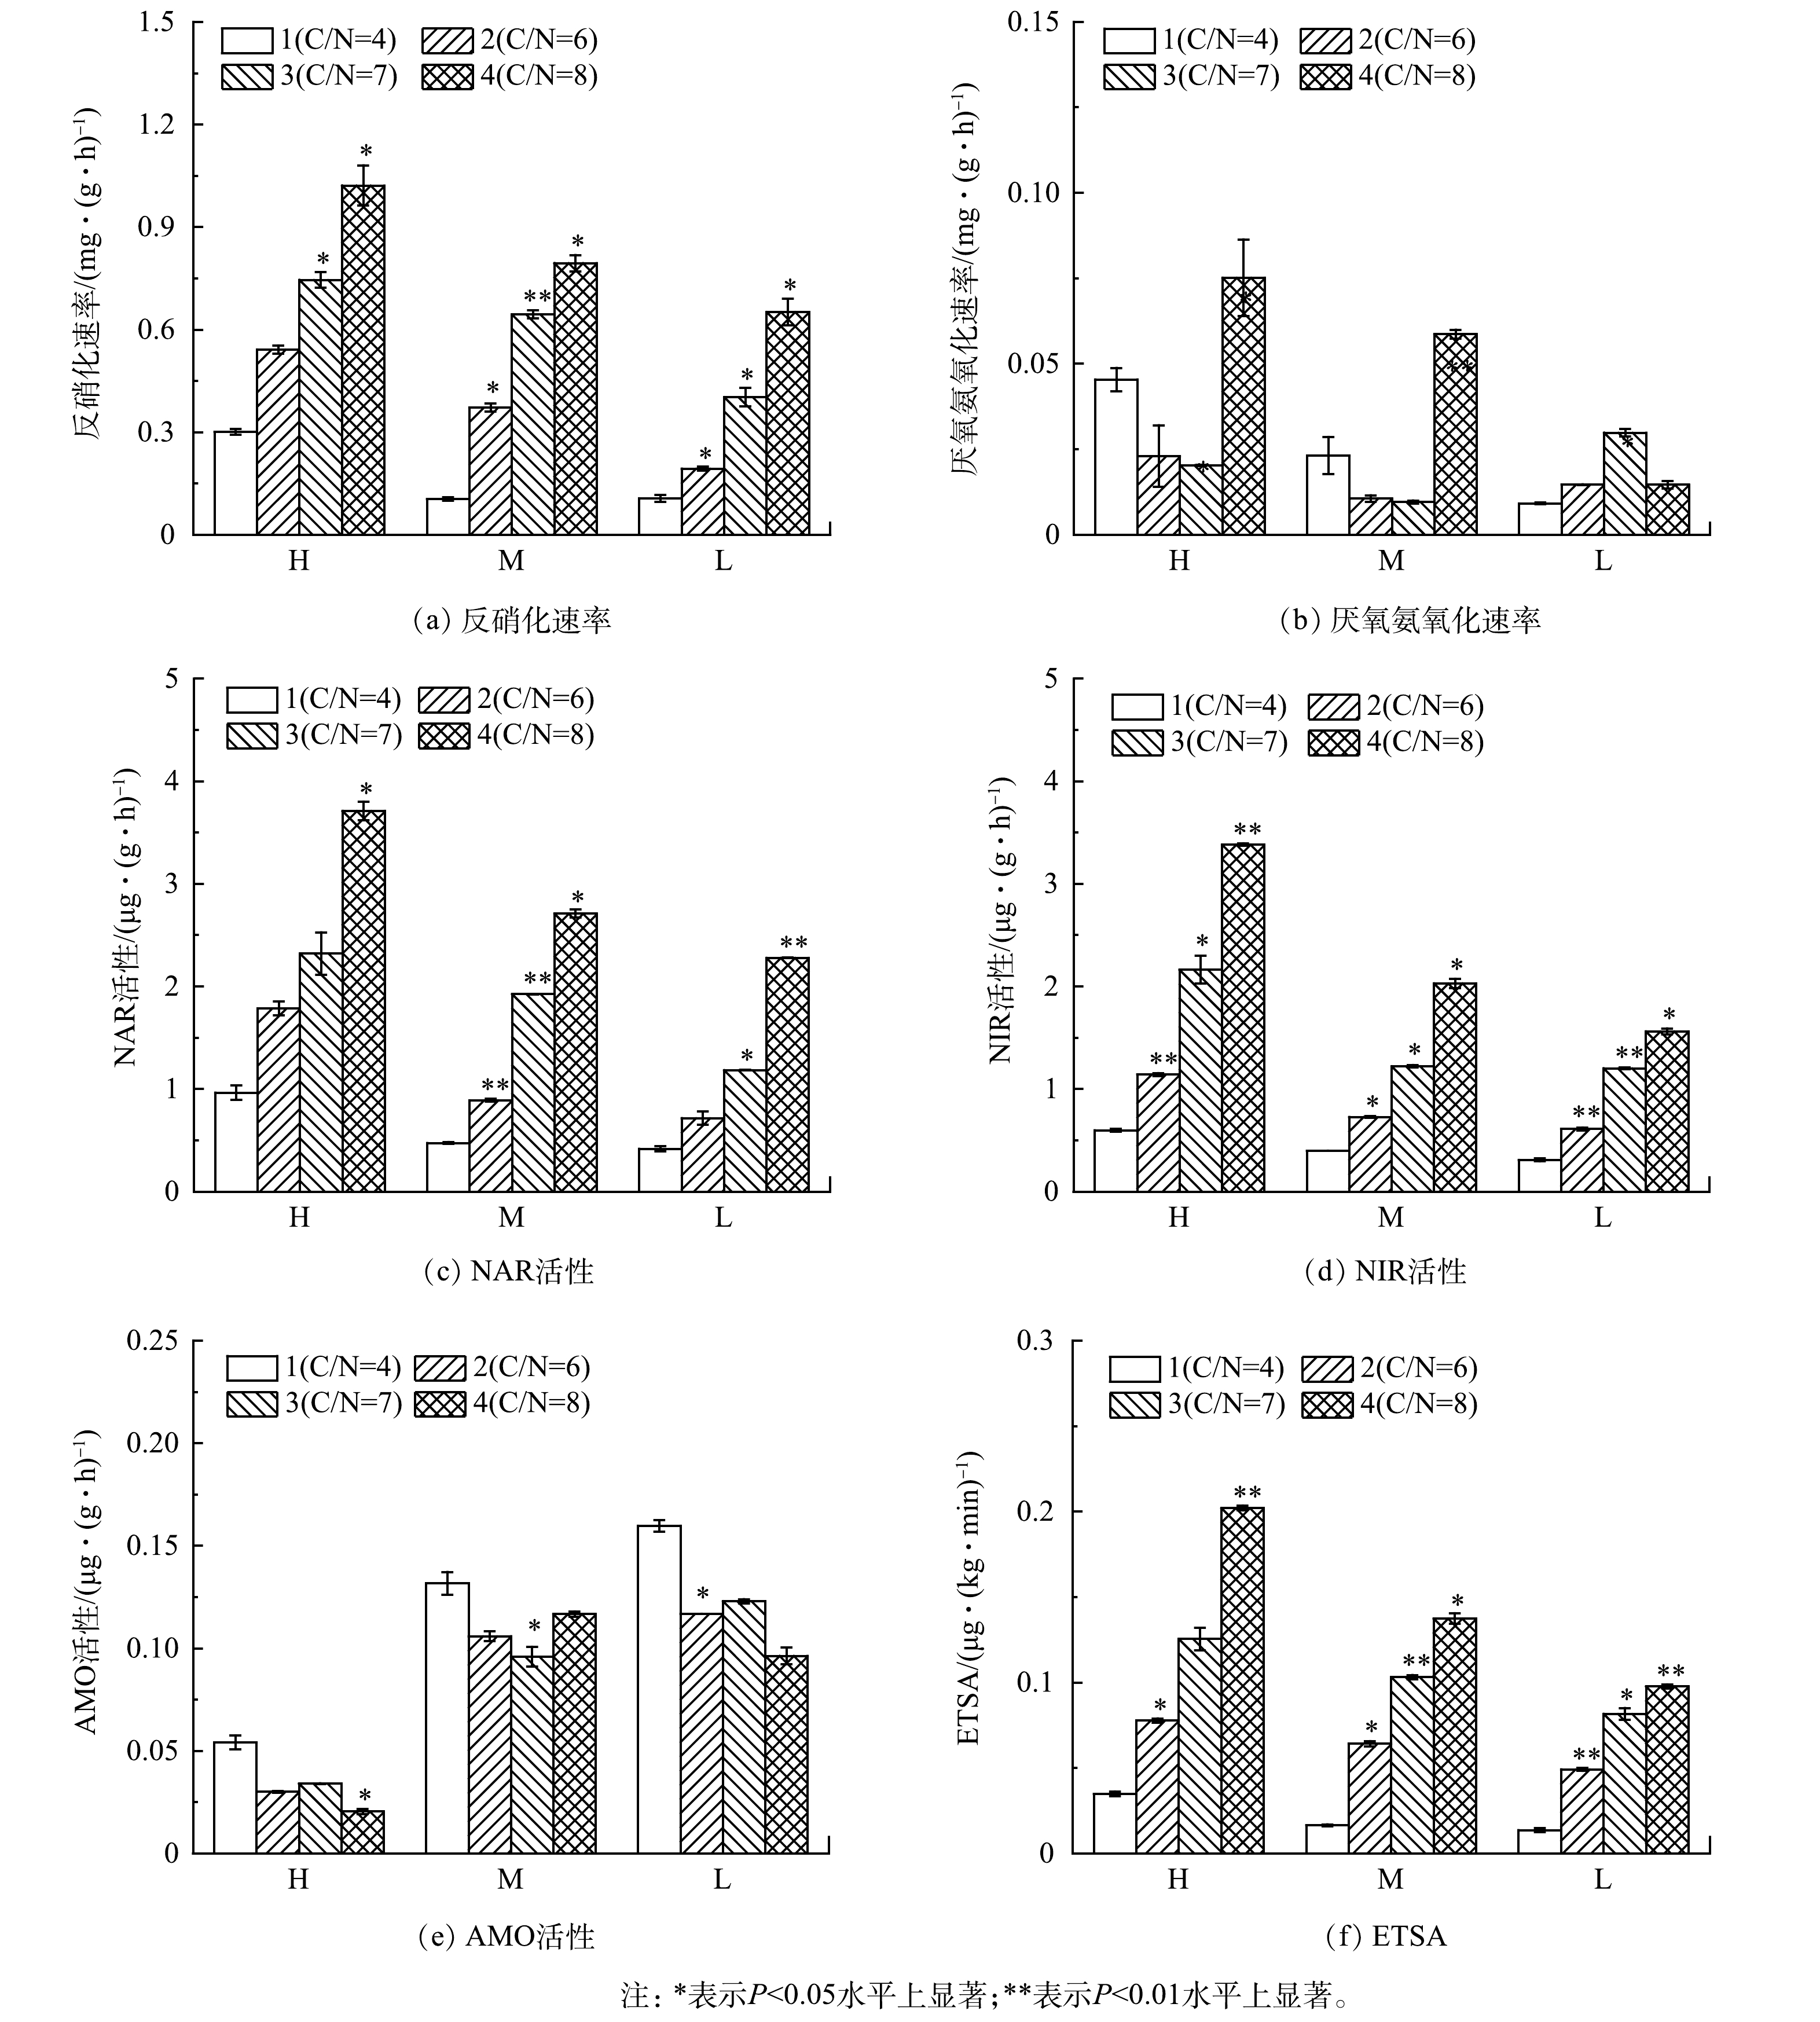
图 8 人工湿地填料生物膜的反硝化速率、厌氧氨氧化速率、NAR活性、NIR活性、AMO活性与ETSA
Figure 8. Denitrification rate, ANAMMOX rate, NAR, NIR and AMO activity, ETSA of medium biofilm in constructed wetlands
-
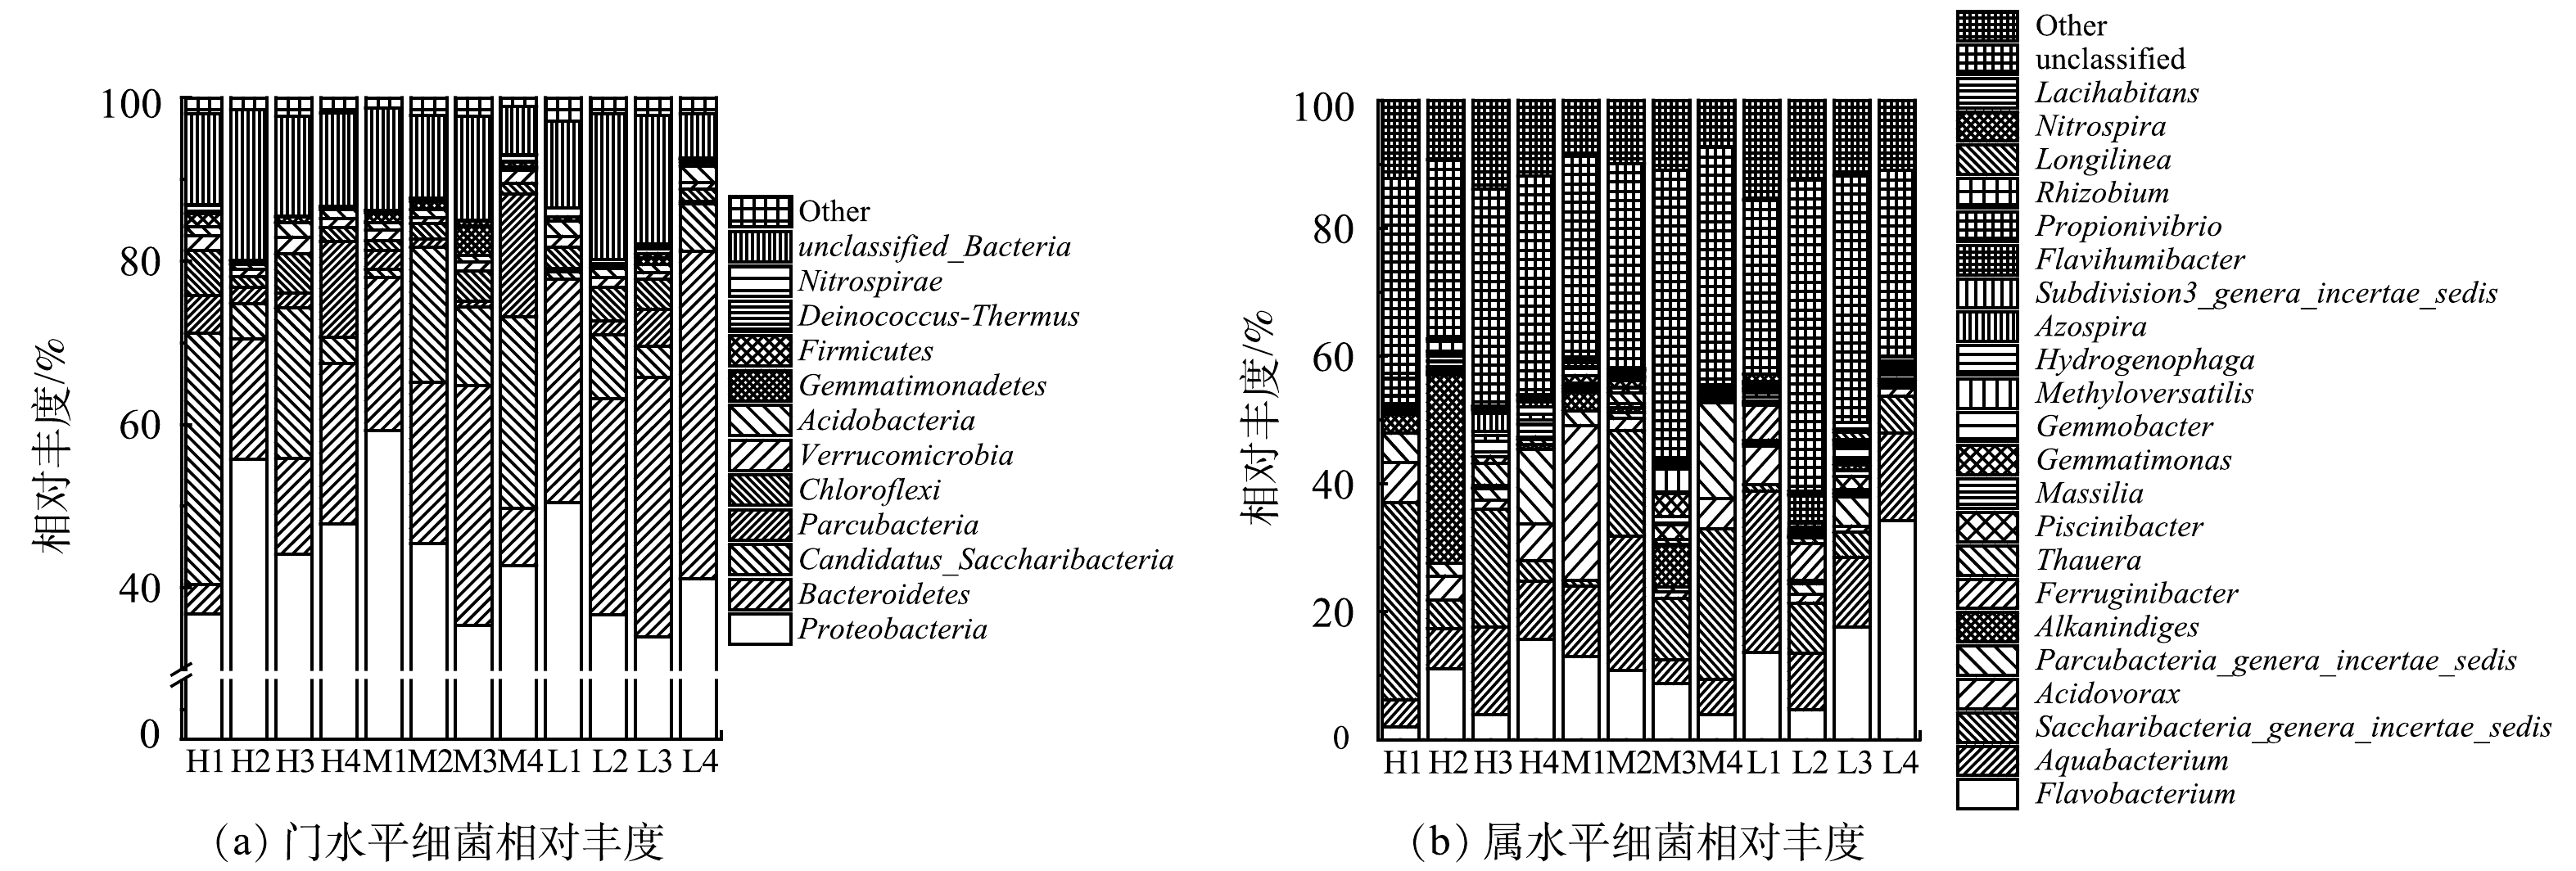
图 9 不同C/N人工湿地生物膜门水平和属水平细菌的相对丰度
Figure 9. Relative abundance of bacteria at the phylum and genus level in constructed wetlands with different C/N
-
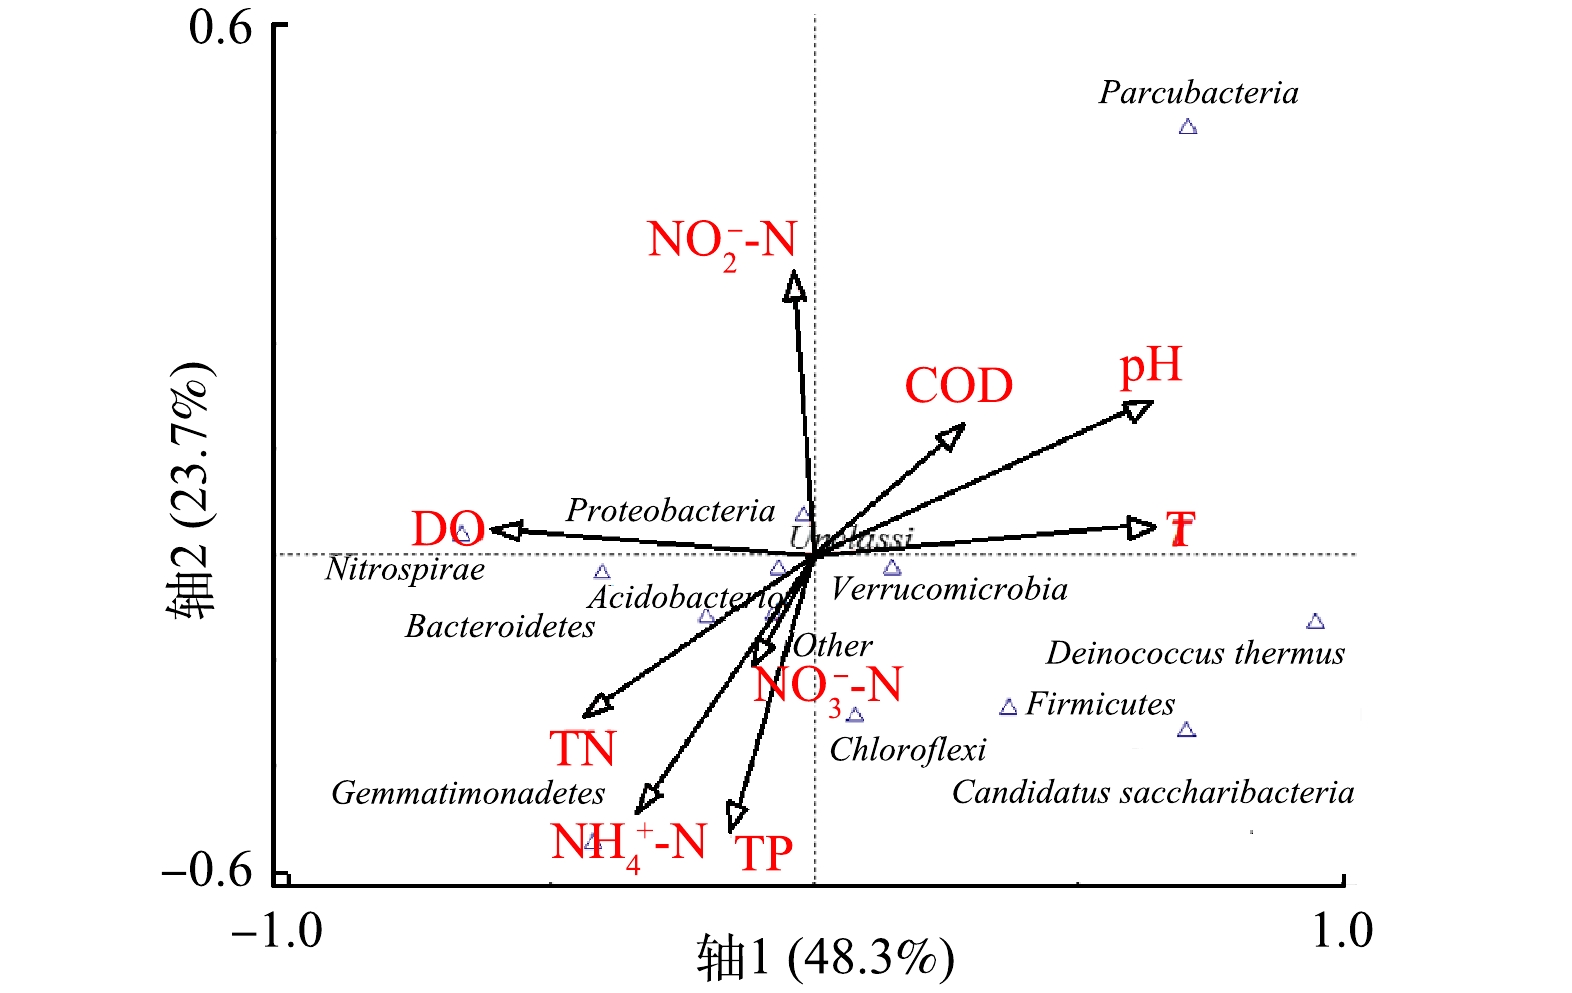
图 10 环境因子与人工湿地菌群在门水平层面的典型对应分析排序
Figure 10. CCA sequencing of environmental factors and constructed wetlands bacteria at the phylum level
Figure
10 ,Table
2 个