-
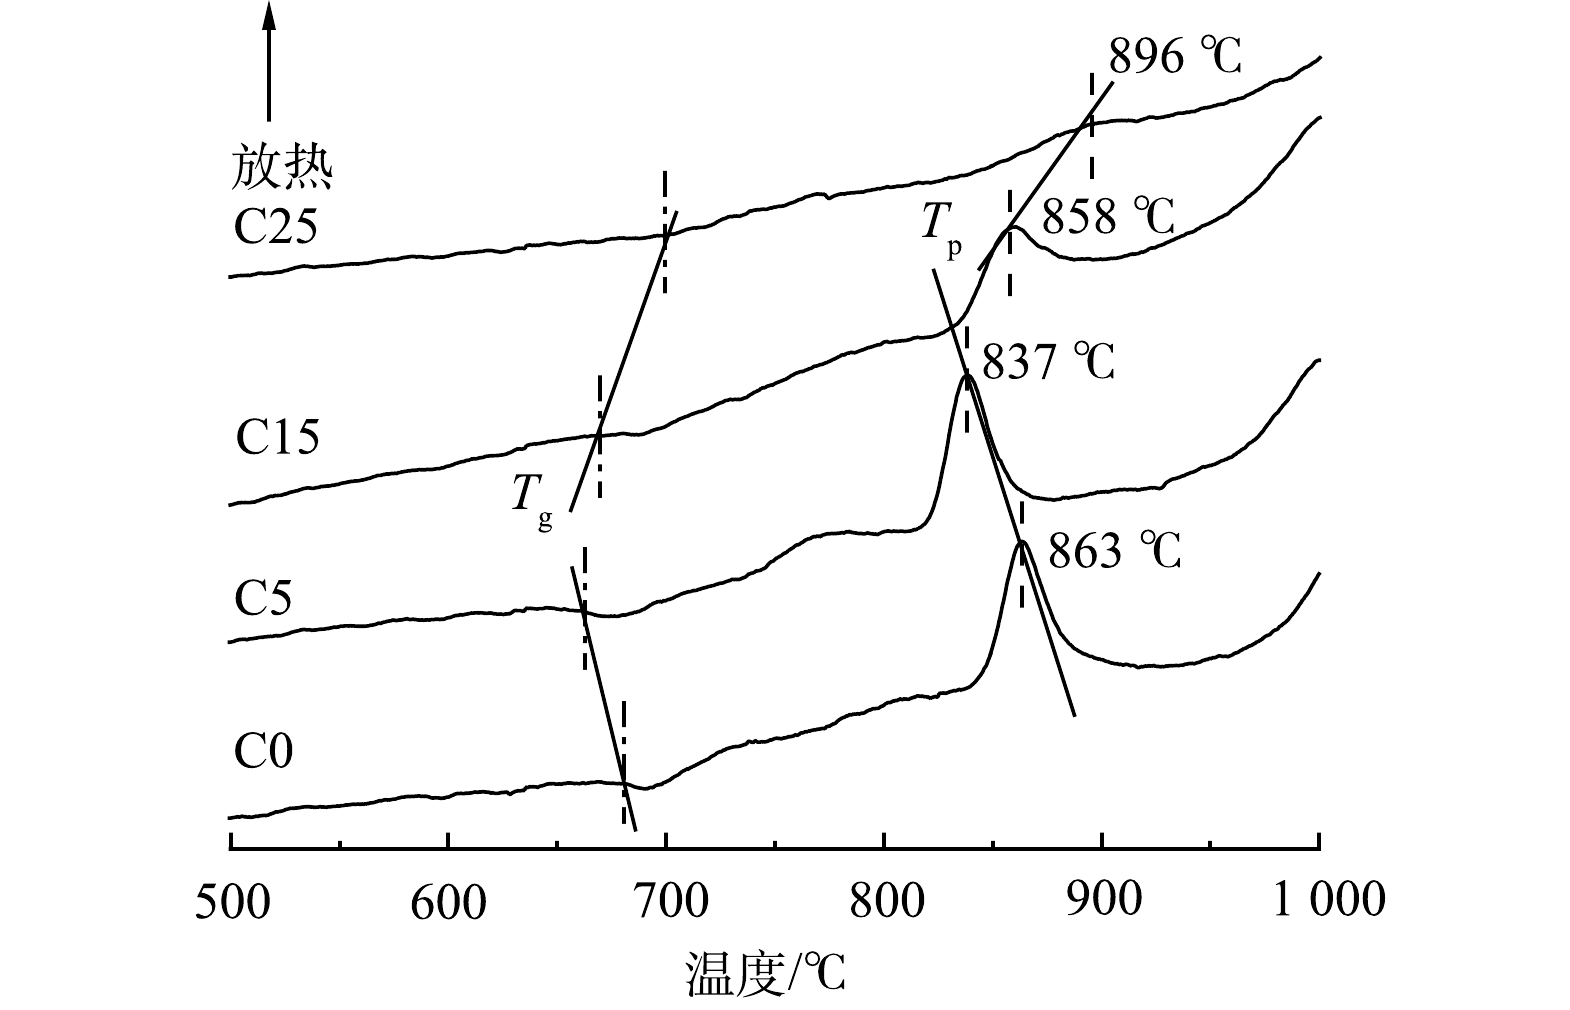
图 1 微晶玻璃的DSC曲线图
Figure 1. DSC curve of glass ceramics
-
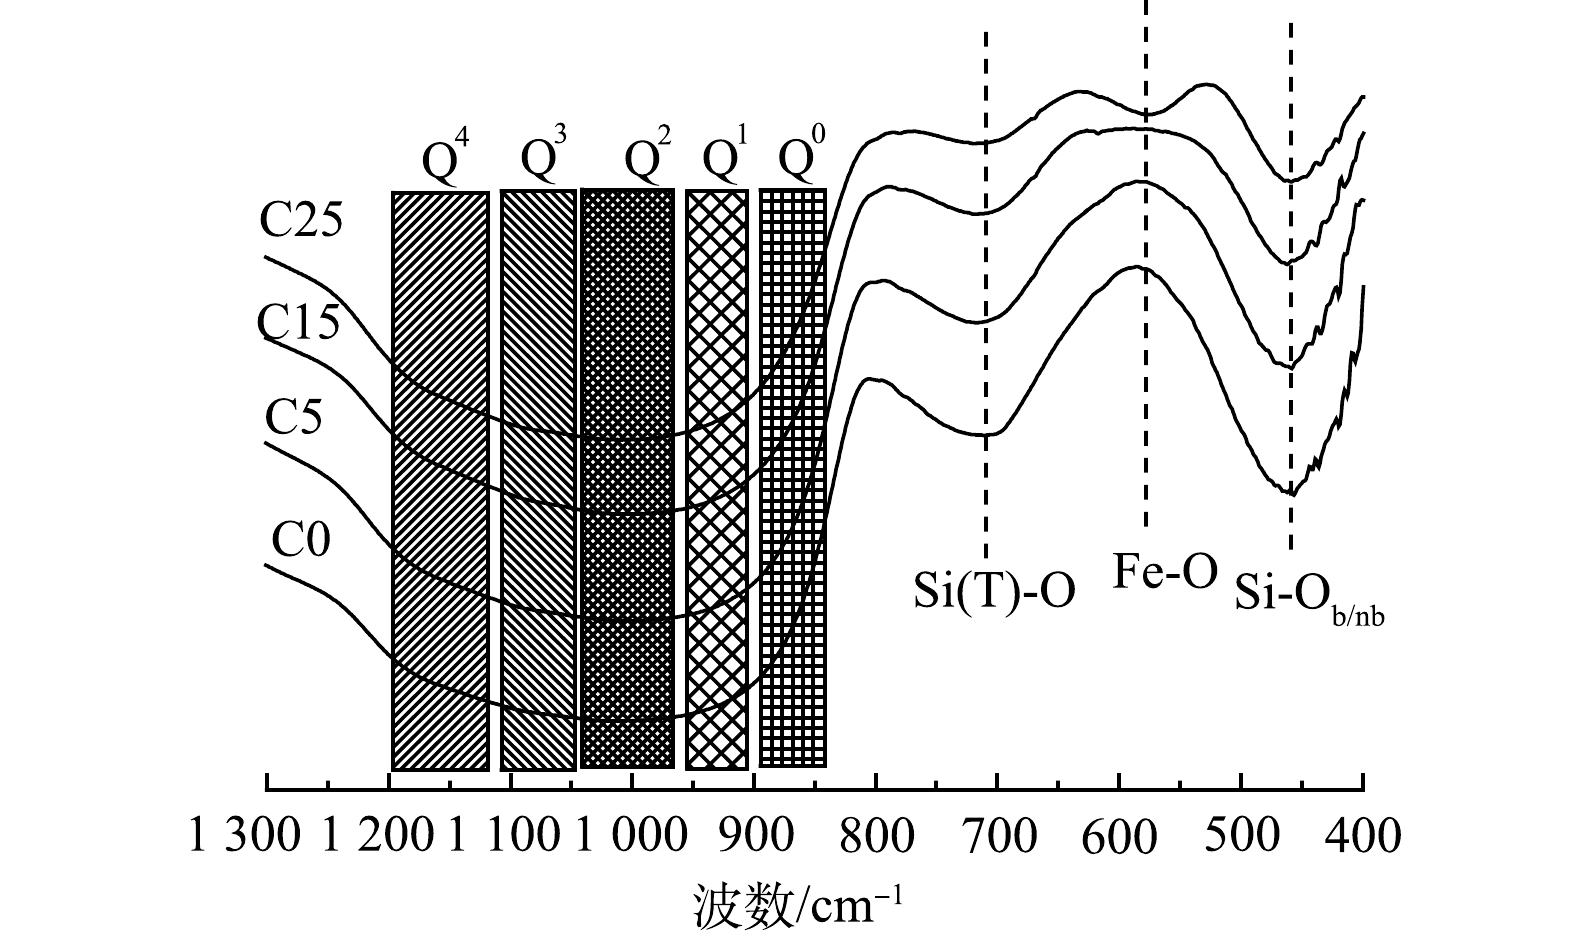
图 2 退火玻璃红外光谱图
Figure 2. Infrared spectra of annealed glass
-
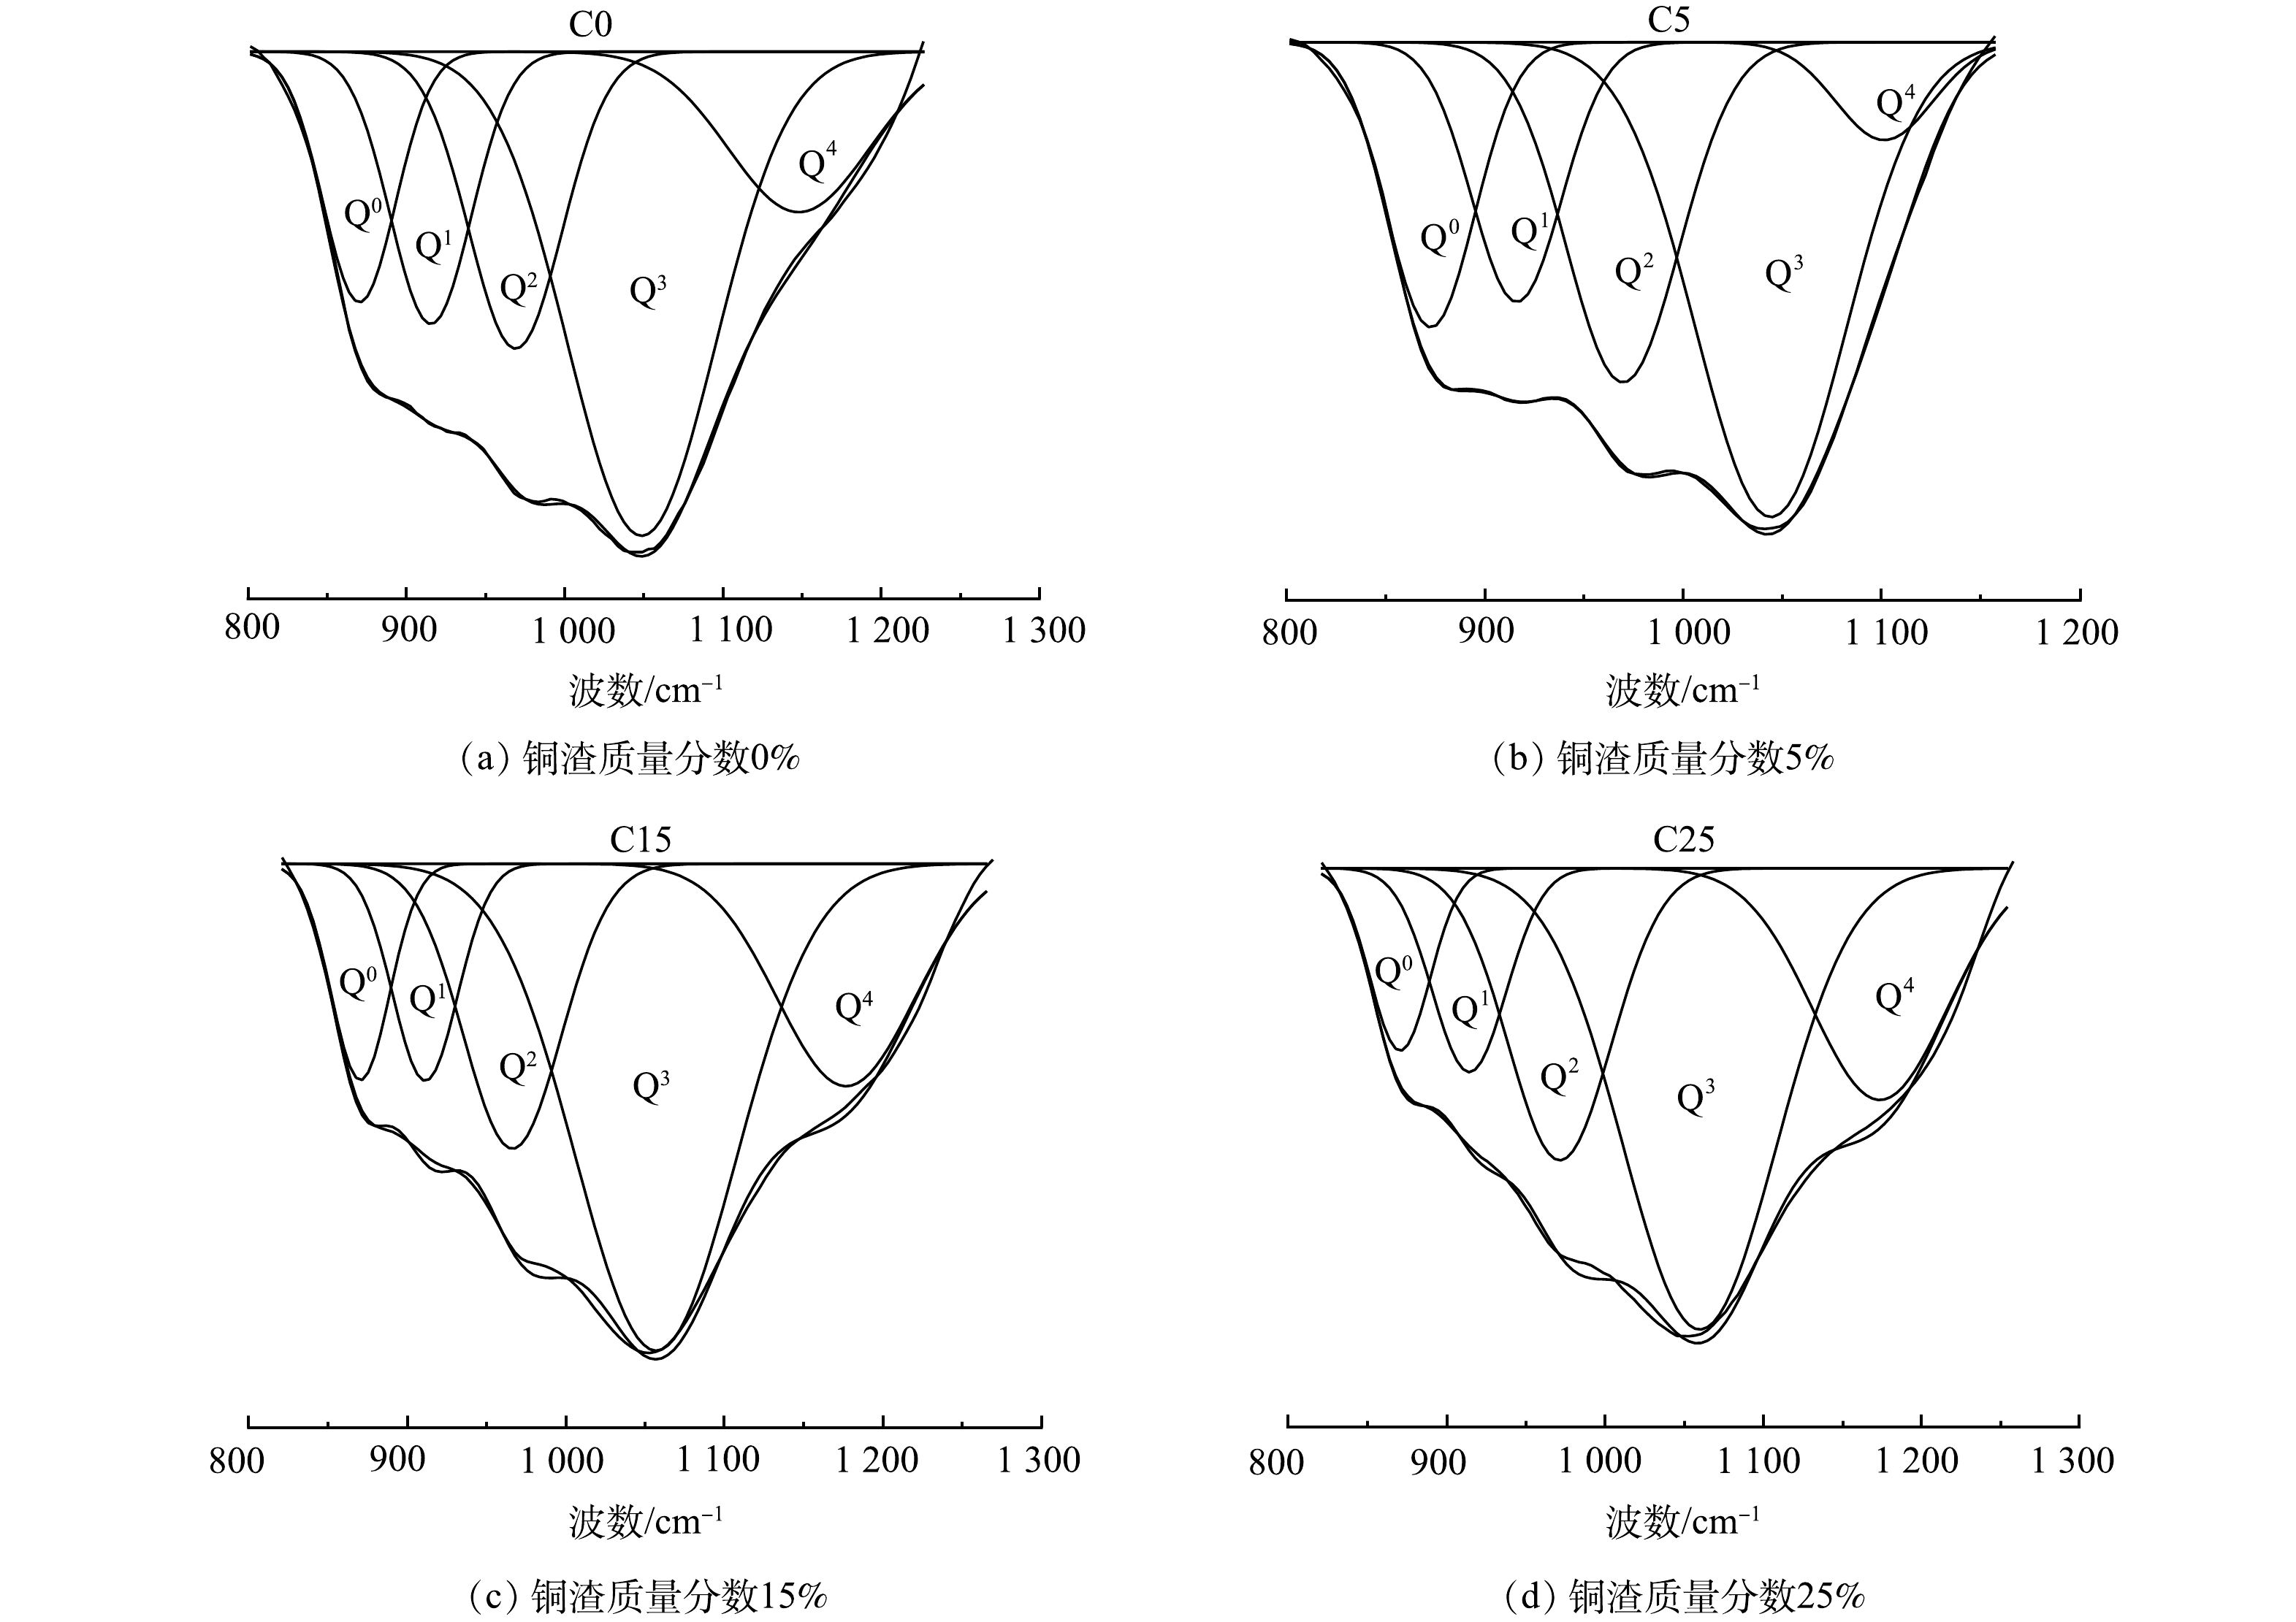
图 3 Qn结构单元的去卷积结果图
Figure 3. Deconvolution diagram of Qn structural units
-
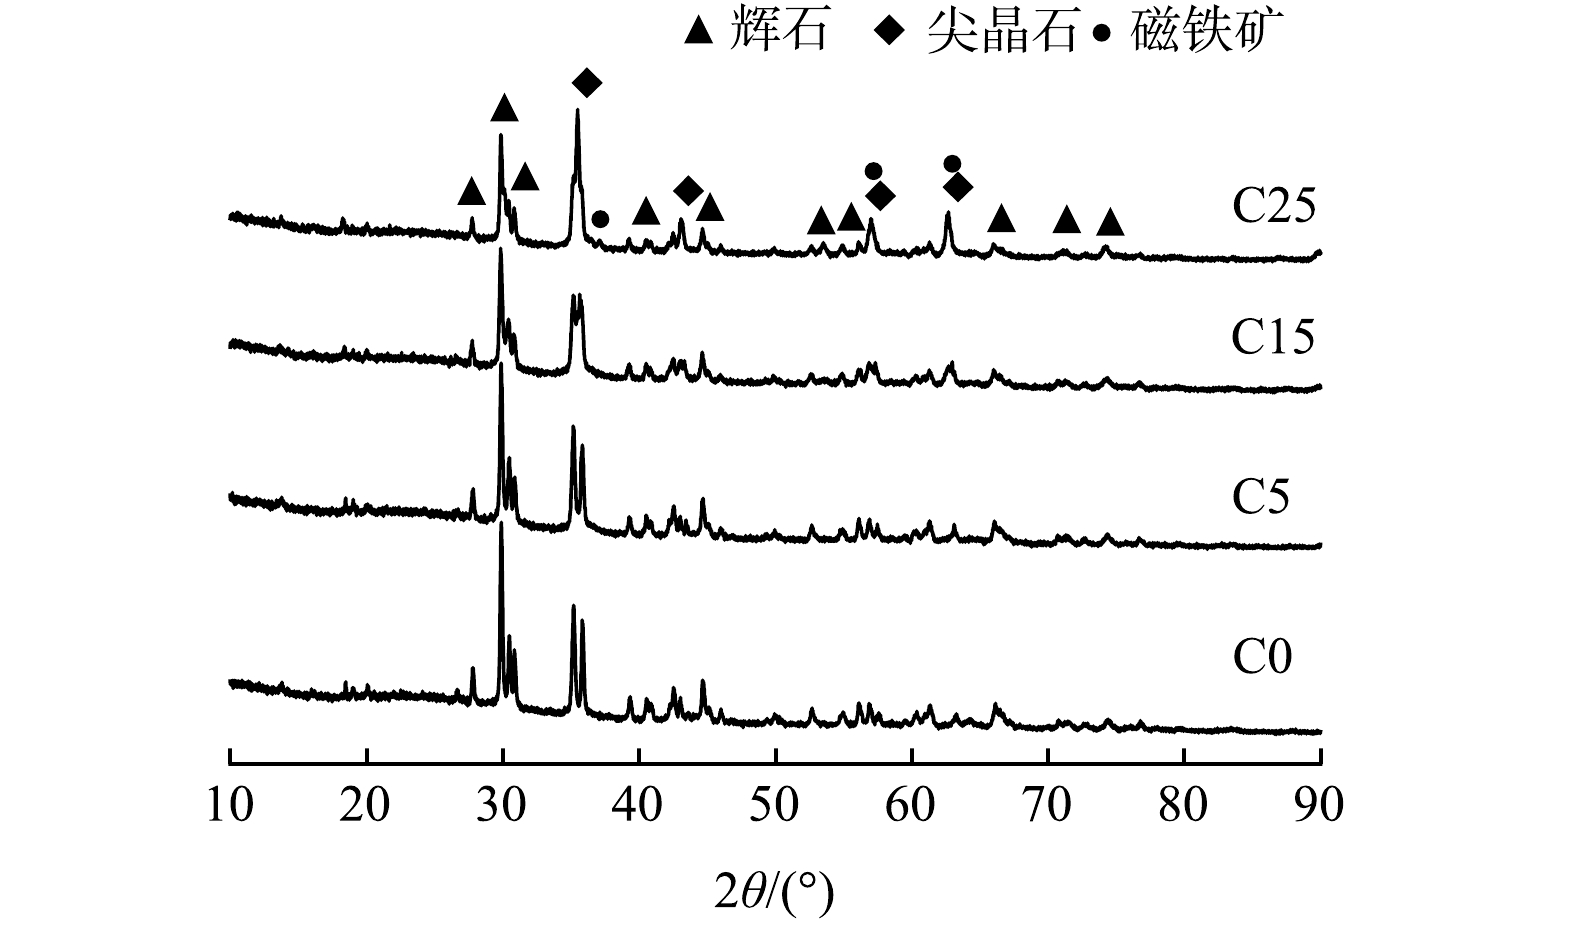
图 4 矿渣微晶玻璃样品XRD图谱
Figure 4. XRD patterns of slag glass ceramics
-
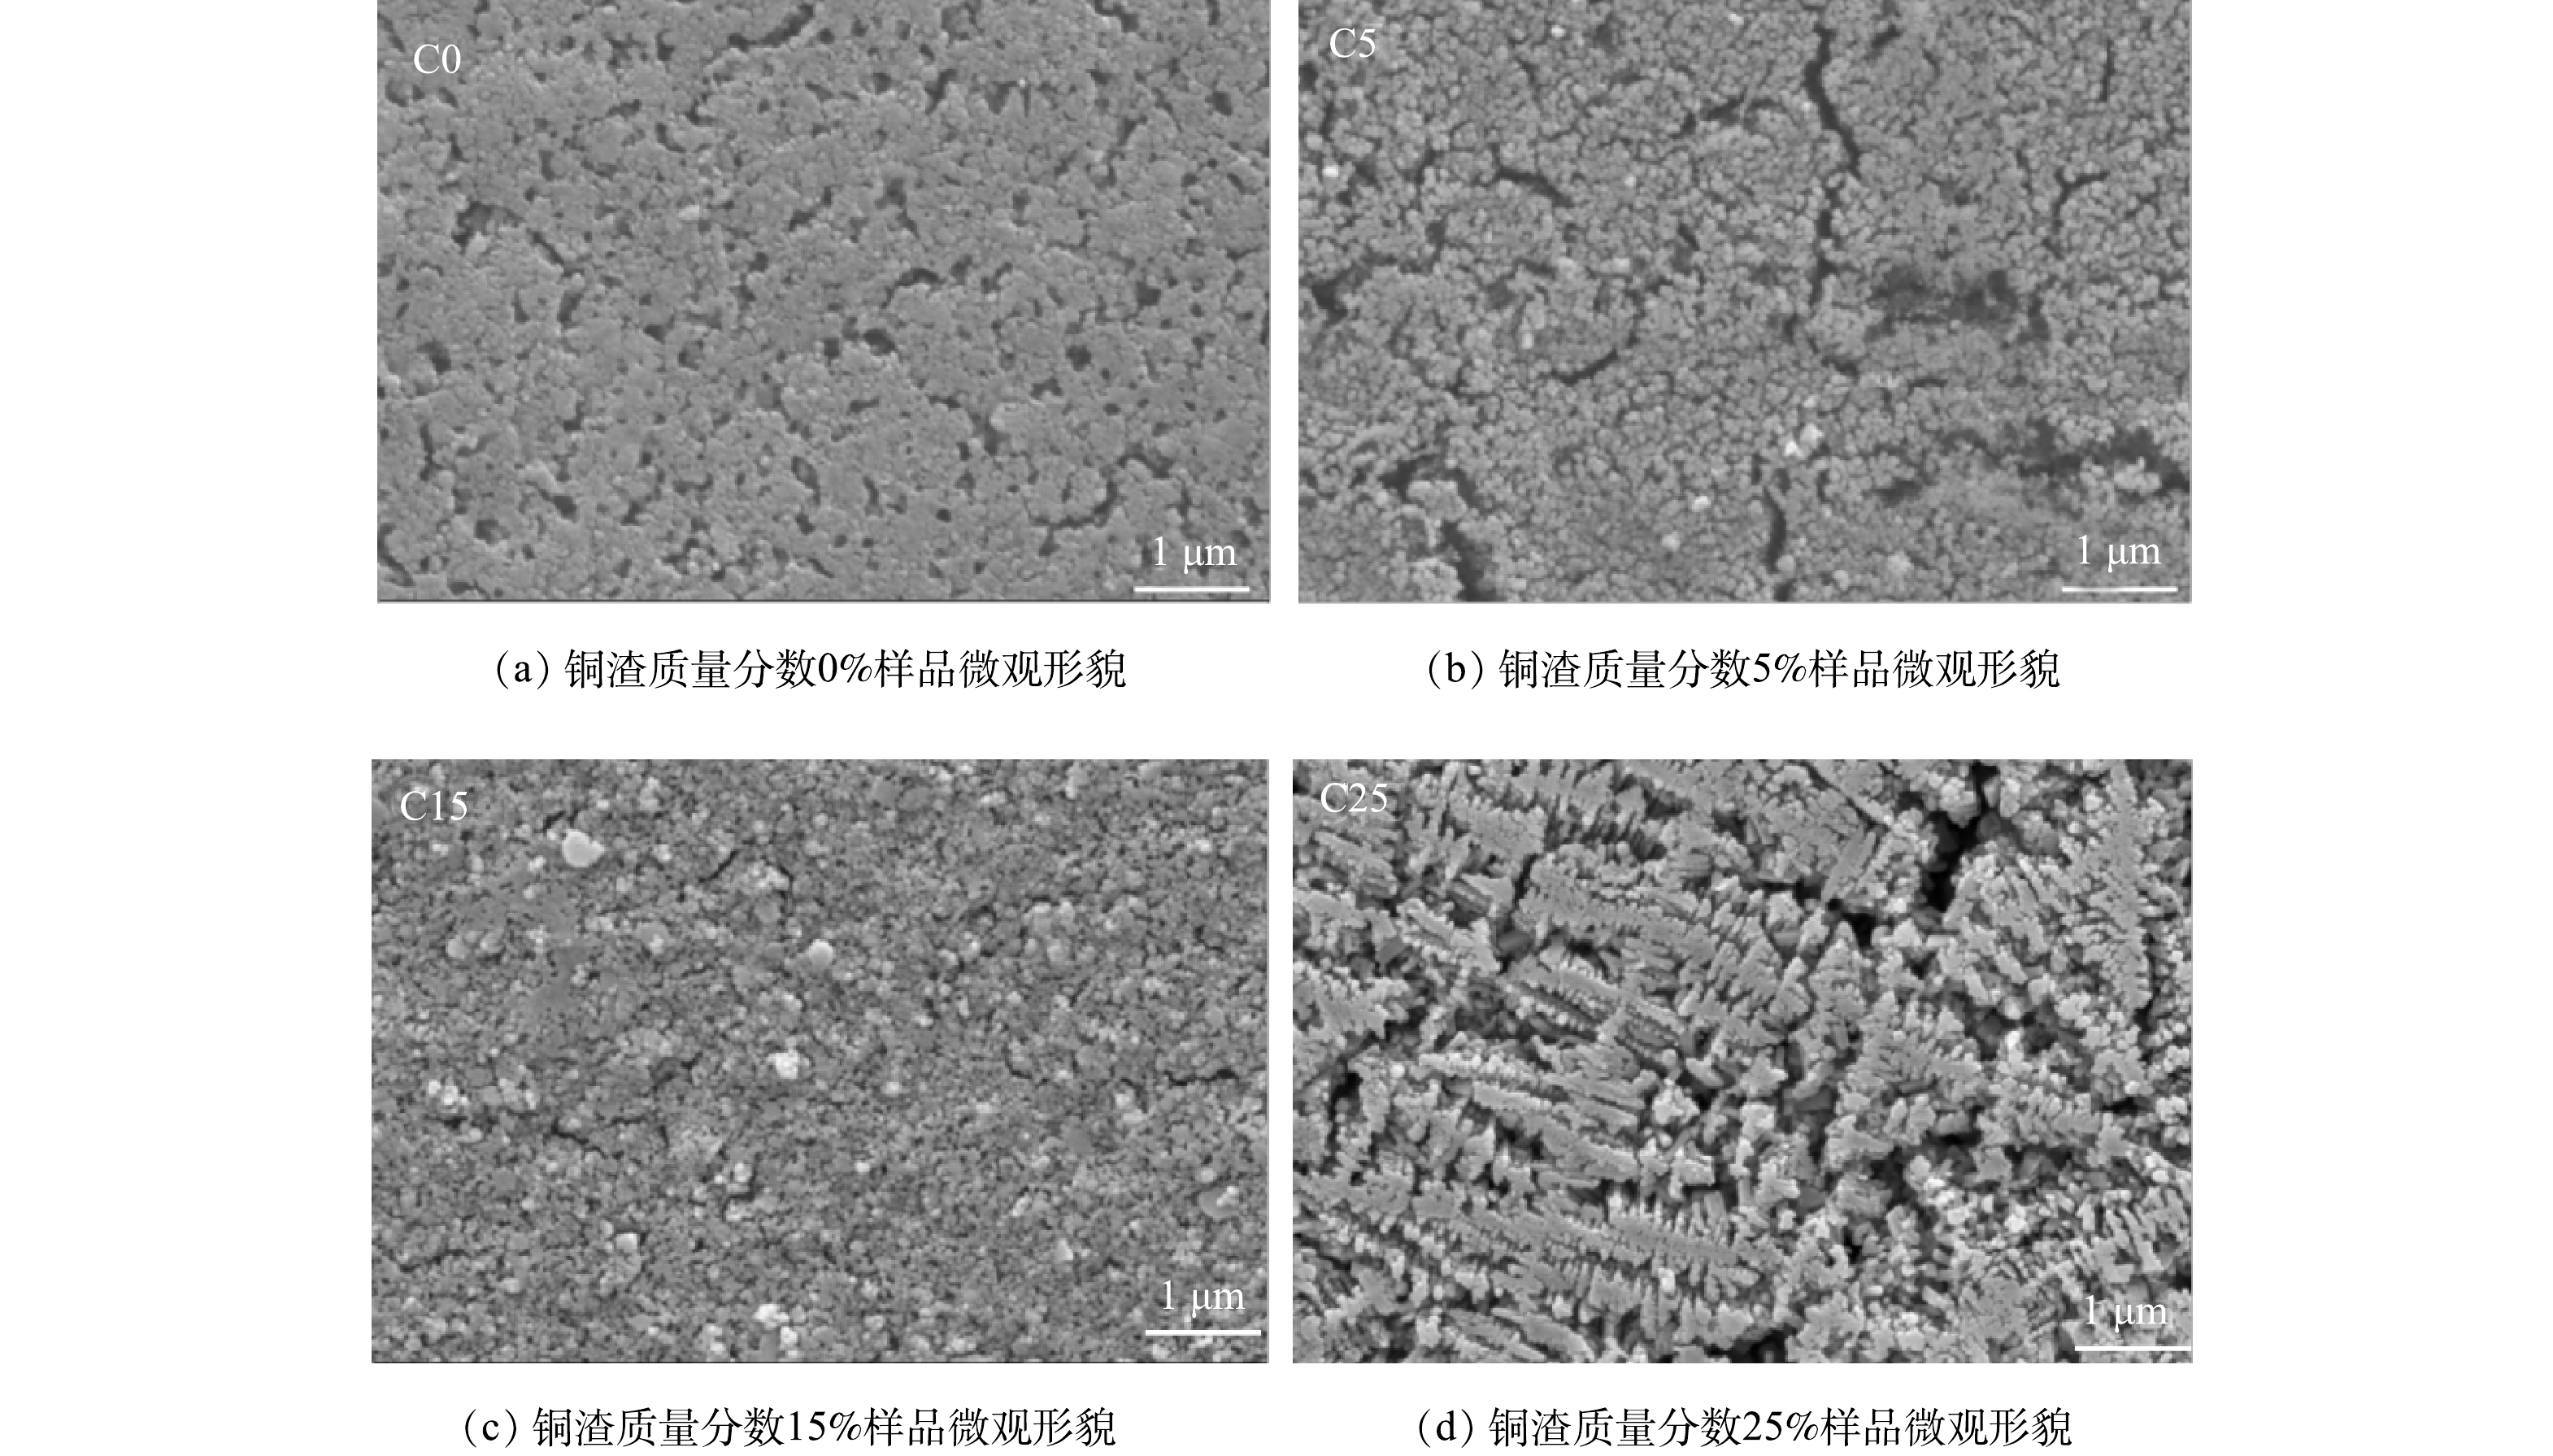
图 5 不同矿渣微晶玻璃样品微观形貌图
Figure 5. Microstructure diagram of different slag glass-ceramic samples
-
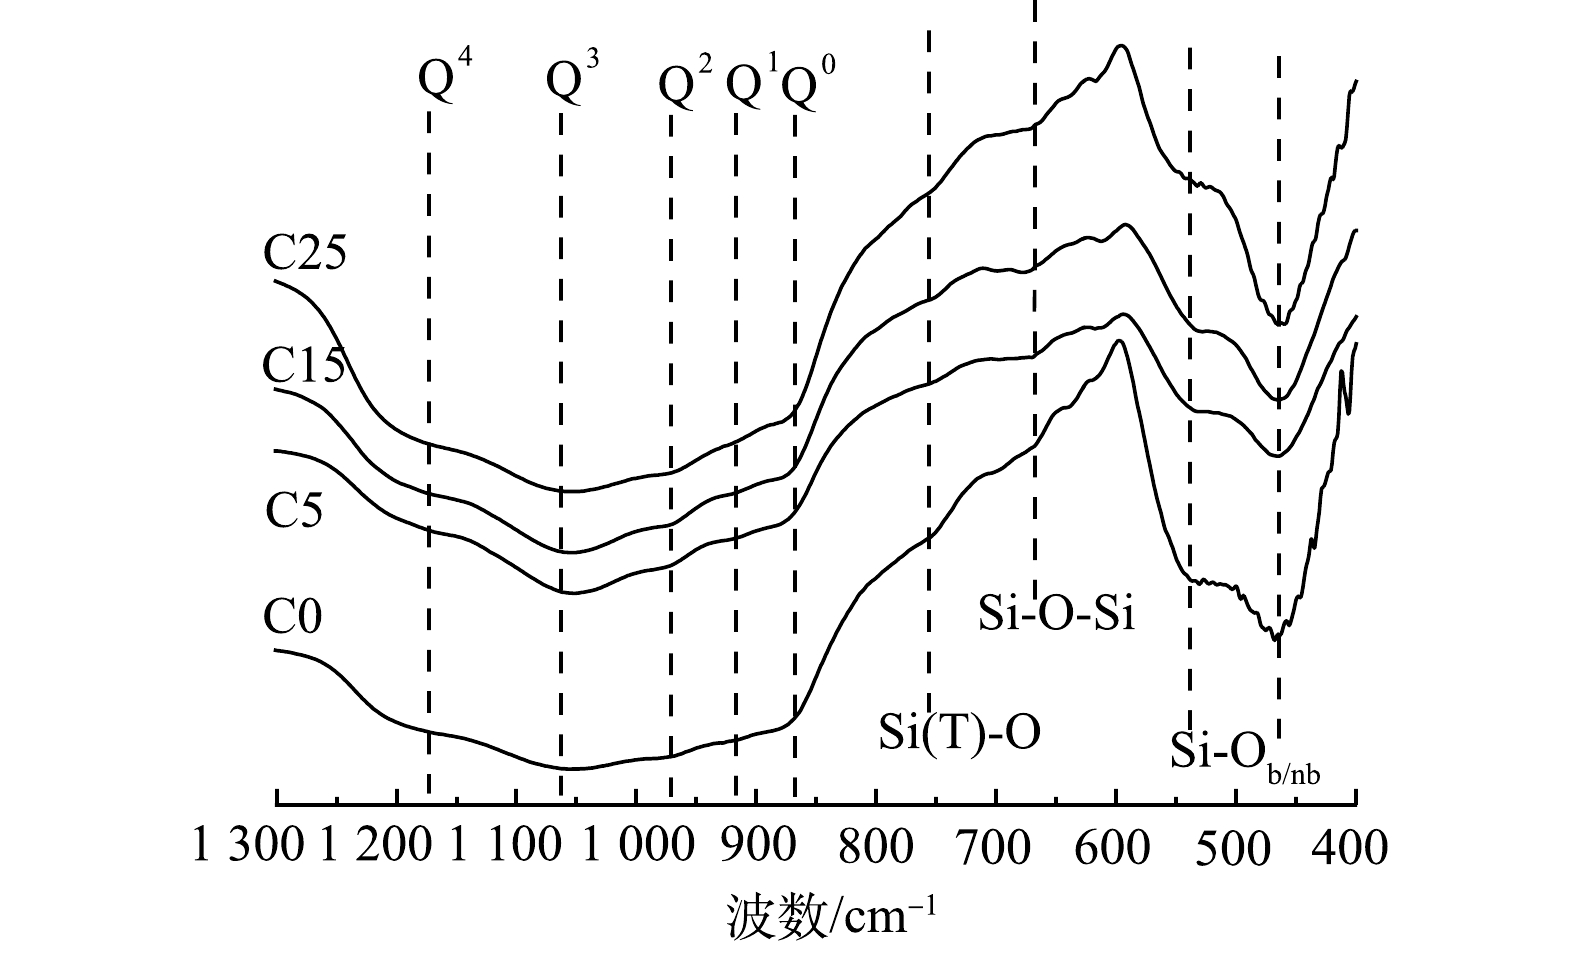
图 6 微晶玻璃样品红外光谱图
Figure 6. Infrared spectra of glass-ceramic samples
-
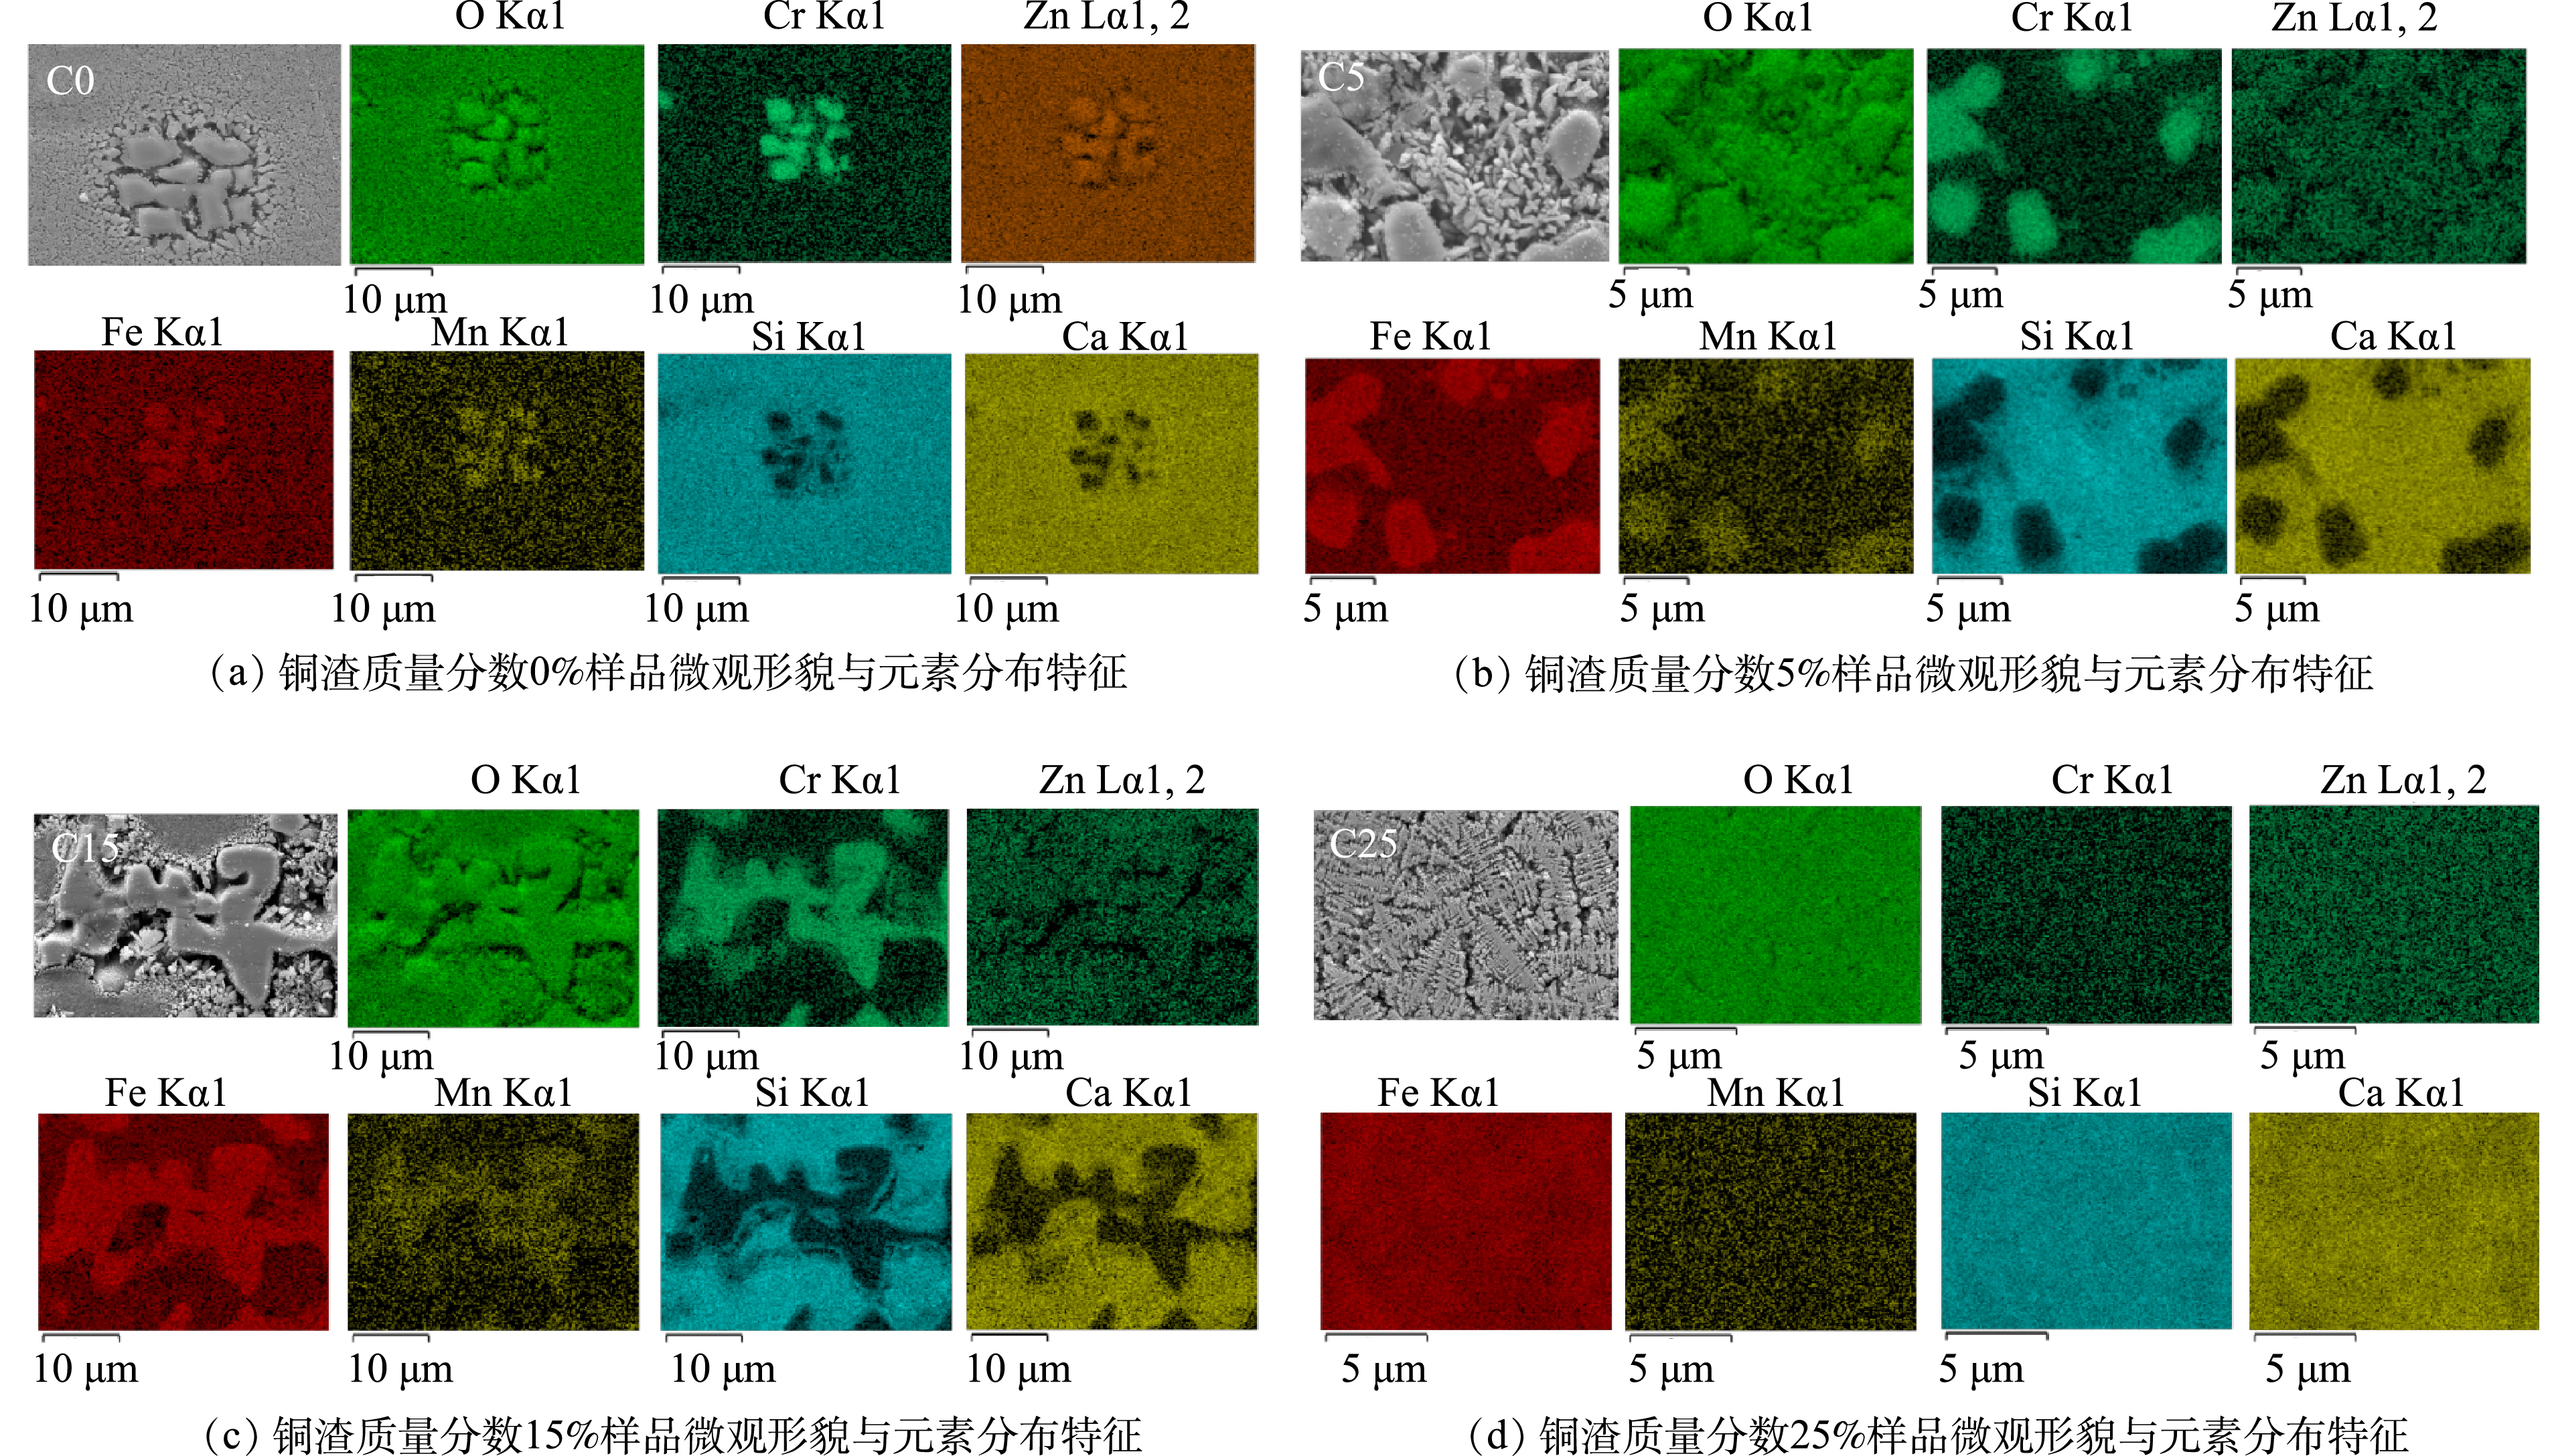
图 7 不同微晶玻璃样品中尖晶石的形貌与重金属元素分布特征
Figure 7. Morphology and heavy metal distribution characteristics of spinel in different glass-ceramic samples
-

图 8 重金属离子在微晶玻璃中离子迁移规律模型
Figure 8. The model of ion migration of heavy metal ions in glass ceramics
Figure
8 ,Table
4 个