-

图 1 不同升温速率下市政污泥TG/DTG曲线图
Figure 1. TG/DTG curves of municipal sludge at different heating rates
-

图 2 不同转化率下市政污泥热解动力学曲线
Figure 2. Kinetic plot of municipal sludge pyrolysis under different conversion rates
-

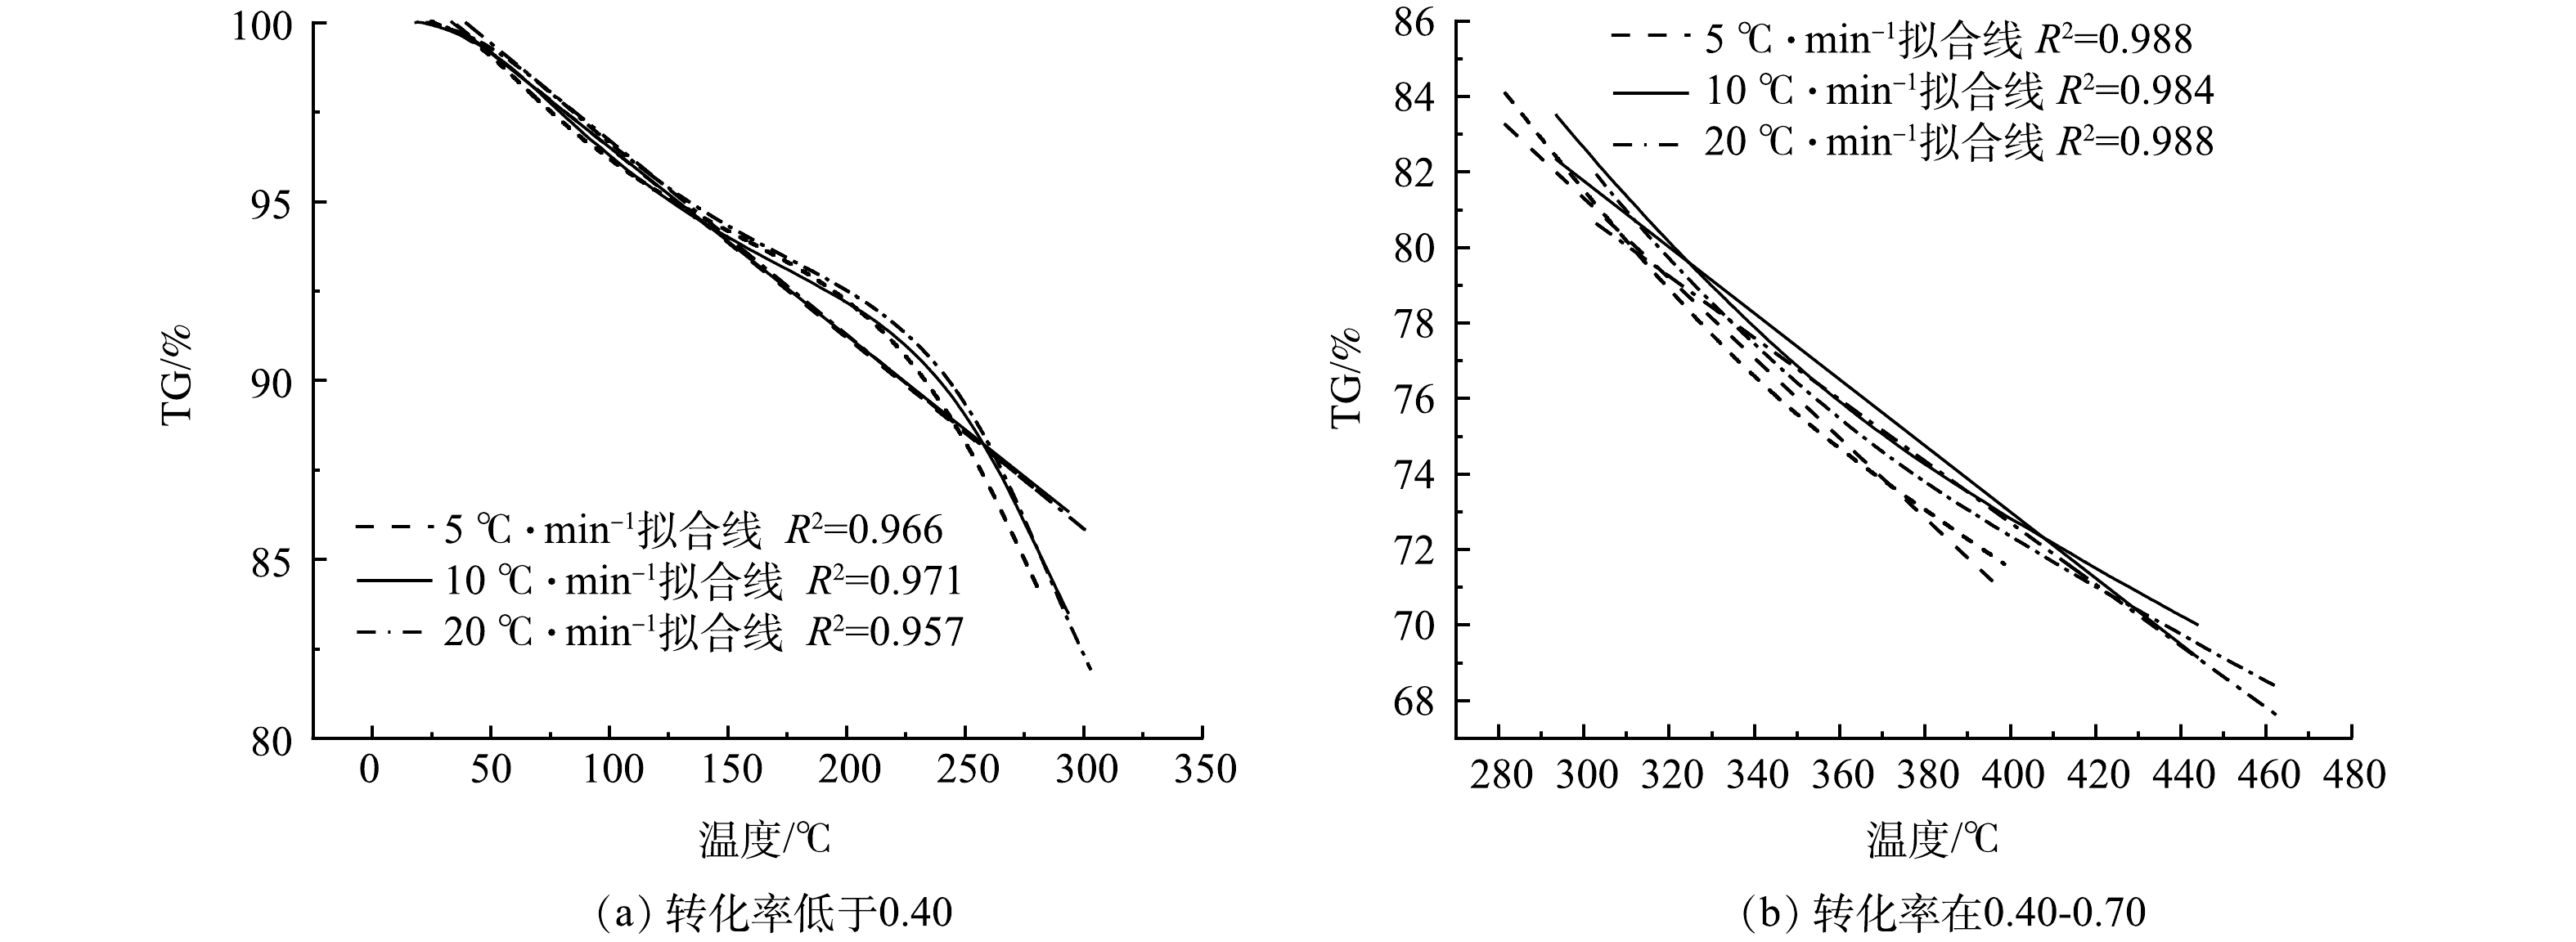
图 3 不同转化率下的TG曲线拟合
Figure 3. TG fitting curve under different conversion rates
-

图 4 不同温度下市政污泥热解红外光谱及部分波数段二阶导数转换后峰谱图
Figure 4. FTIR and second derivative of a certain wavenumber of municipal sludge pyrolysis at different temperatures
-

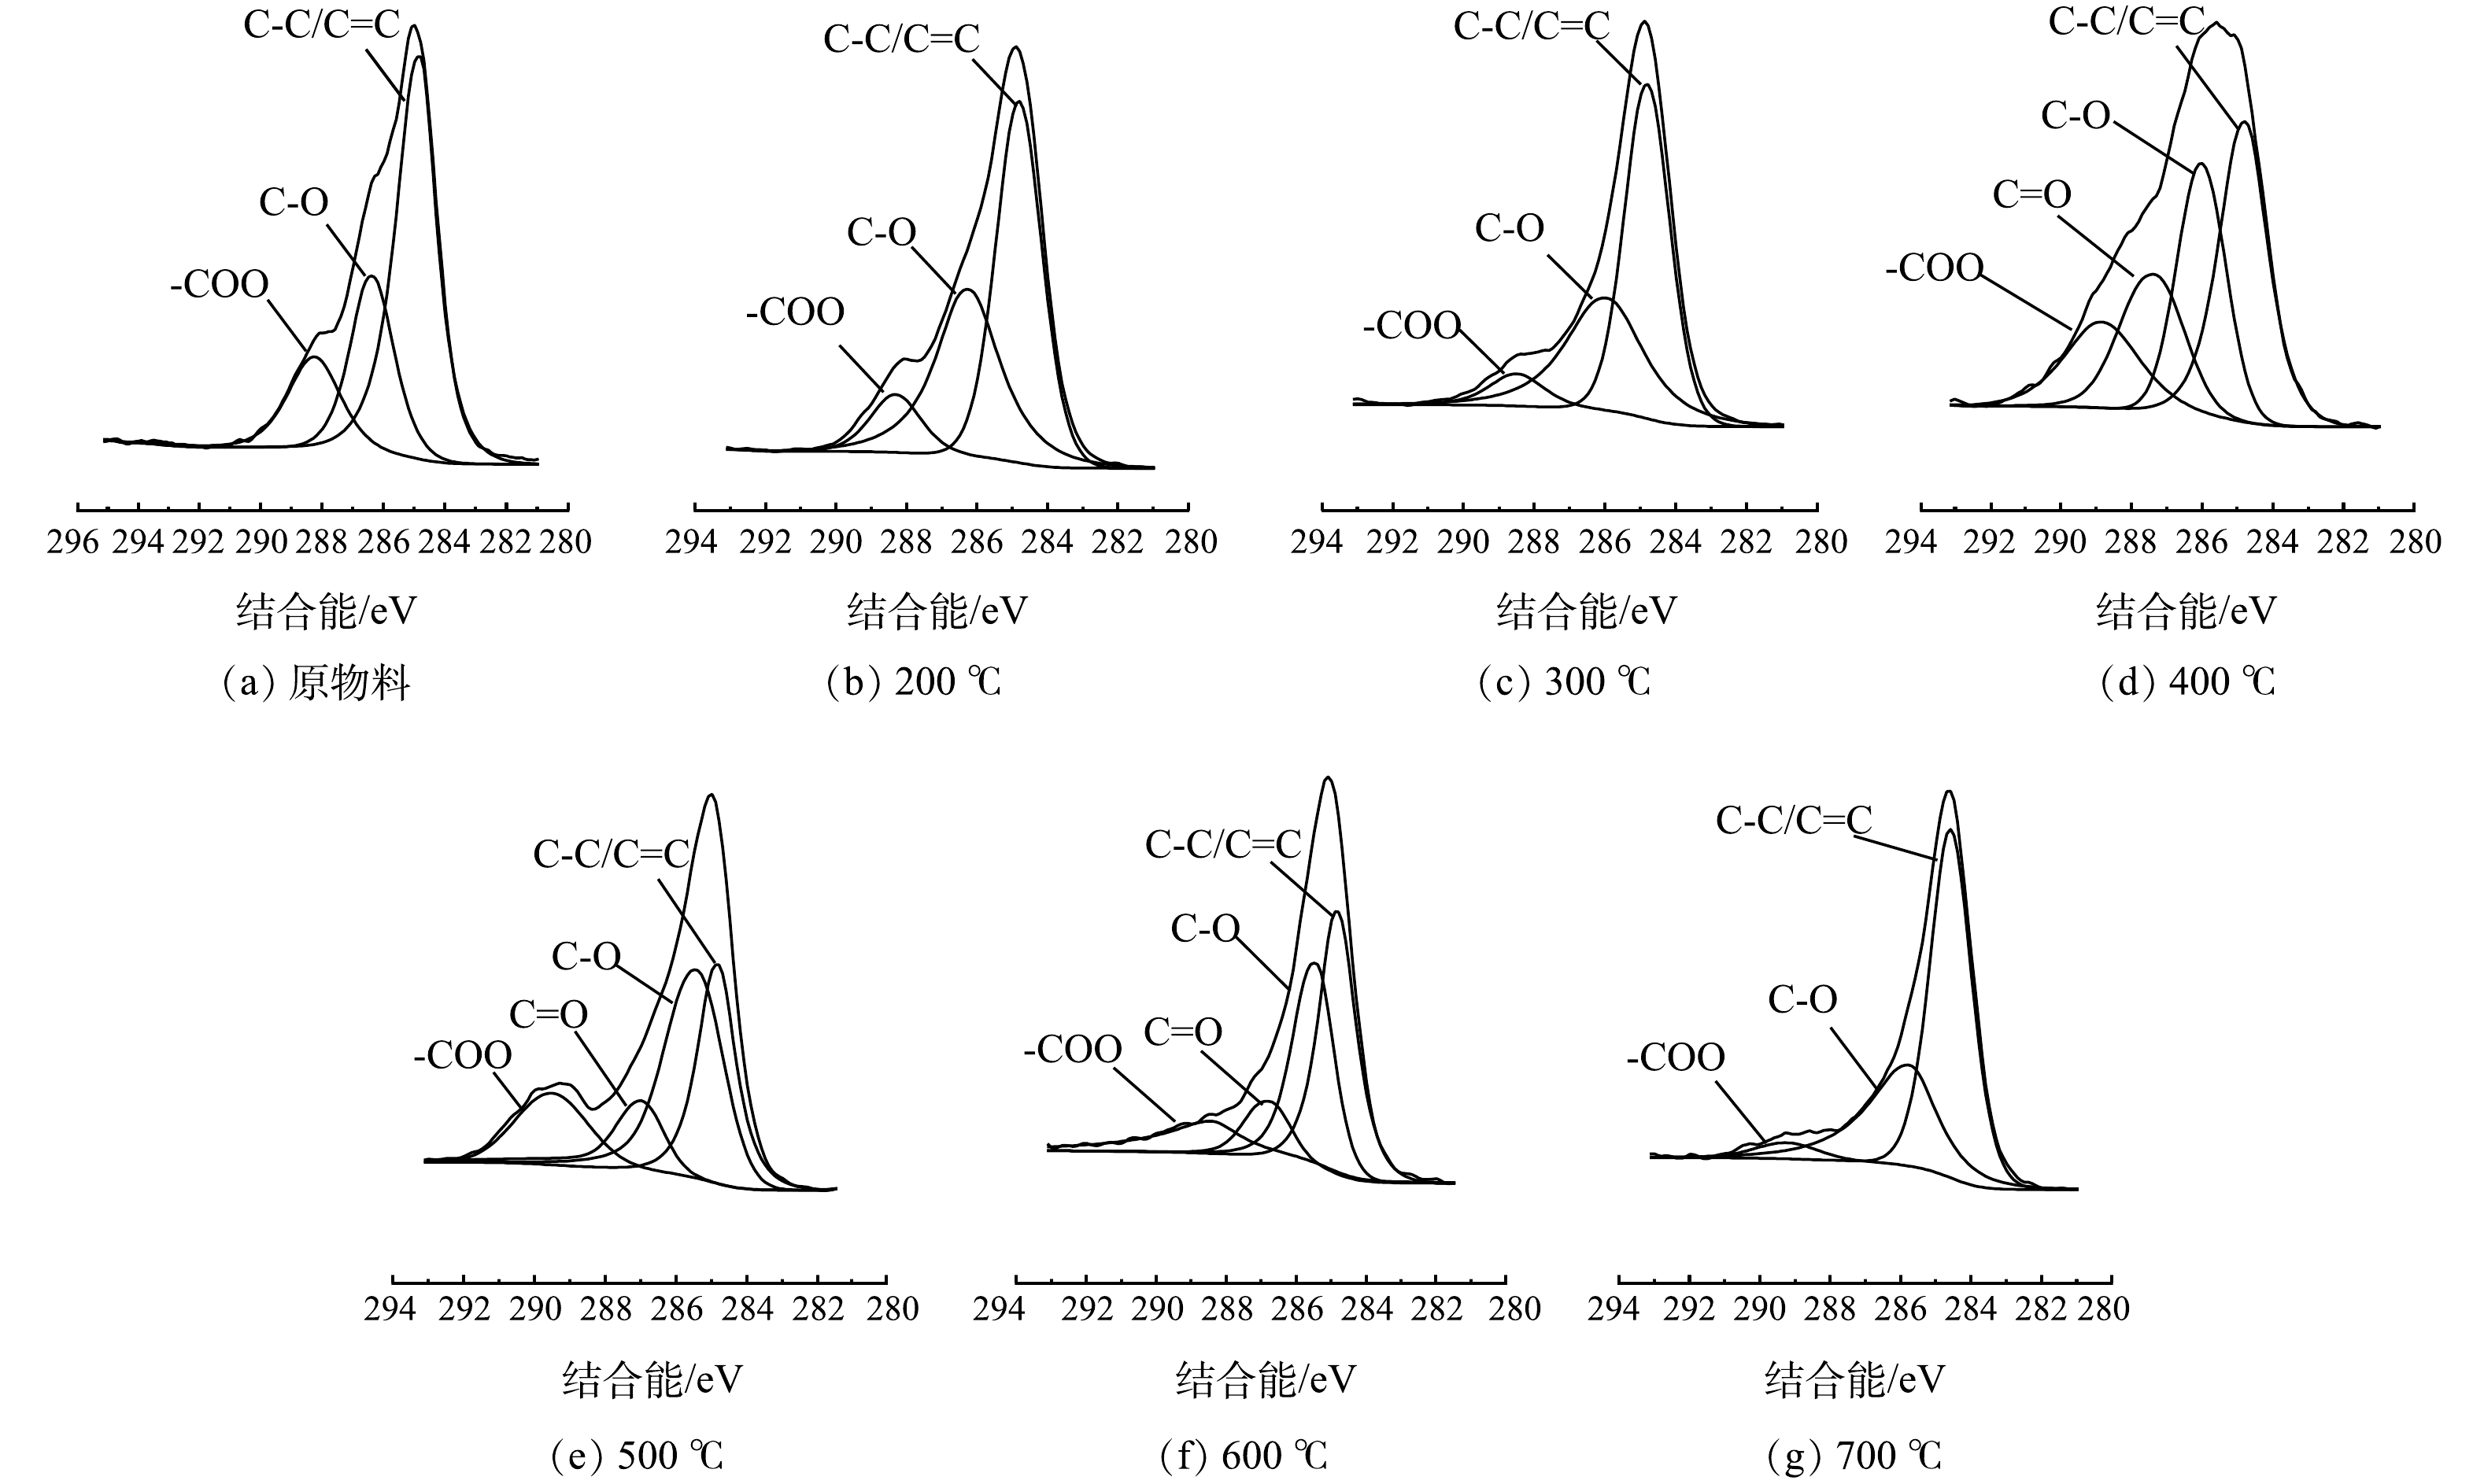
图 5 不同温度下市政污泥热解后C1s谱图
Figure 5. C1s of municipal sludge pyrolysis at different temperatures
Figure
5 ,Table
3 个