-

图 1 采样点及研究区土地利用类型图
Figure 1. Sampling sites and land-use figure
-

图 2 上游来水前后水质参数箱体图
Figure 2. Box diagram of water quality parameters before and after upstream inflow
-

图 3 新汴河上游来水前后上覆水中DOM荧光组分及激发发射载荷图
Figure 3. The Ex/Em loadings of the fluorescent components and split-half validated by PARAFAC model
-

图 4 新汴河上游来水前后上覆水中DOM荧光组分含量箱体图
Figure 4. Box diagram of DOM fluorescence component content in overlying water before and after incoming water from the upper reaches of the Xin Bian River
-
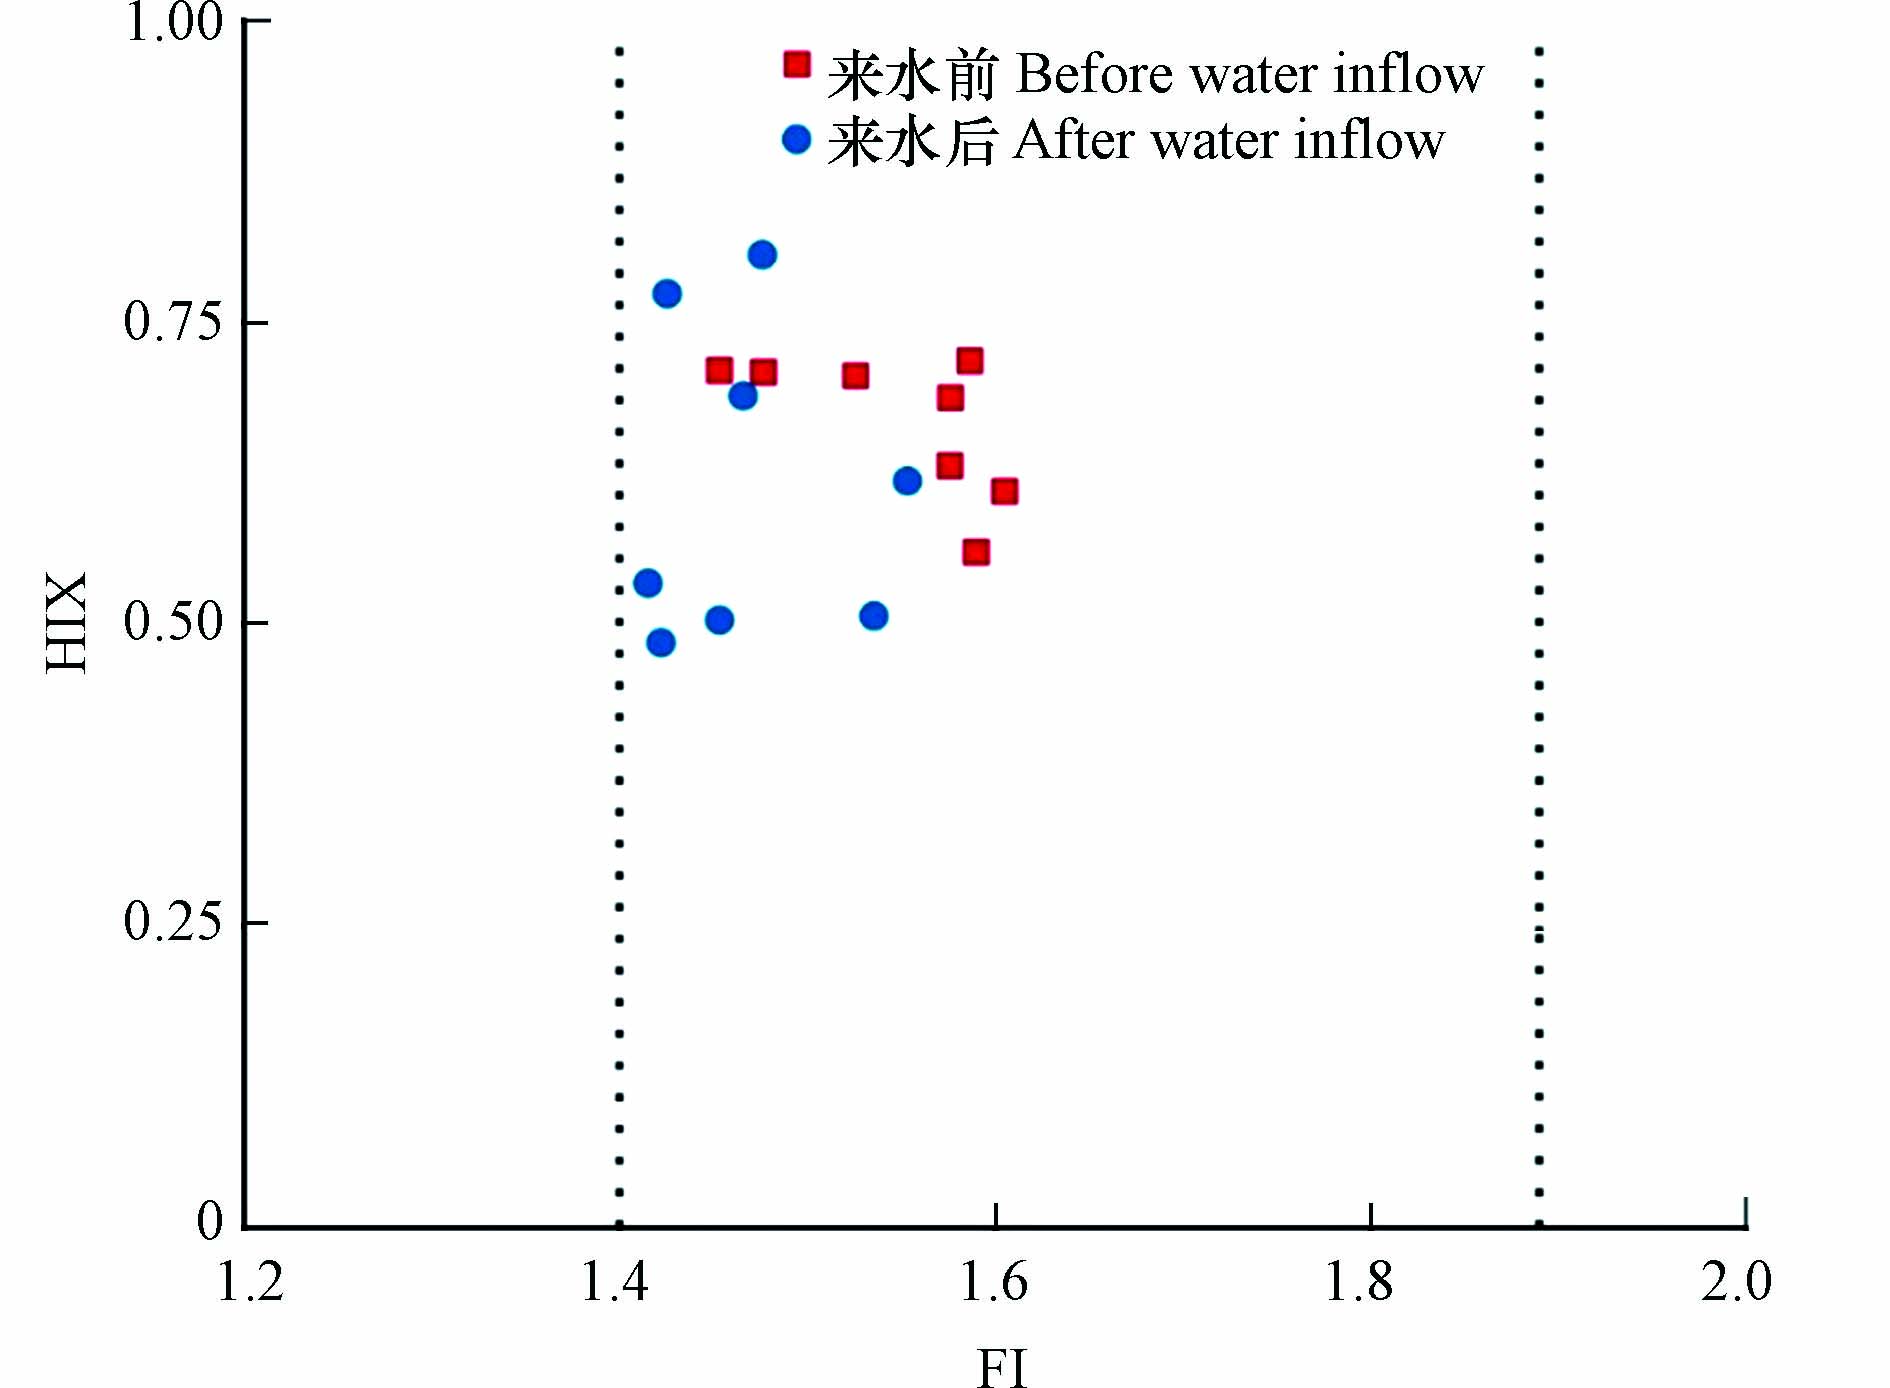
图 5 新汴河上游来水前后荧光指数分布
Figure 5. Fluorescence index distribution before and after incoming water from the upper reaches of the Xin Bian River
-

图 6 新汴河上游来水前后水质参数和荧光组分分面图(a)自组织神经网络K-平均值聚类图(b)
Figure 6. Water quality parameters and fluorescence components before and after inflow into the upper reaches of the New Bianhe River (a) Self-organizing map K-mean clustering diagram (b)
Figure
6 ,Table
1 个