-
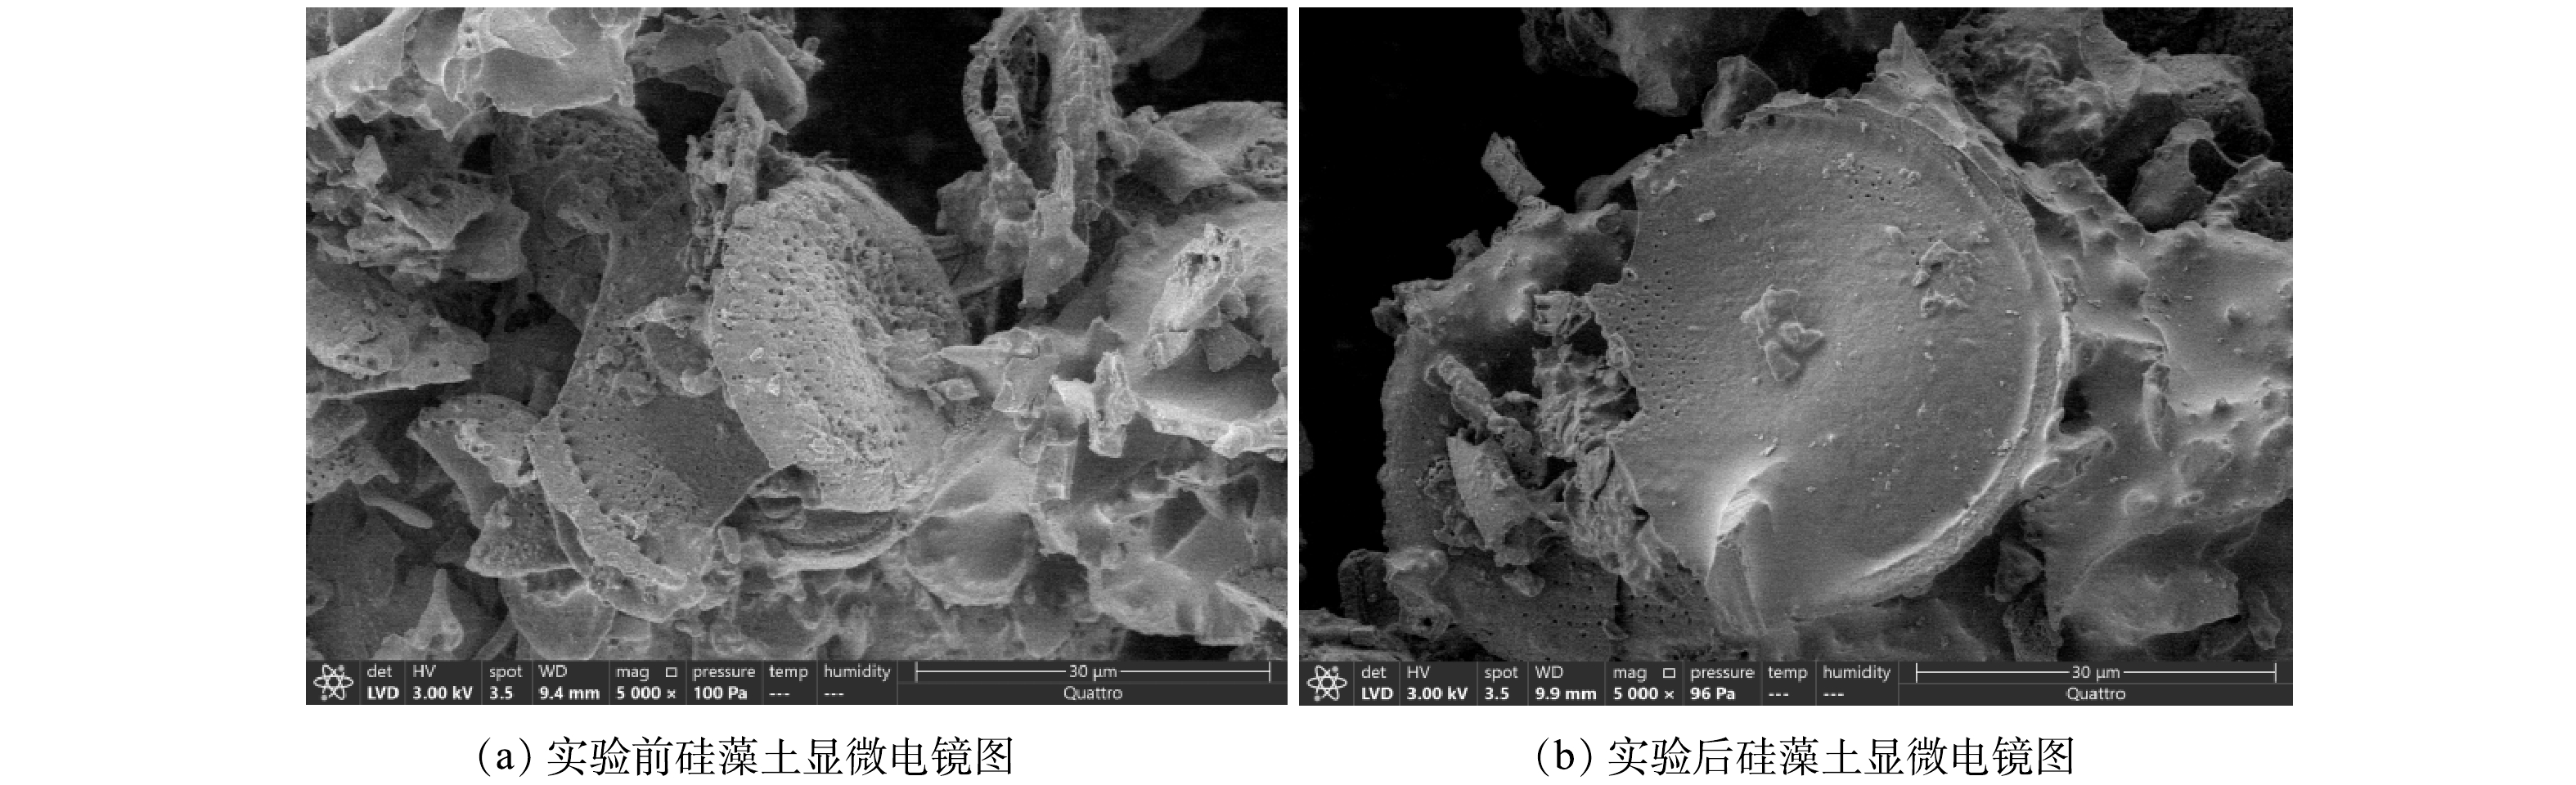
图 1 添加nZVI及Pb、U前后的硅藻土显微电镜图对比
Figure 1. Comparison of micrograph of diatomaceous earth before and after adding NZVI, Pb, U
-
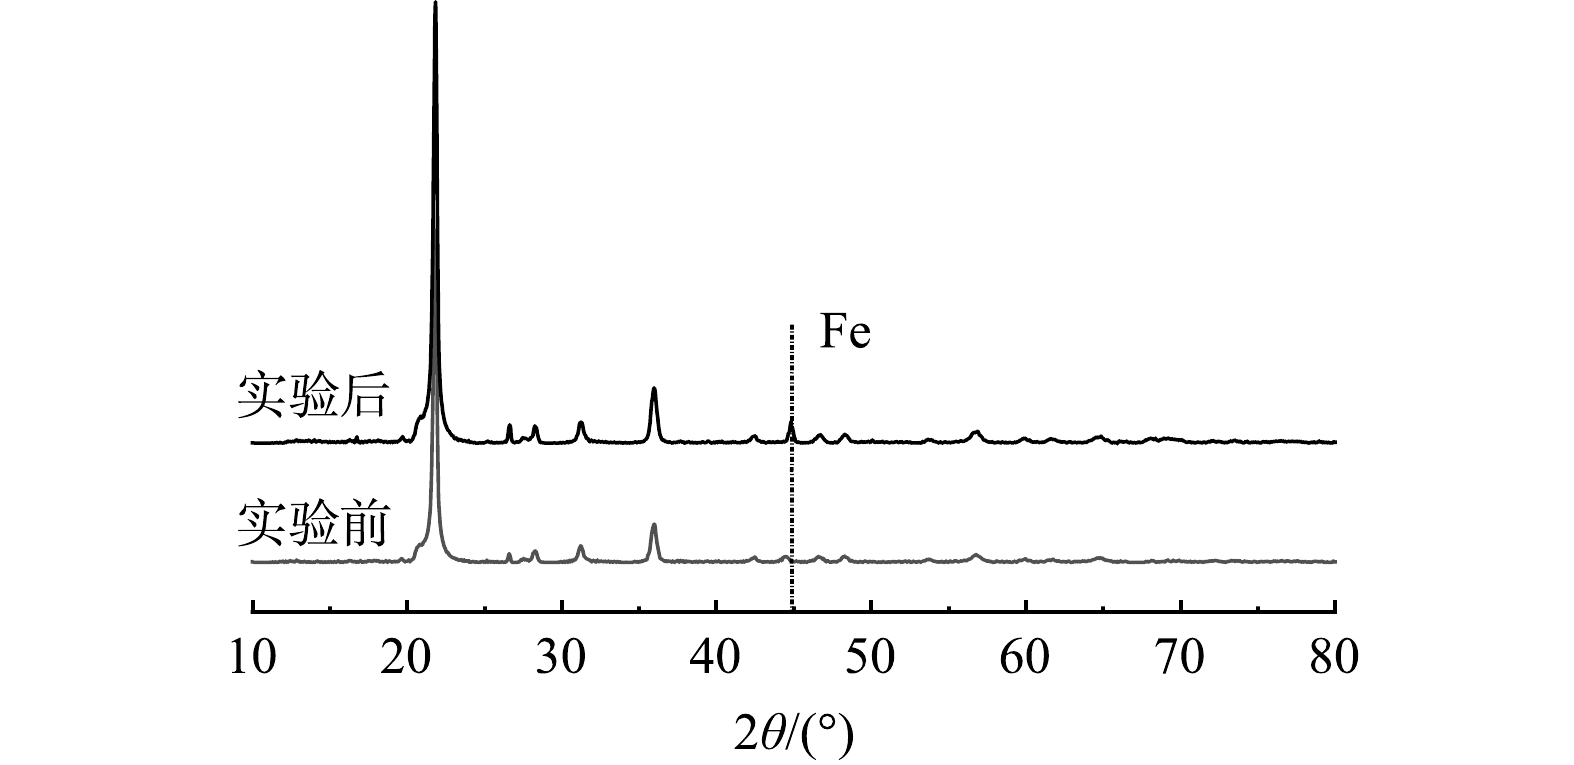
图 2 添加nZVI及Pb、U前后的硅藻土XRD图对比
Figure 2. Comparison of XRD diagram of diatomaceous earth before and after adding NZVI, Pb, U
-
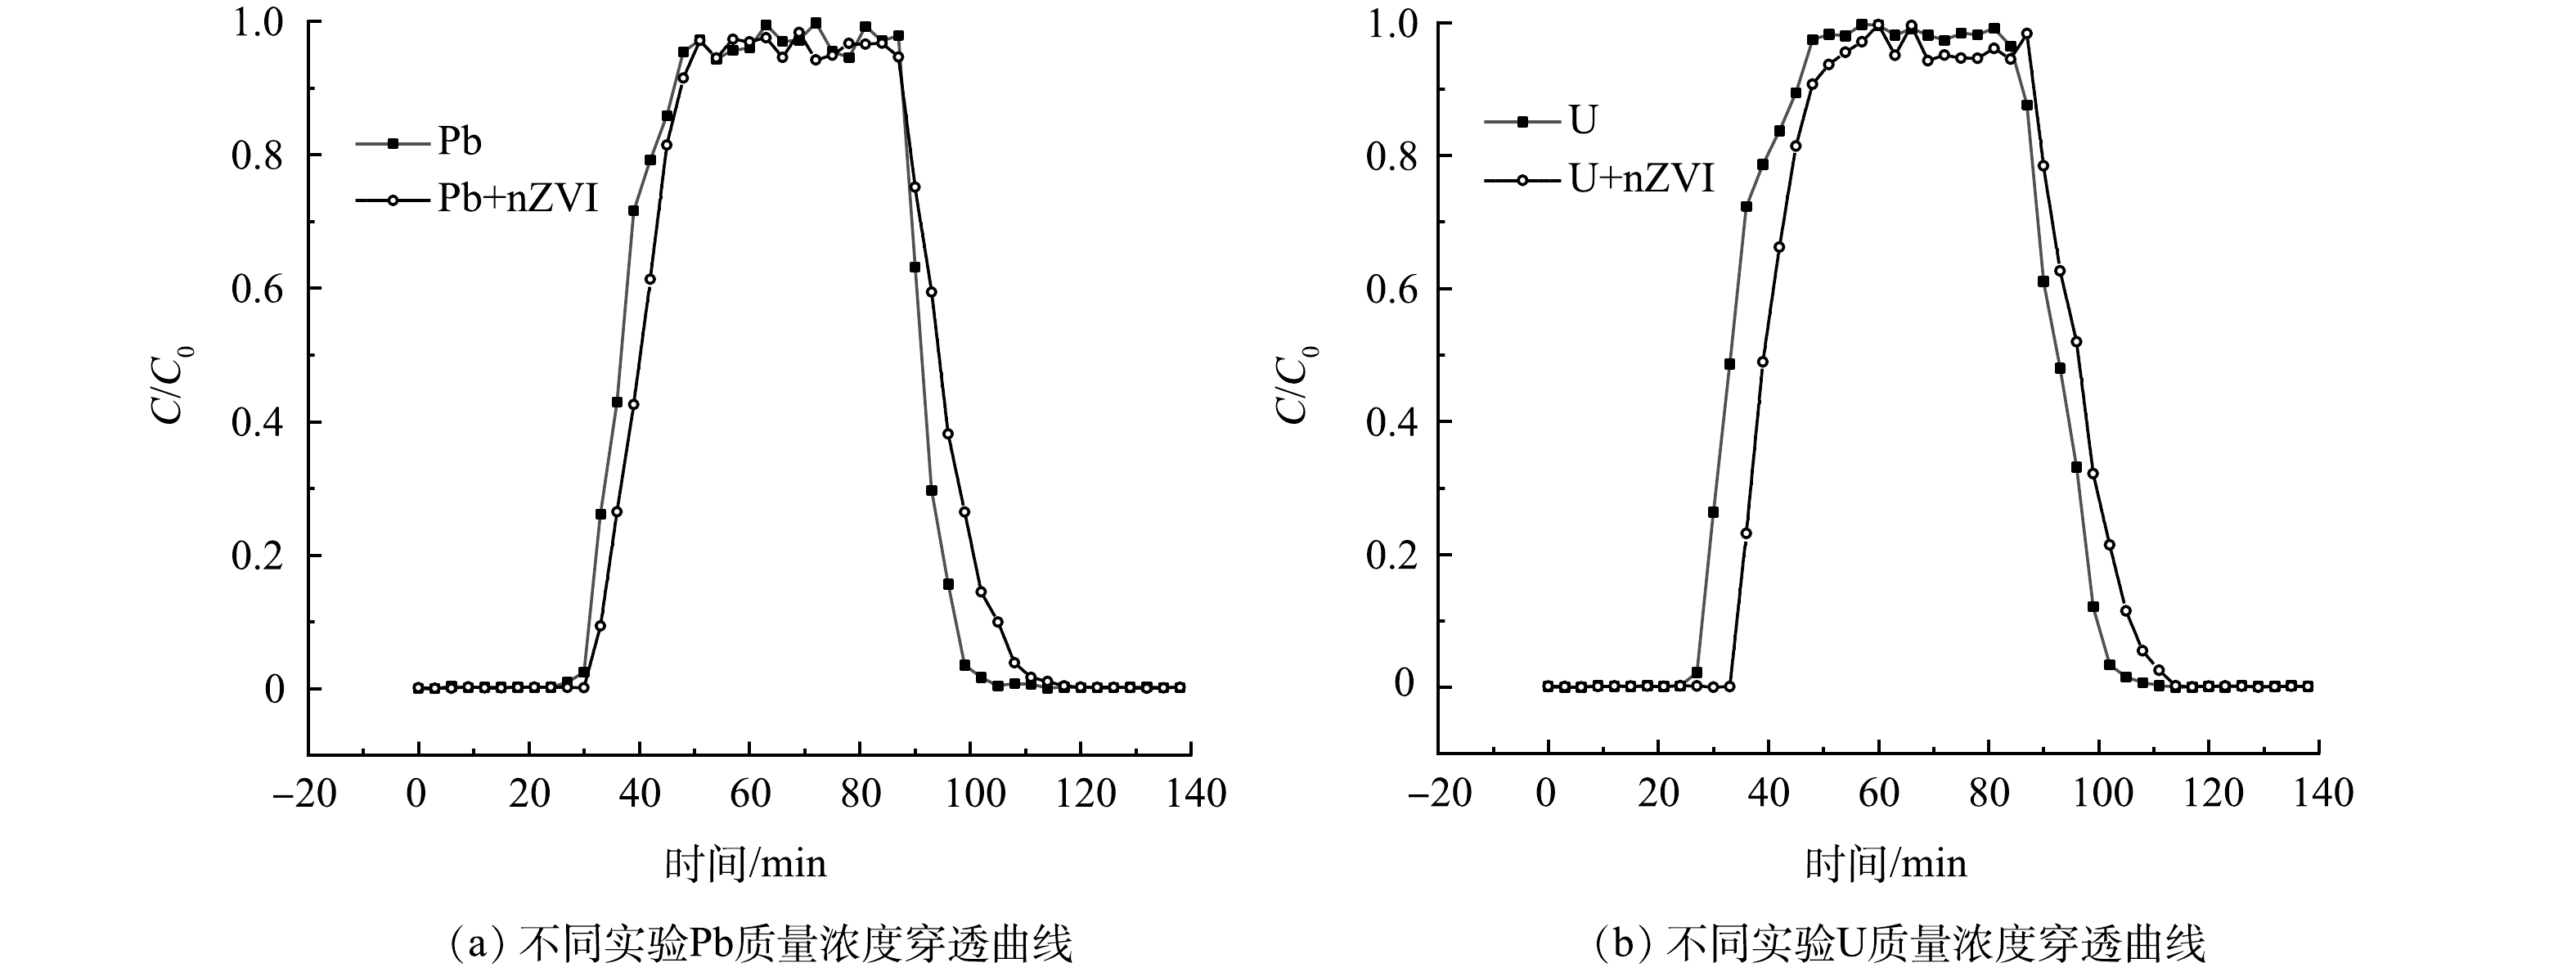
图 3 不同实验Pb、U质量浓度穿透曲线
Figure 3. Penetration curves of Pb and U mass concentrations in different experiments
-
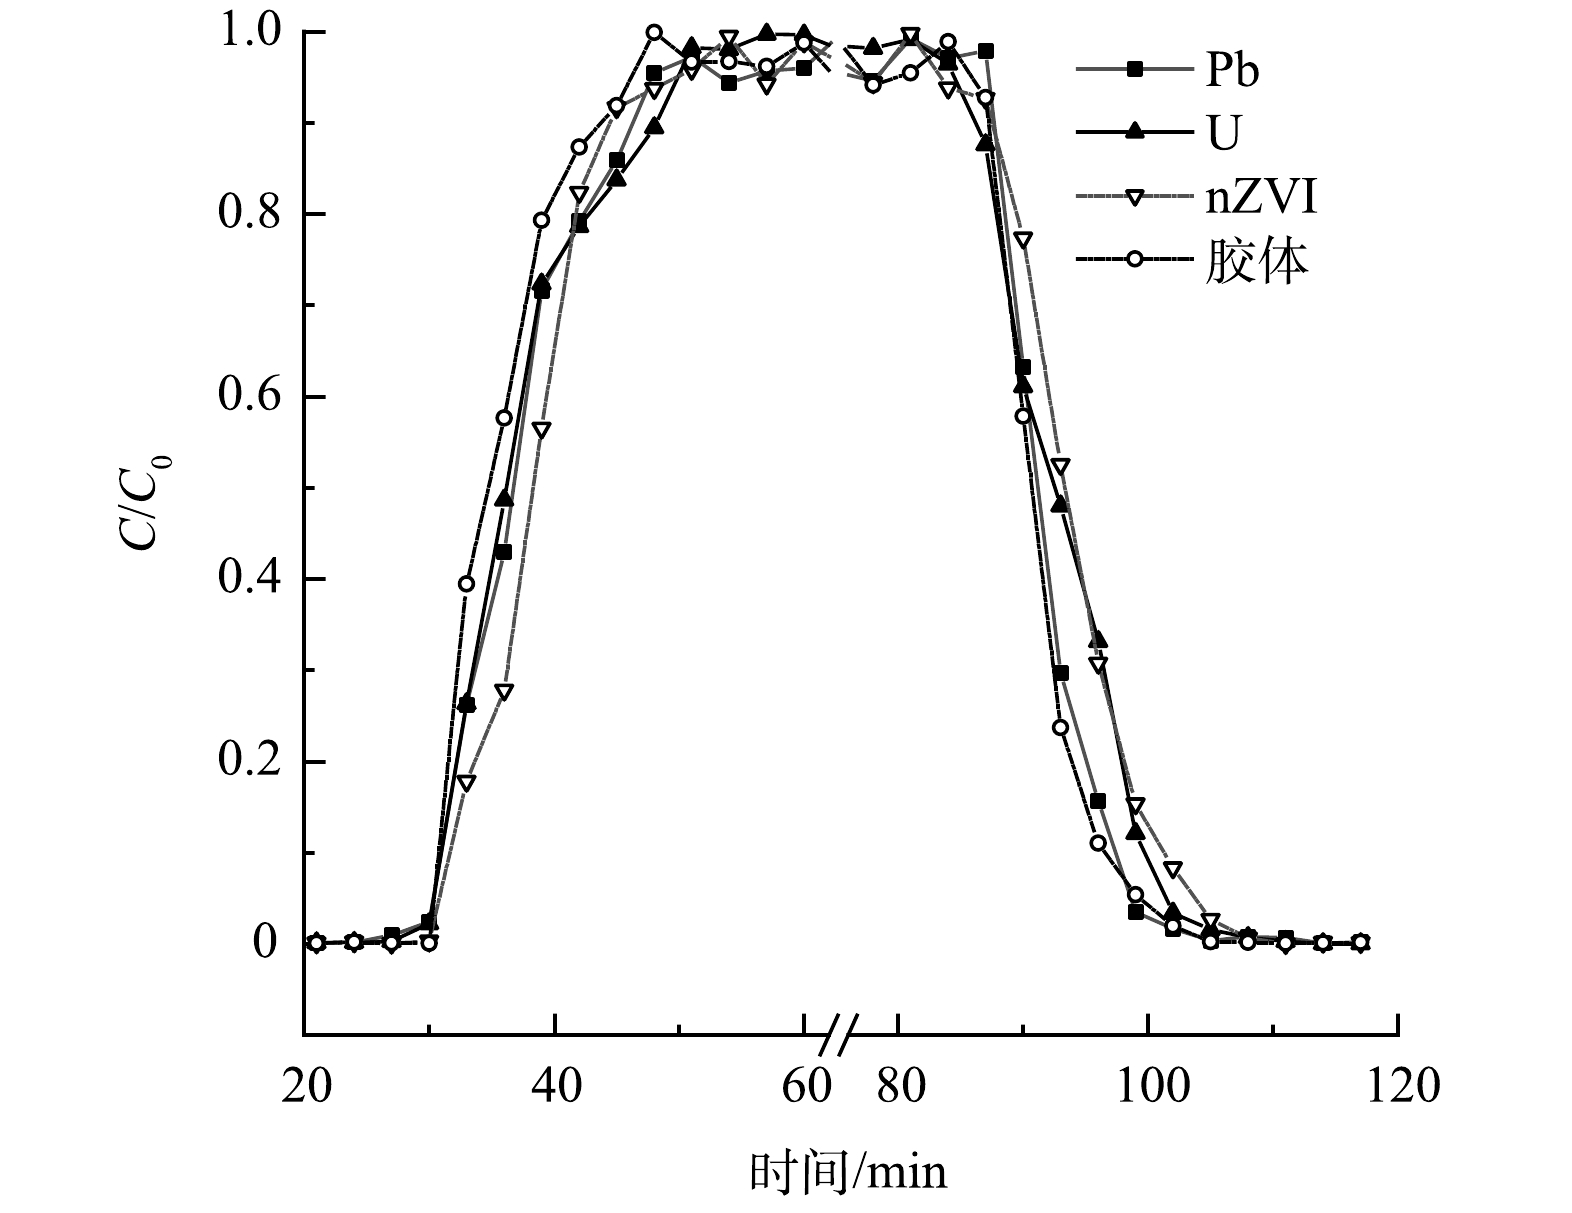
图 4 单独运移条件下高岭土胶体,Pb,U与nZVI质量浓度的穿透曲线
Figure 4. Penetration curves of Pb, U, nZVI and kaolinite colloids mass concentrations in individual migration
-
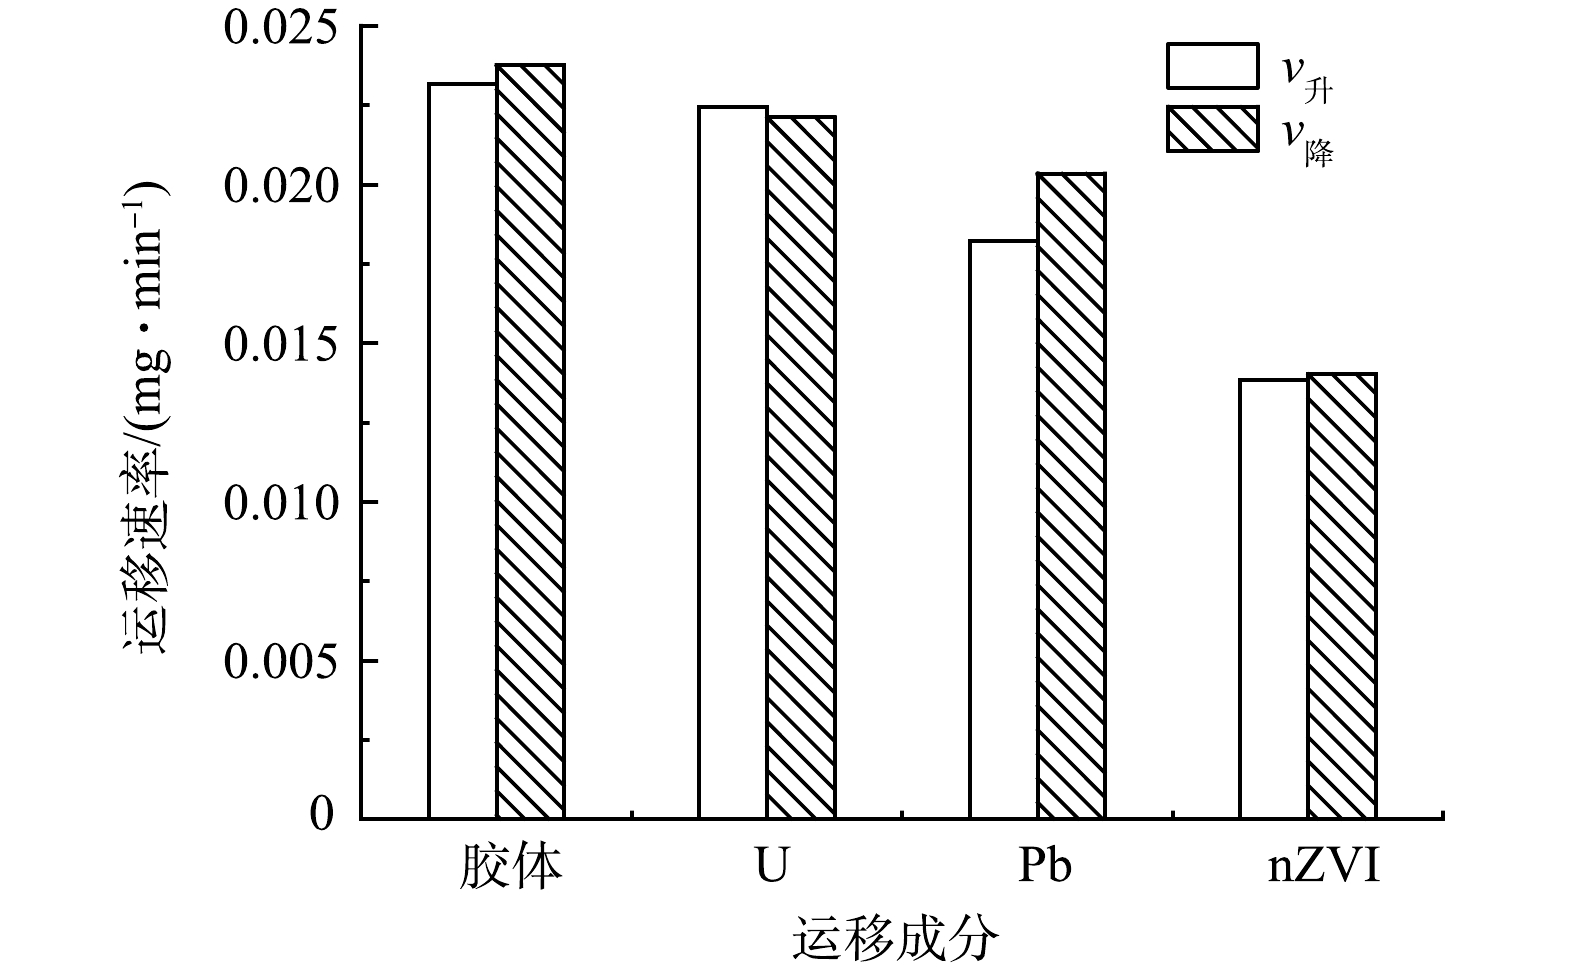
图 5 Pb、U、nZVI与高岭土胶体单独运移速率
Figure 5. The transport velocity of Pb, U, nZVI and kaolinite colloids in individual migration
-
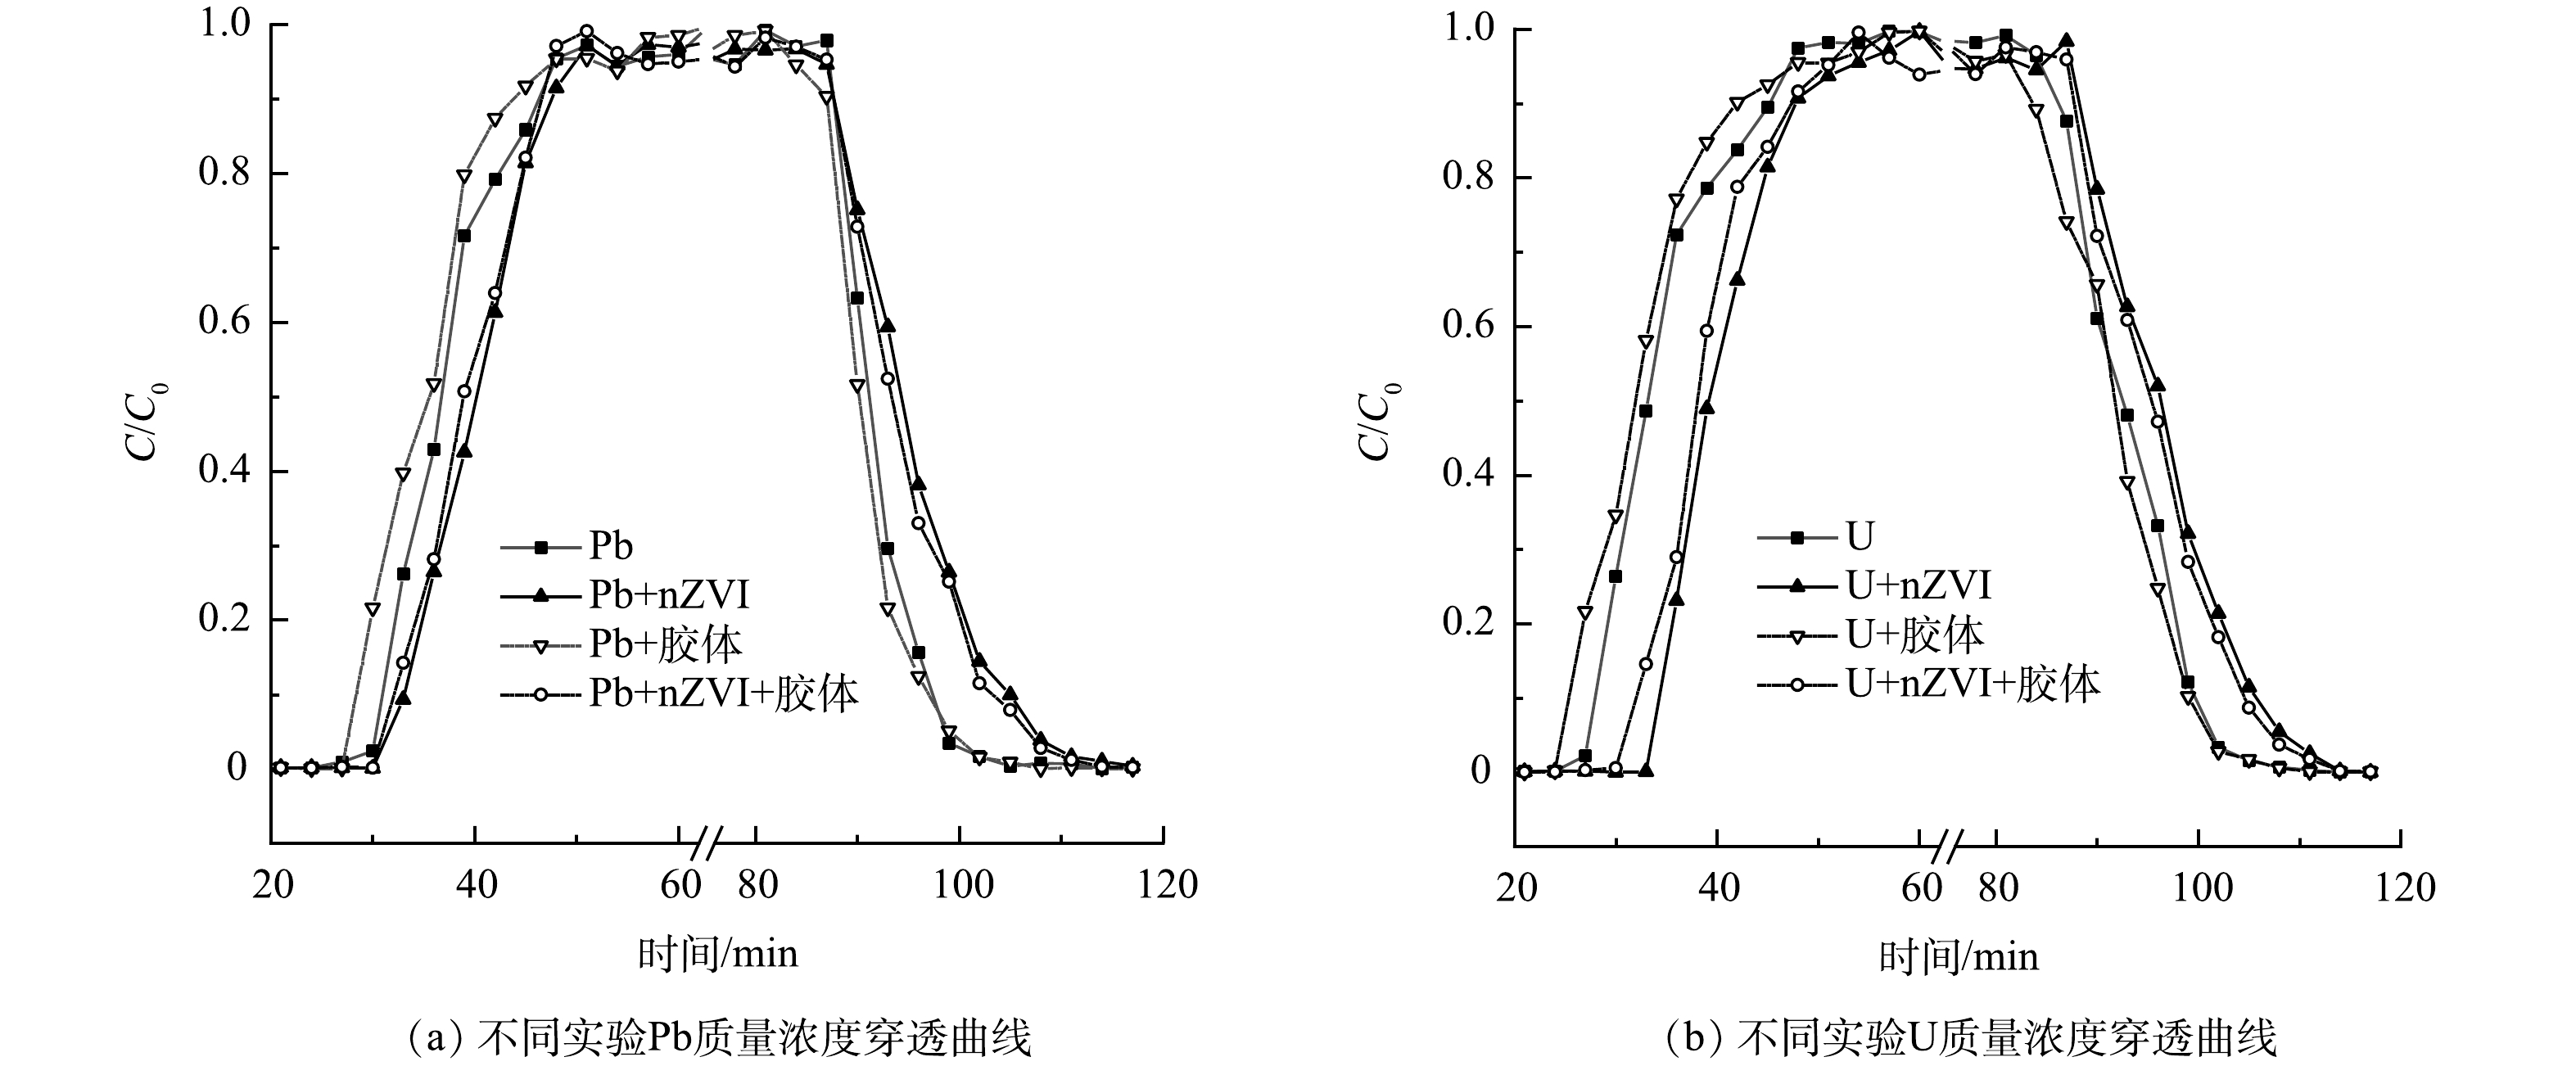
图 6 nZVI与高岭土胶体对Pb、U运移影响实验的穿透曲线
Figure 6. Penetration curves on the experiment of effect on Pb, U transport by NZVI and kaolinite colloids
-
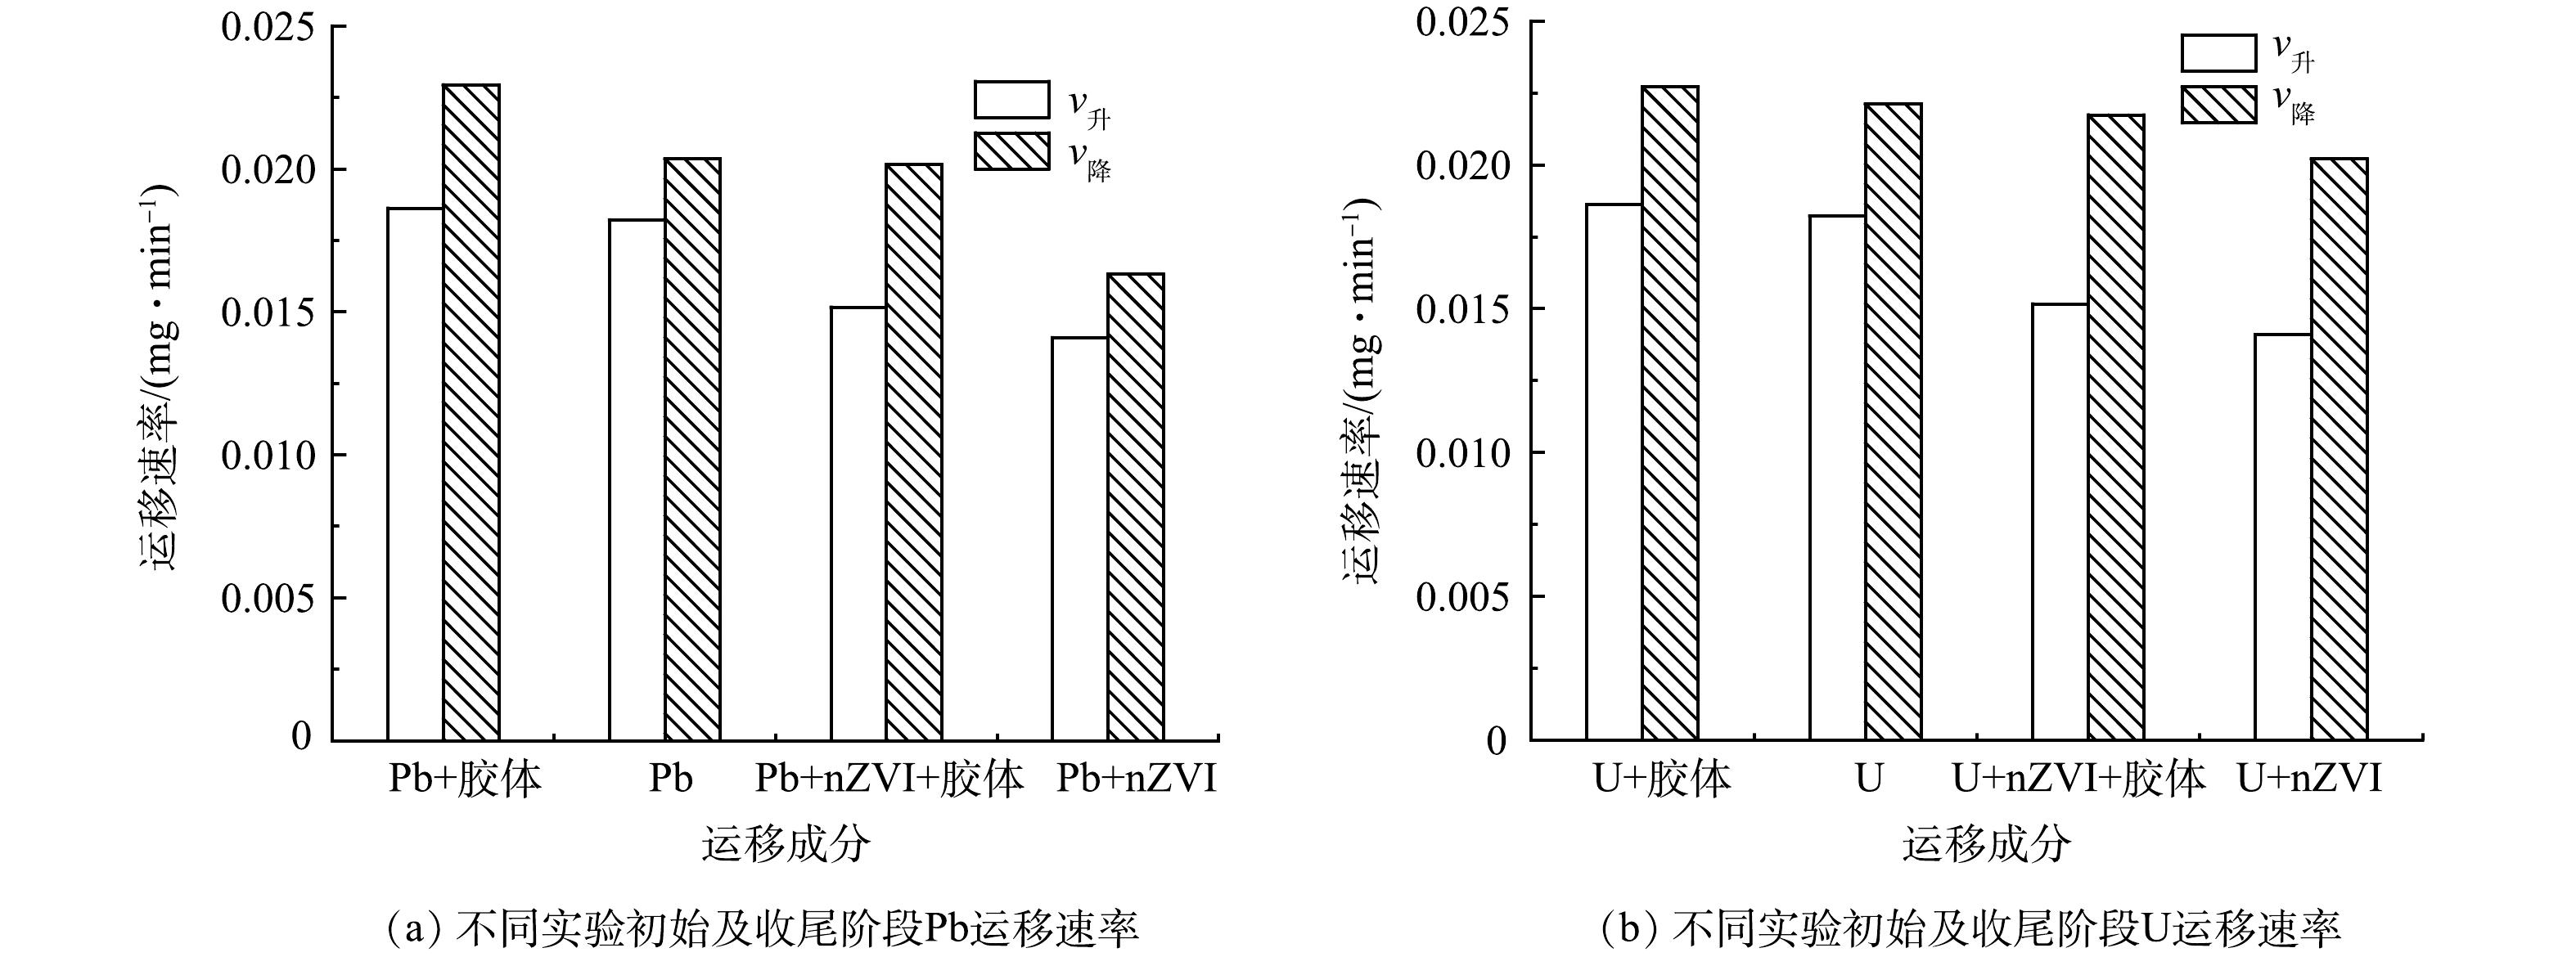
图 7 不同实验中初始及收尾阶段Pb、U的运移速率
Figure 7. The transport velocity of Pb, U in initial phase and close-out phase in different experiments
-
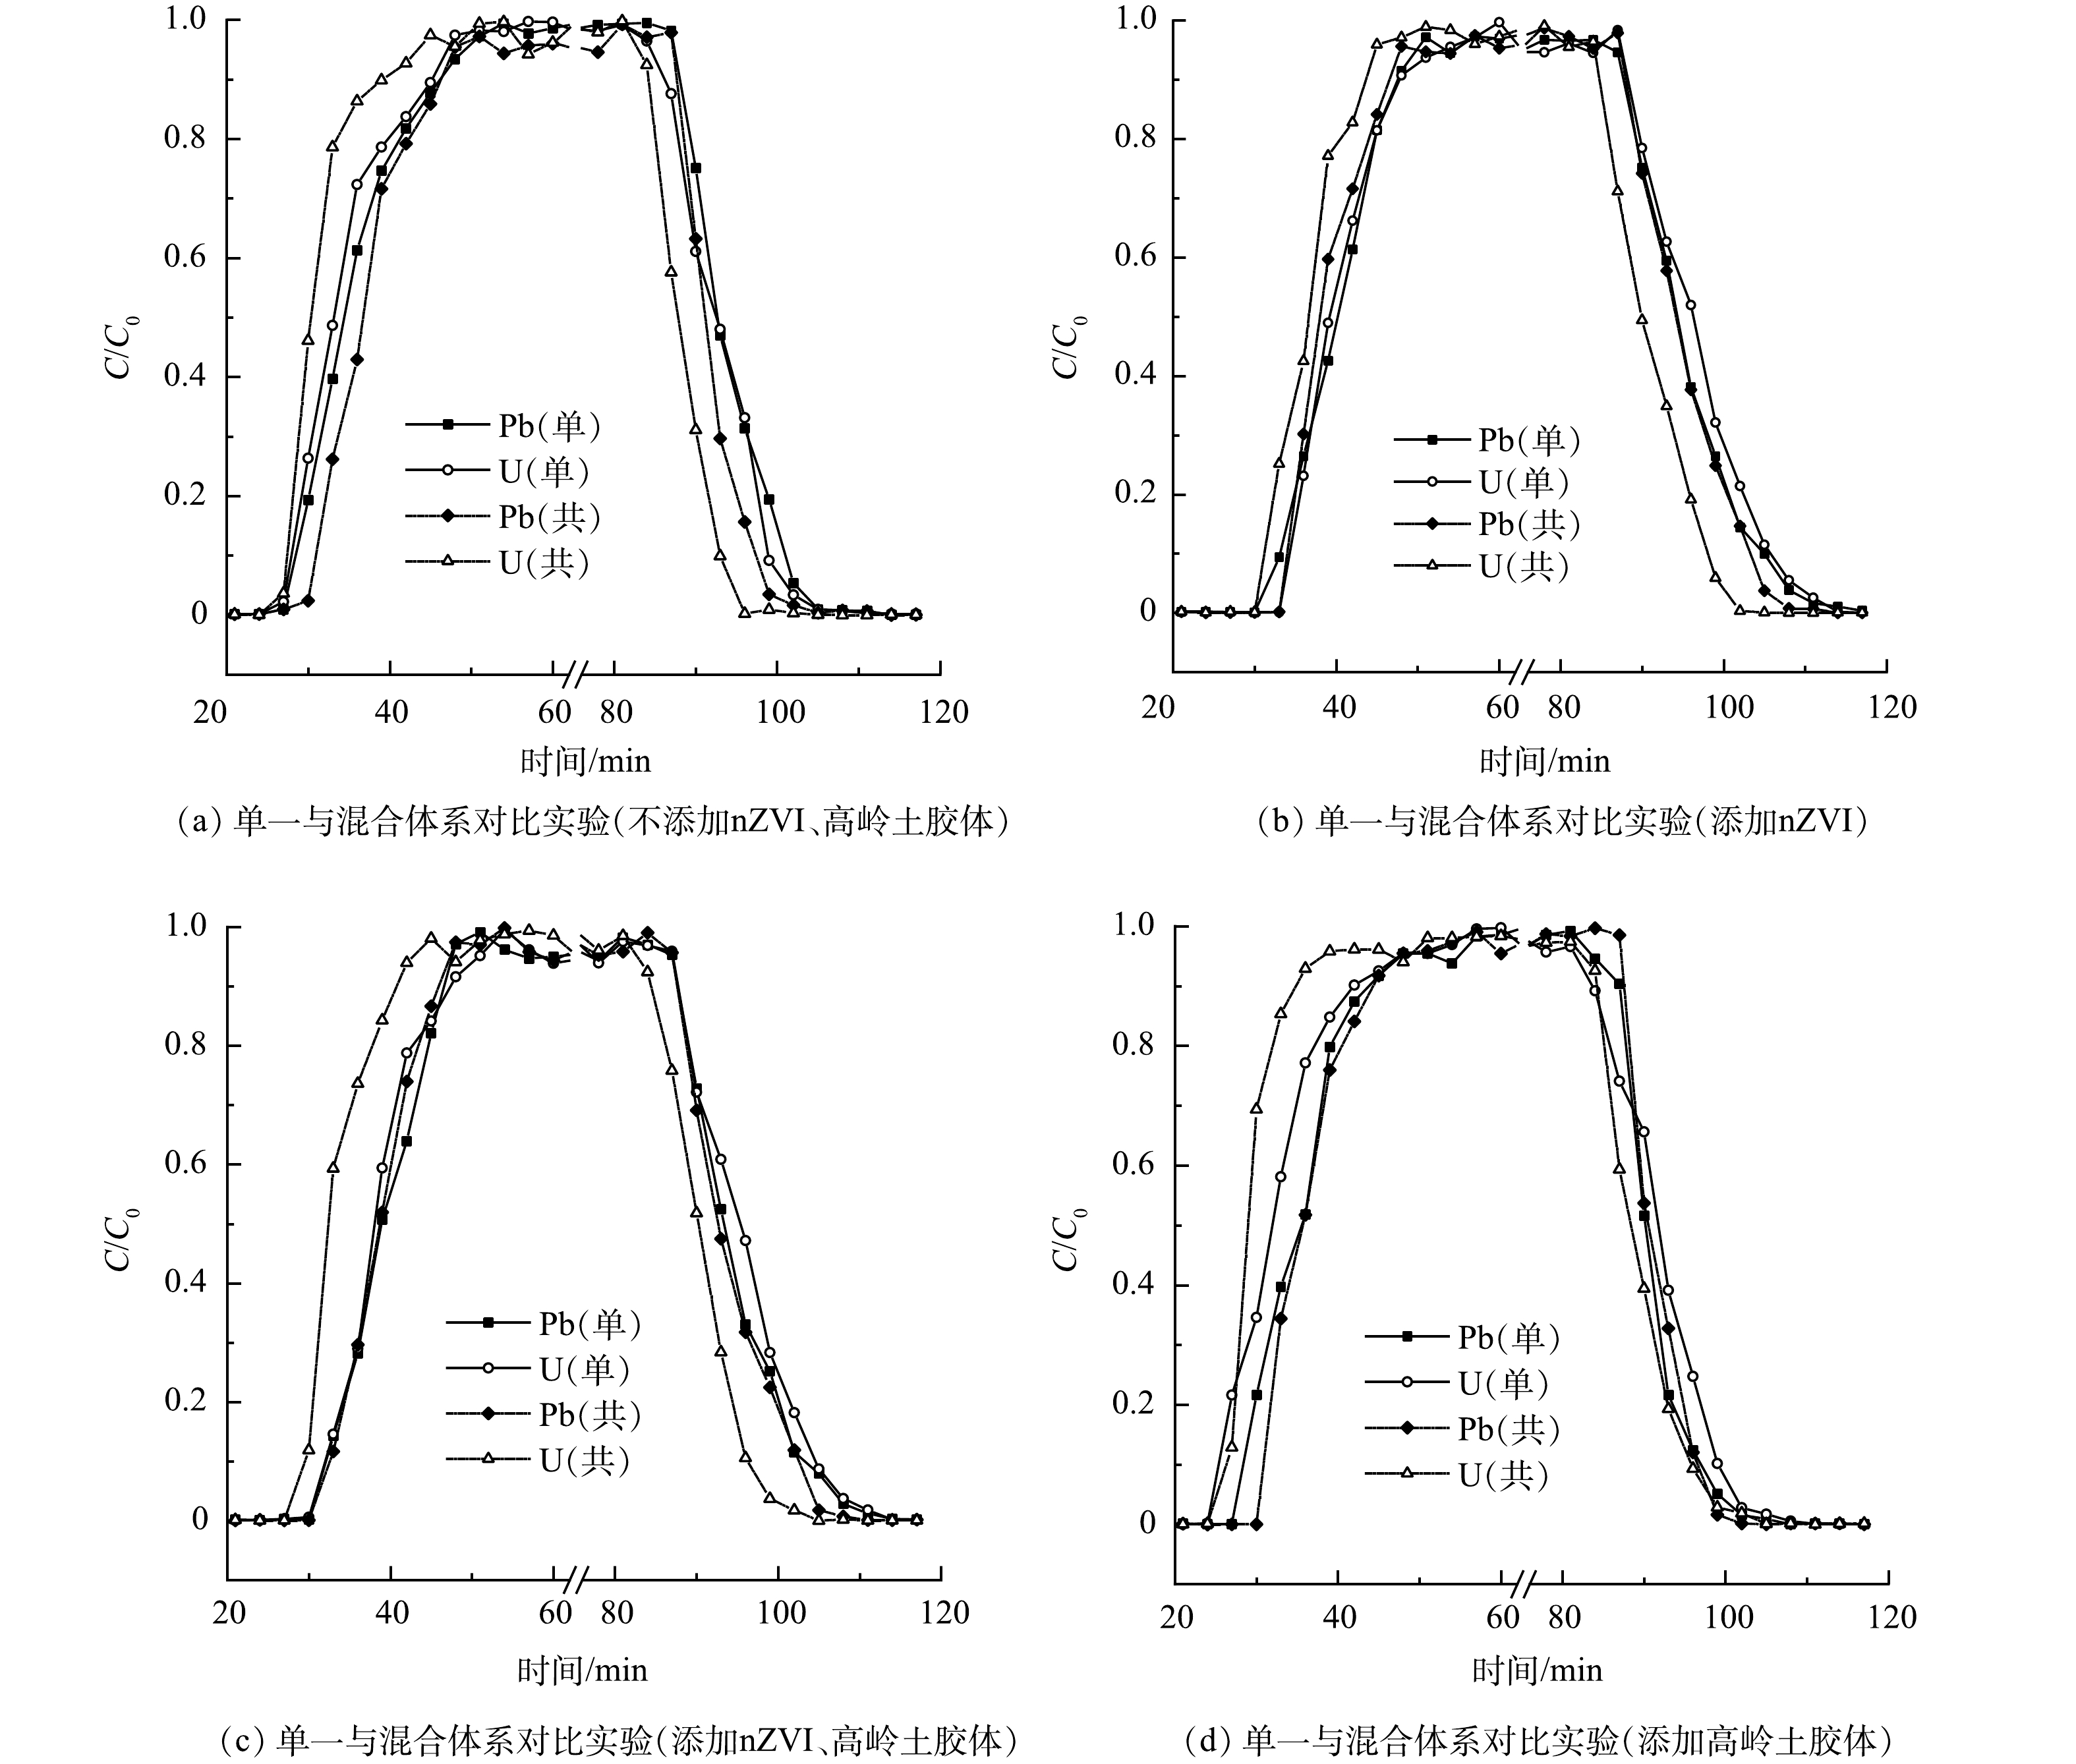
图 8 单一与混合运移体系Pb、U质量浓度的穿透曲线
Figure 8. Penetration curves of Pb and U mass concentrations in single and mixed migration system
-
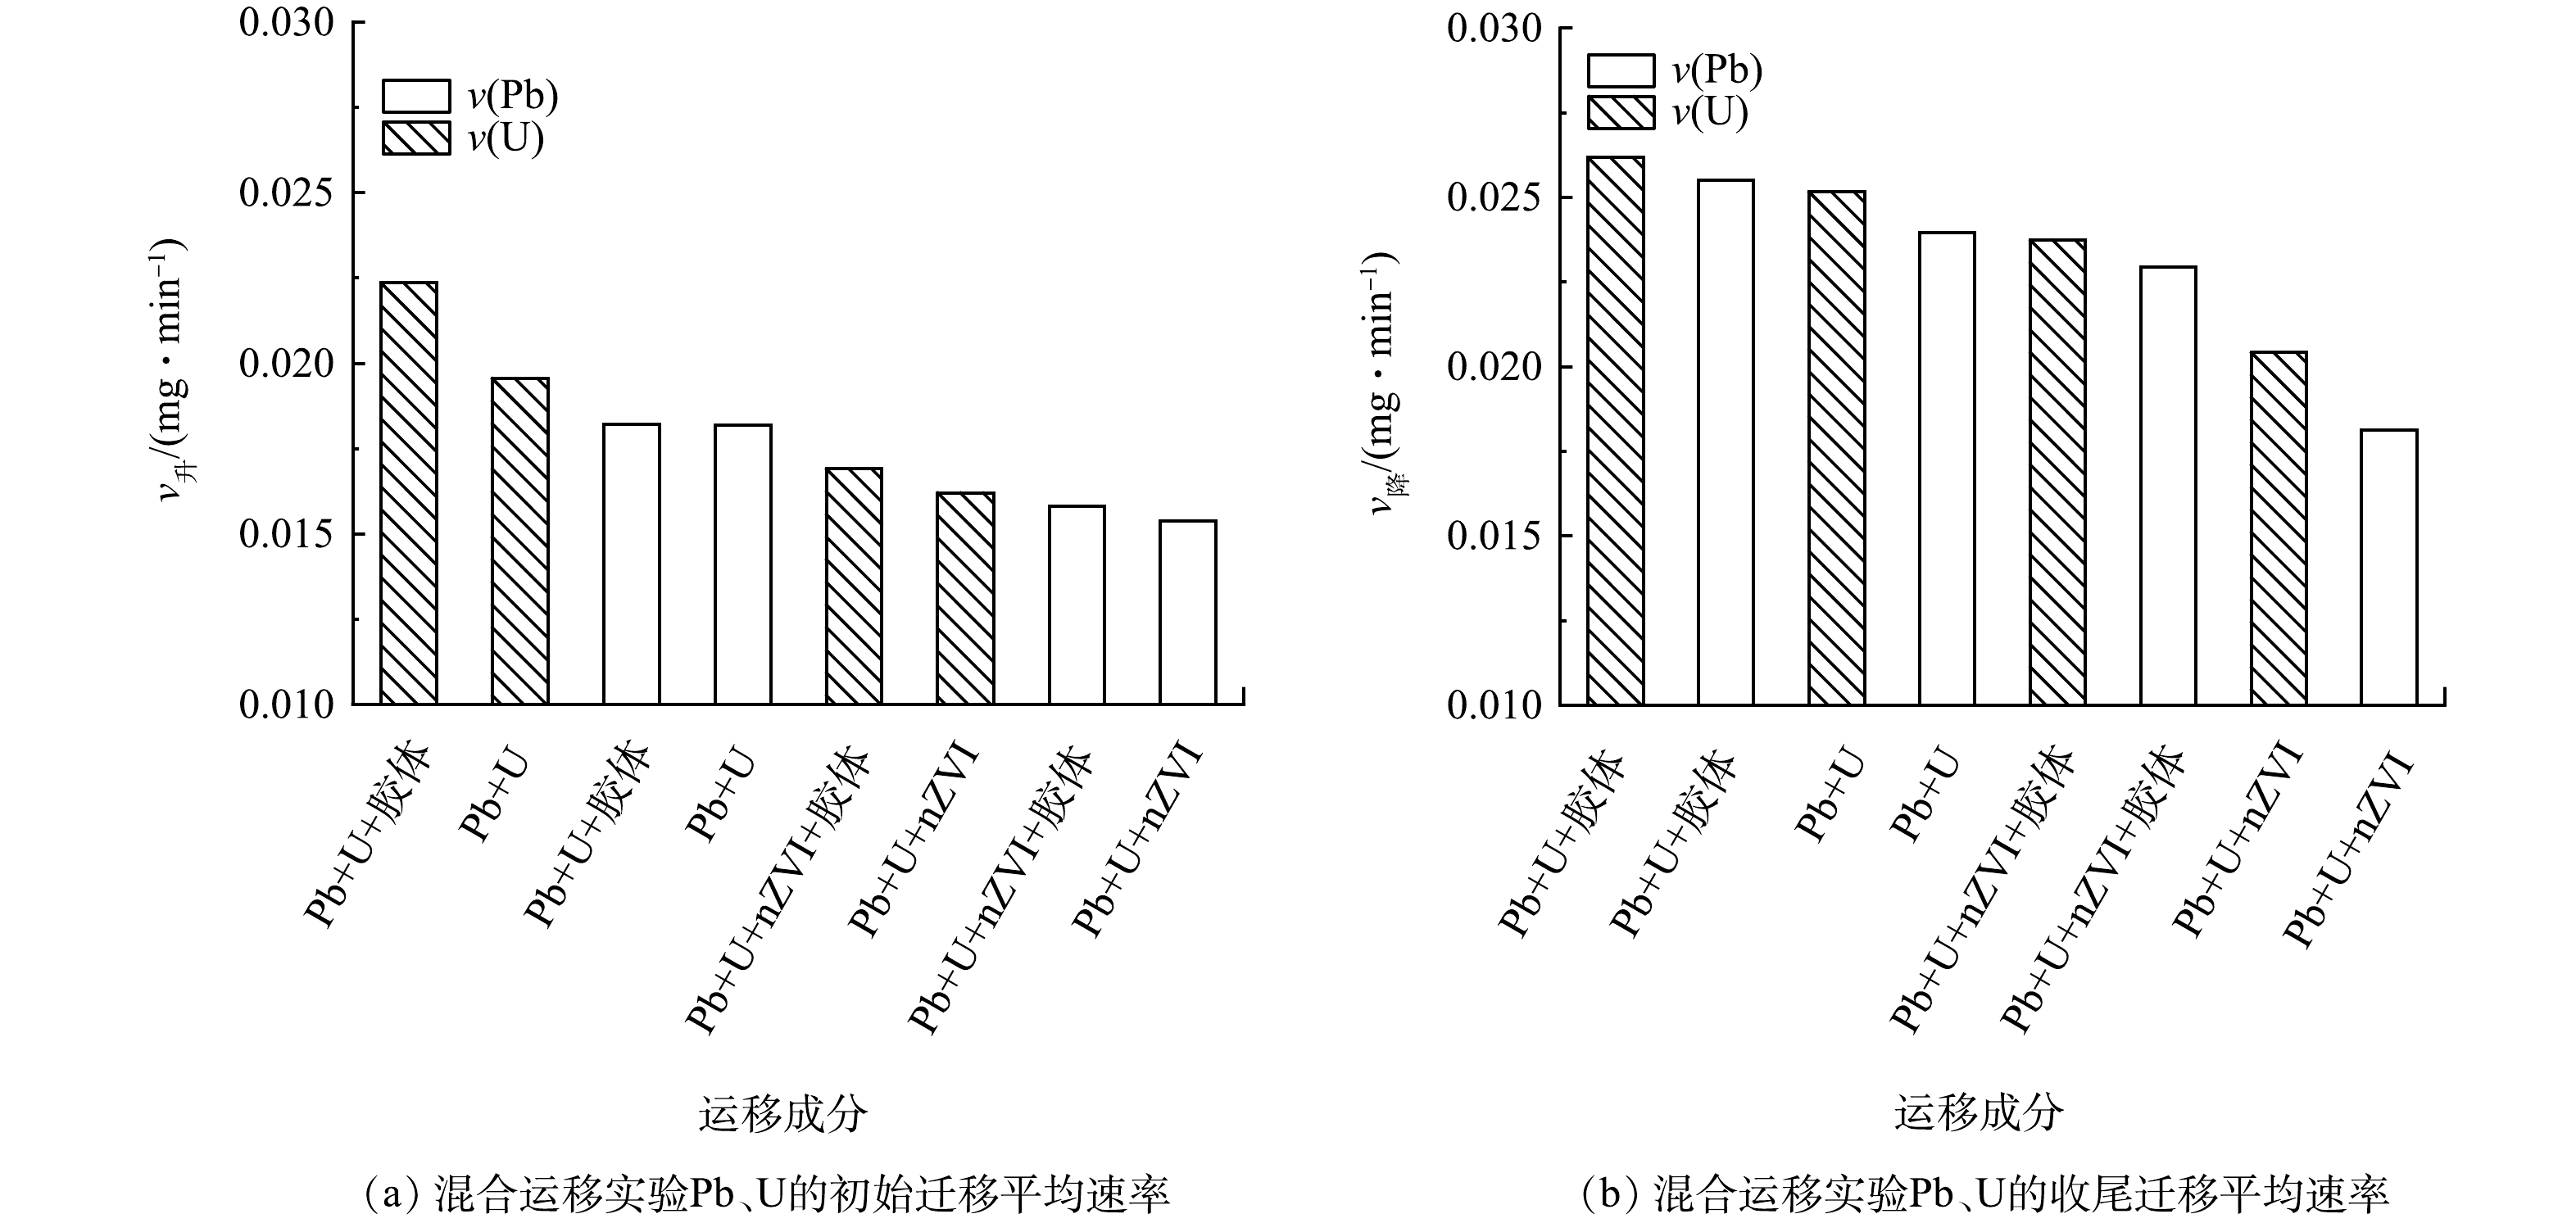
图 9 不同实验中初始及收尾阶段Pb、U的运移速率
Figure 9. The transport velocity of Pb, U in initial phase and close-out phase in different experiments
Figure
9 ,Table
1 个