-
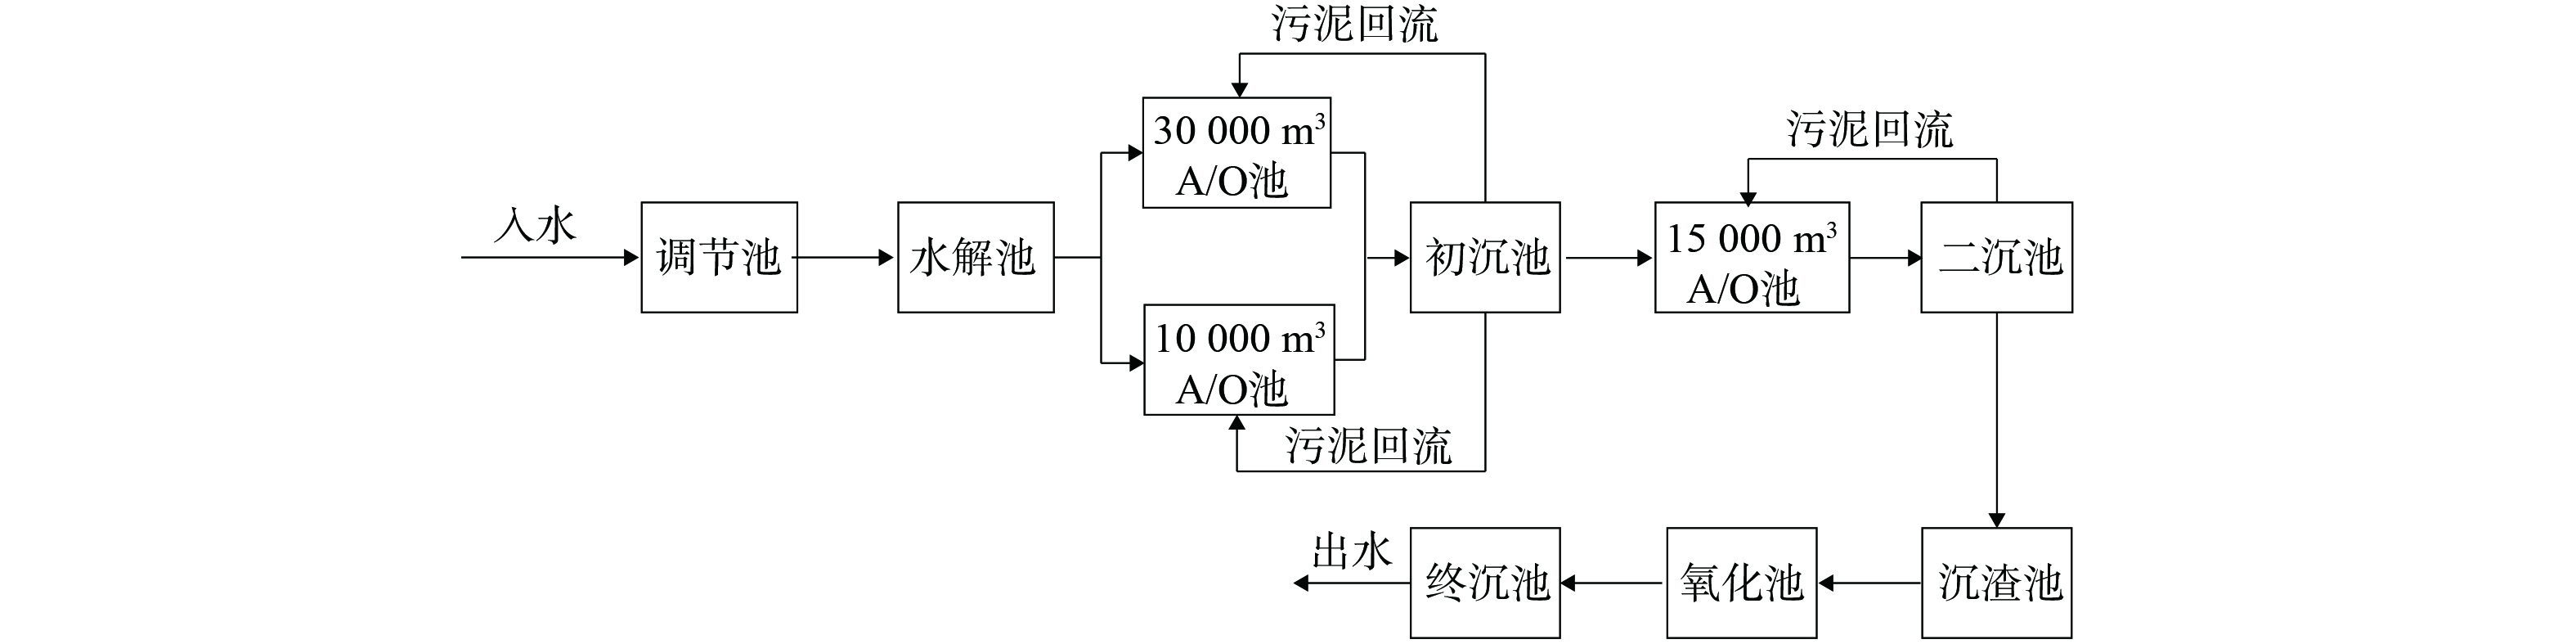
图 1 制药污水处理厂处理工艺流程图
Figure 1. Processing flowchart of pharmaceutical wastewater treatment plant
-
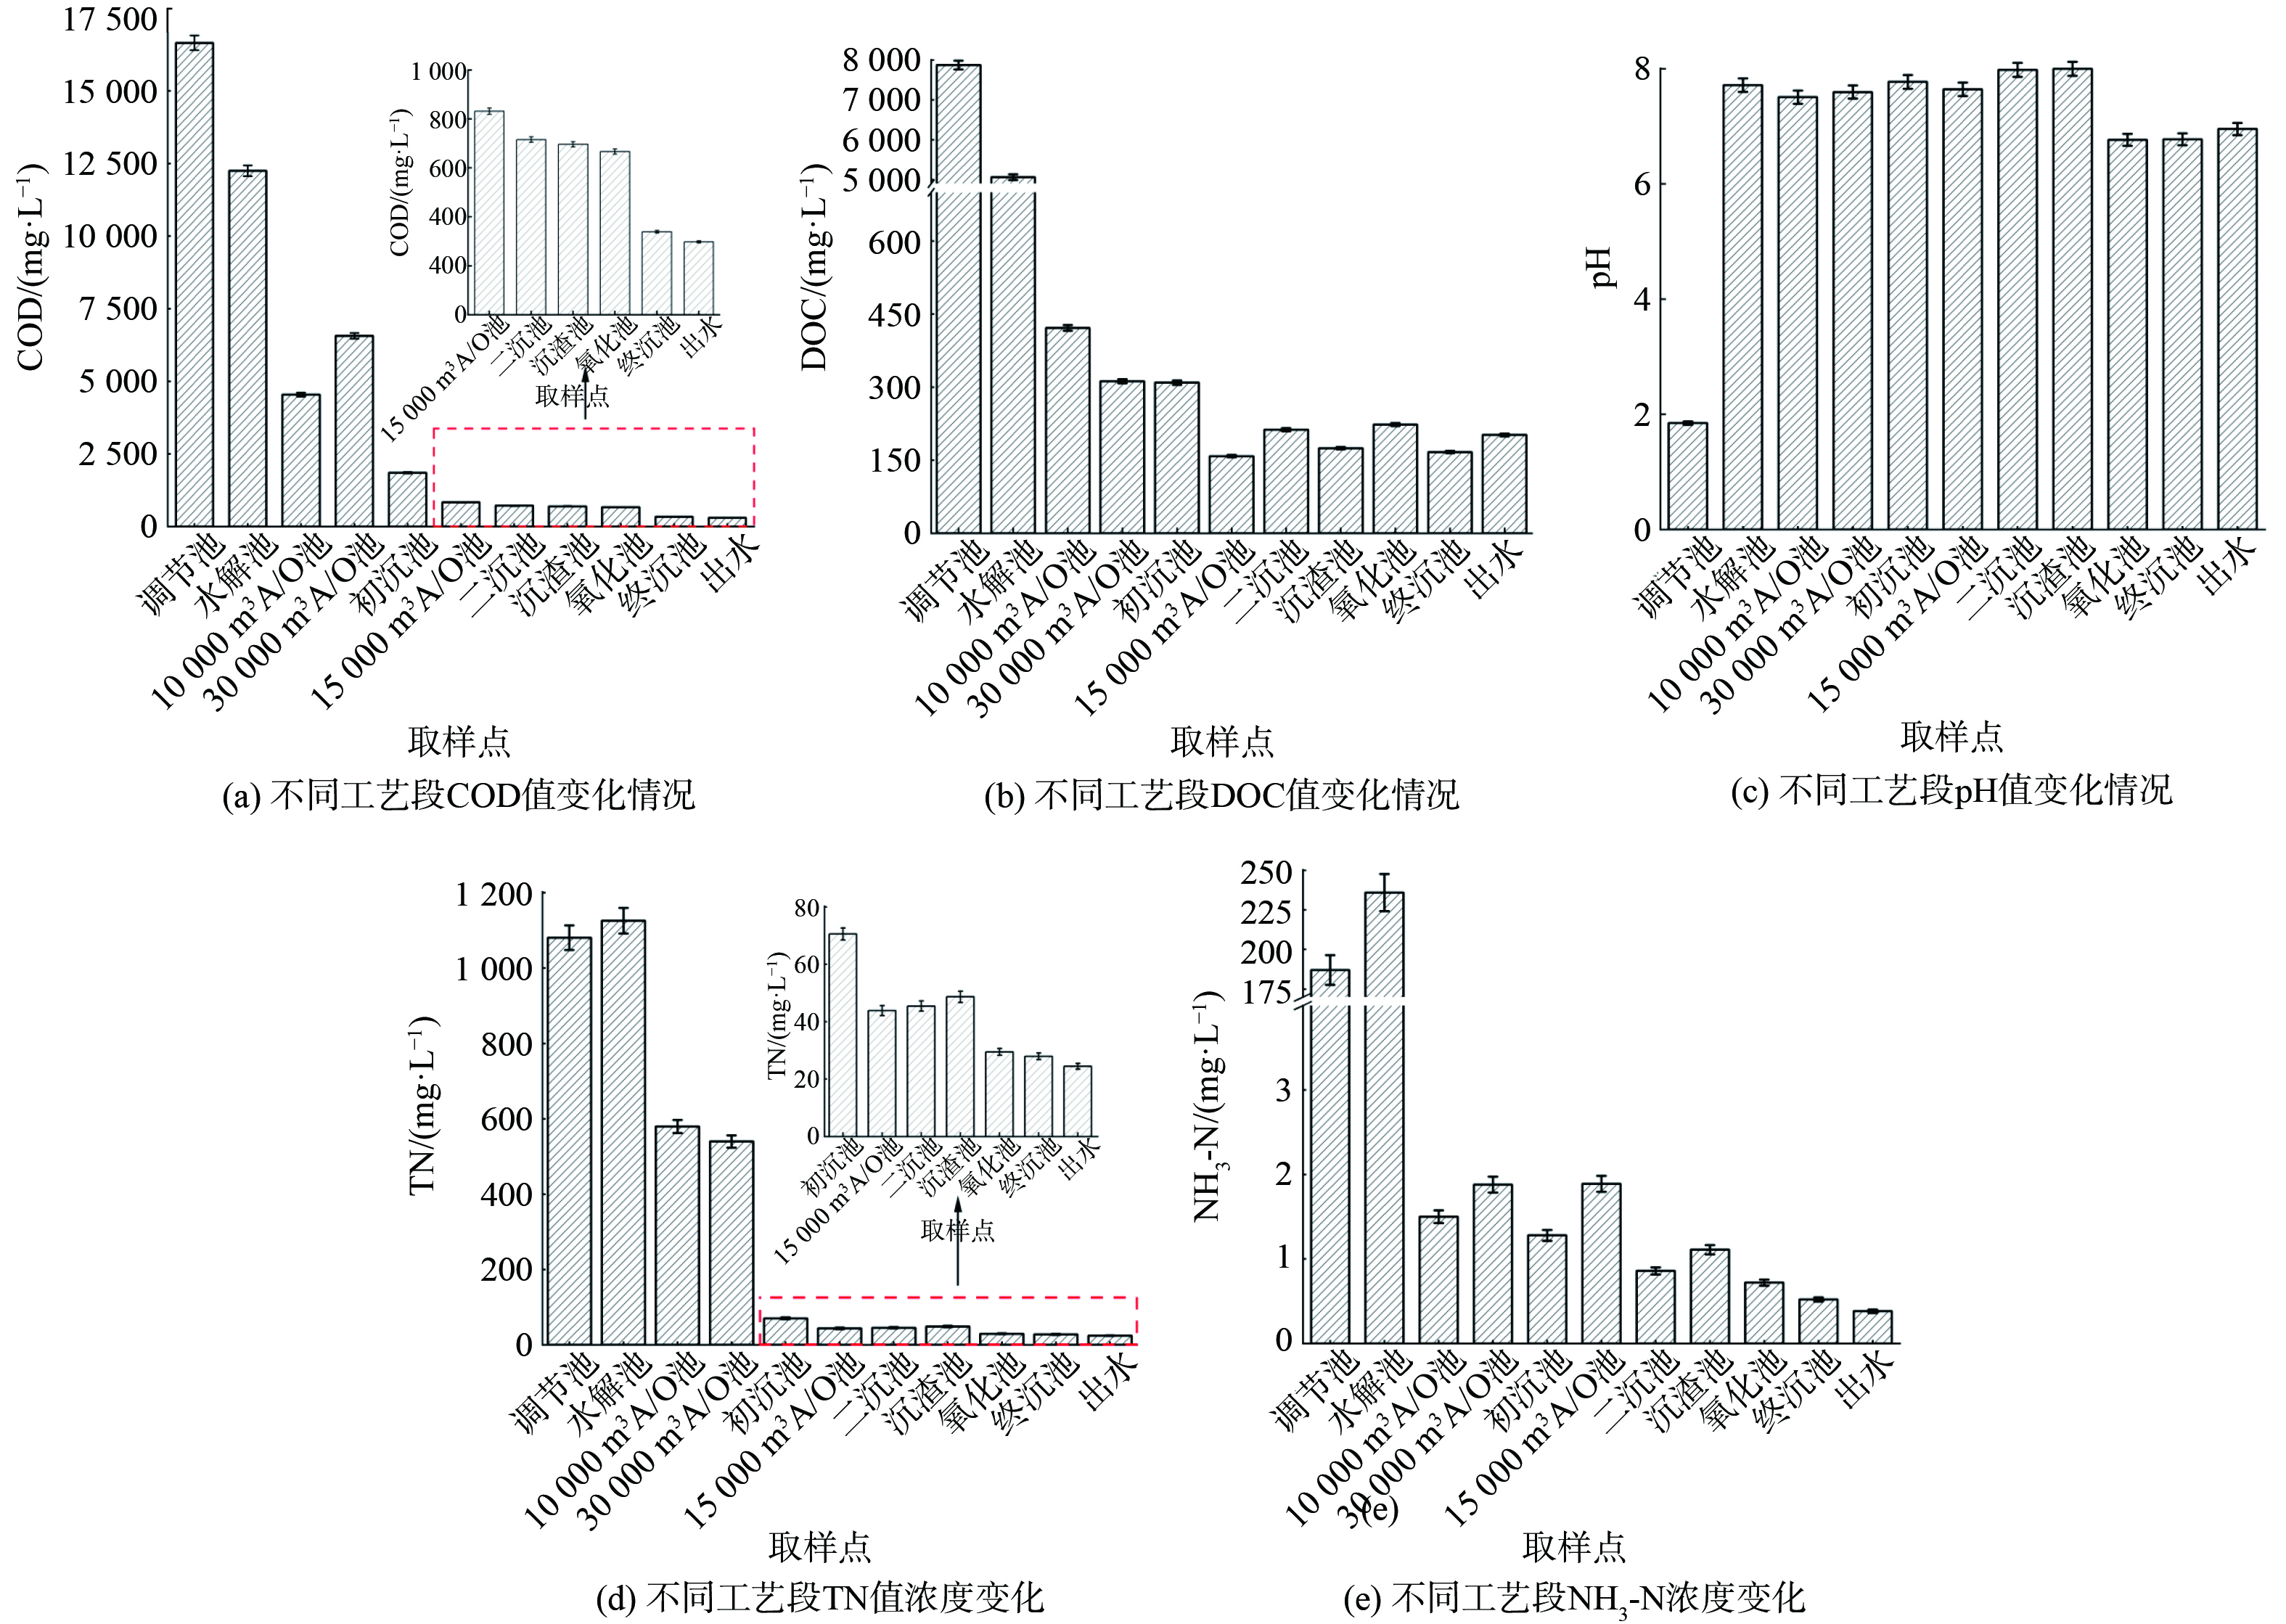
图 2 制药污水处理厂各处理流程水质指标
Figure 2. Water quality indicators of each treatment process in pharmaceutical wastewater treatment plant
-

图 3 处理流程水样三维荧光光谱
Figure 3. Three-dimensional fluorescence spectroscopy of water treatment samples
-
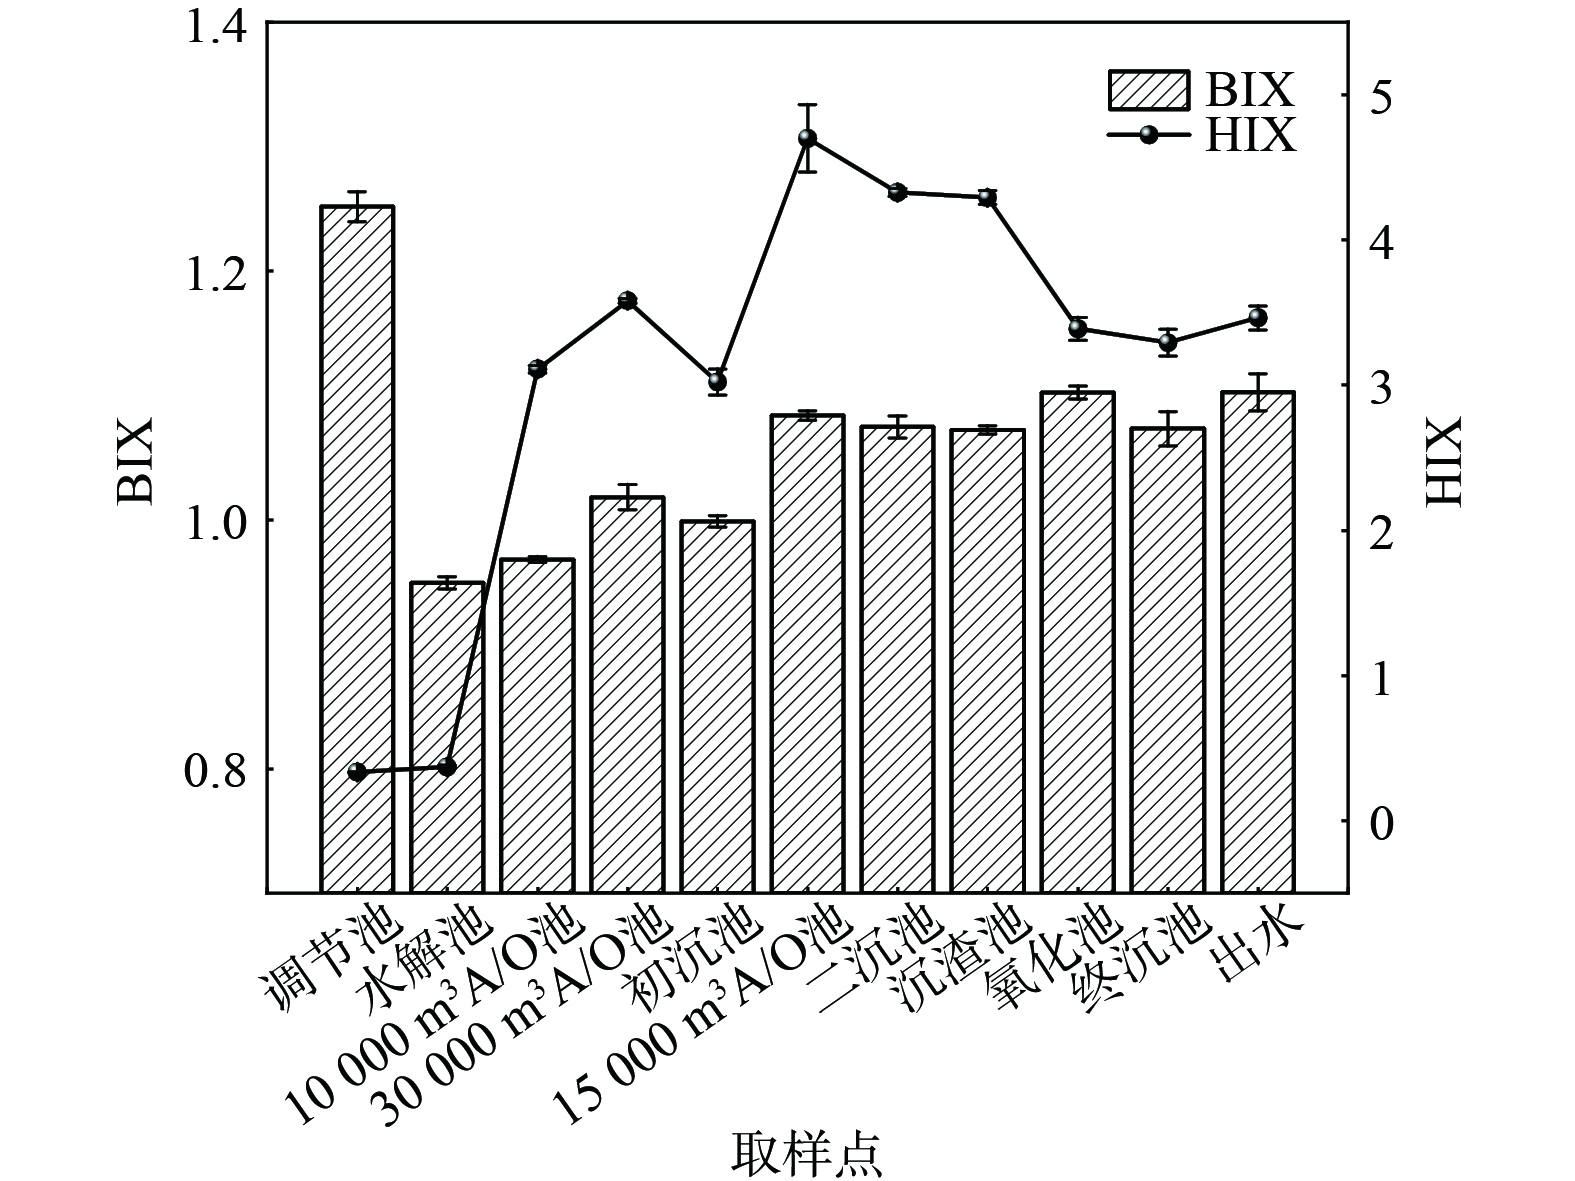
图 4 BIX和HIX指标变化情况
Figure 4. Change in BIX and HIX indicators
-
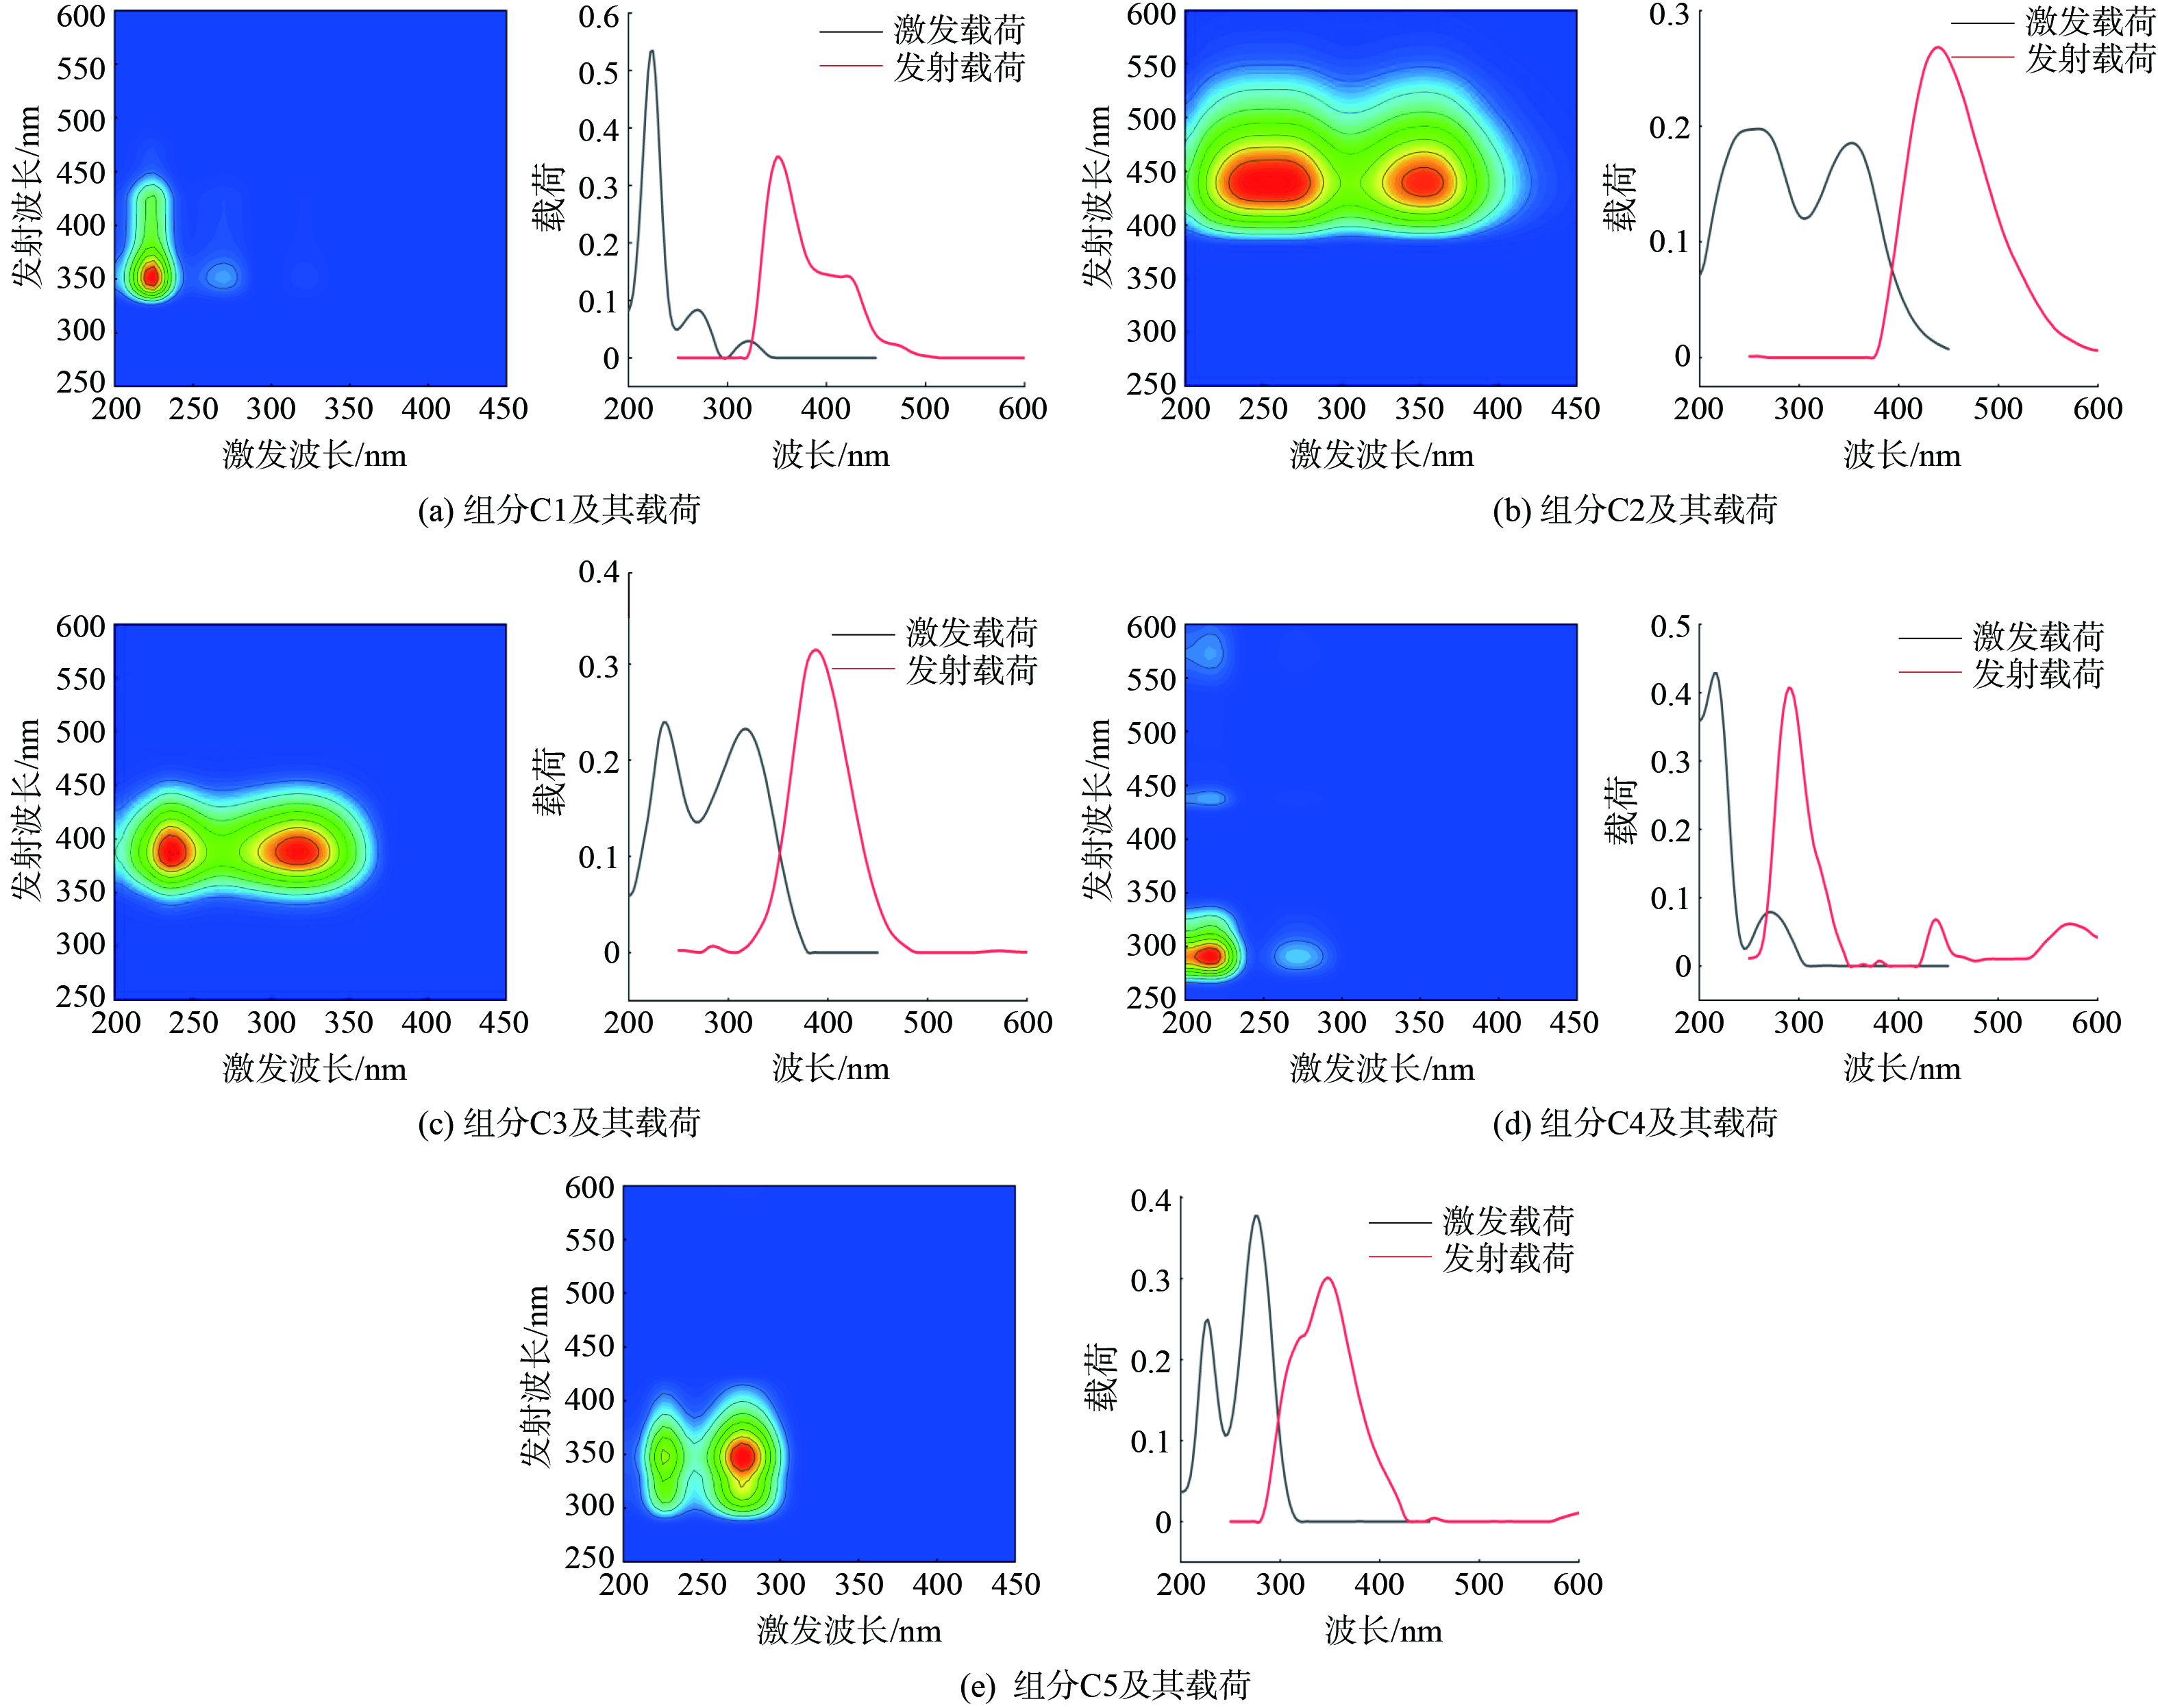
图 5 PARAFAC方法解析结果及其对应载荷
Figure 5. PARAFC method analysis results and its corresponding loadings
-
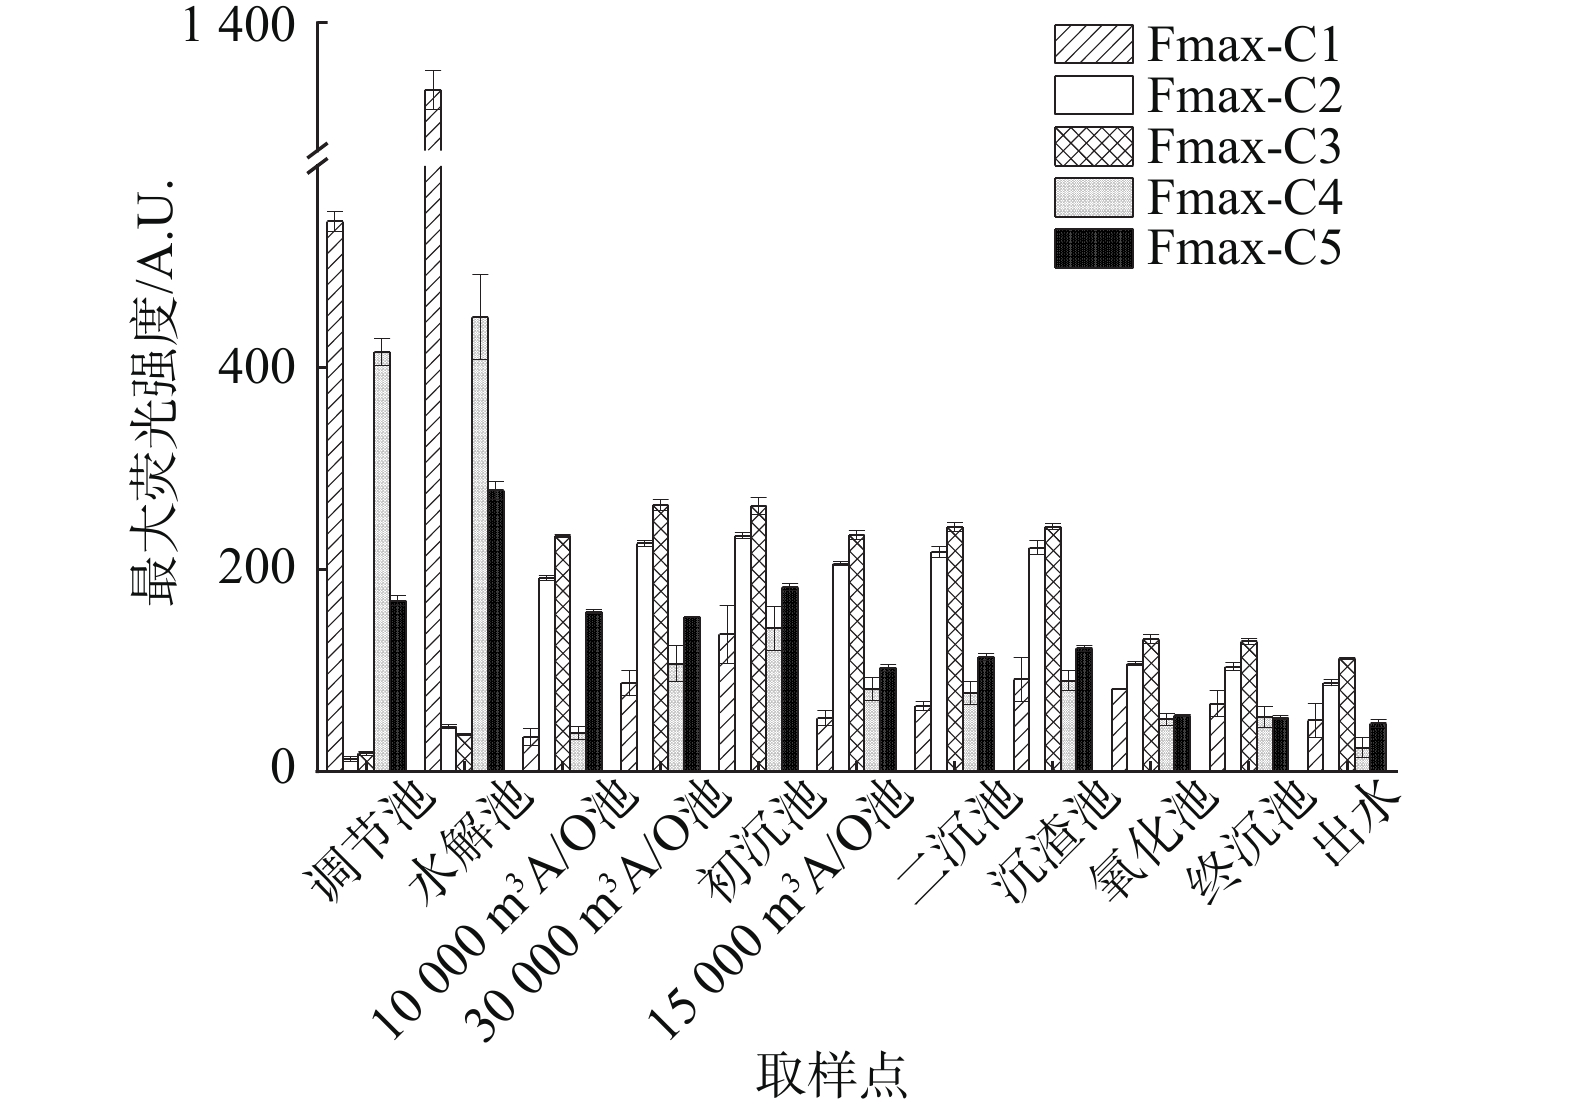
图 6 DOM不同组分Fmax值在不同工艺段变化情况
Figure 6. Fmax values of different DOM components in different process segments
-
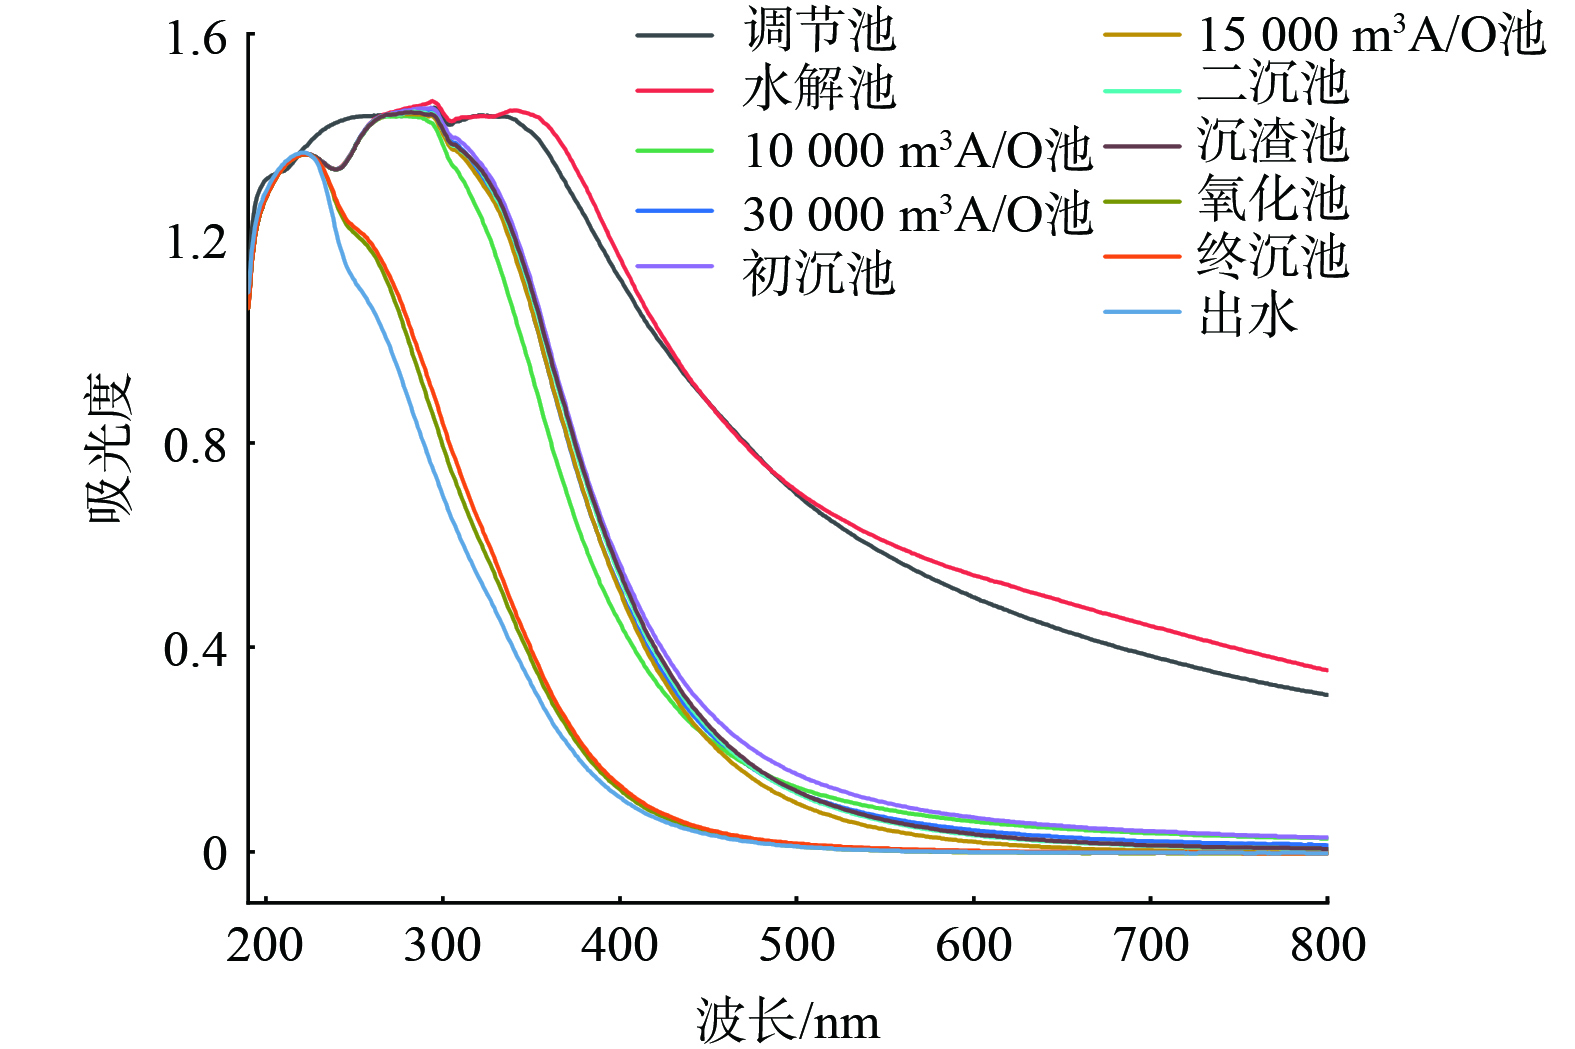
图 7 制药废水处理各工艺段水样紫外-可见光谱
Figure 7. UV-Vis spectra of water samples from different pharmaceutical wastewater treatment segments
-

图 8 不同工艺段SUVA254变化情况
Figure 8. Variating SUVA254 in different process segments
-

图 9 不同工艺段E2/E3和E3/E4比值变化情况
Figure 9. Varying of E2/E3 and E3/E4 ratios in different process segments
-

图 10 DOM组分及水质指标相关性分析
Figure 10. Correlating DOM constituents with water quality indicators
Figure
10 ,Table
1 个