-
河流、湖泊等受到农业和水土流失等面源污染日趋严重,已受到研究者关注。由于分布式水文模型SWAT的精确度高且移植性好,已在面源污染分析及水文循环等研究中广泛应用[1-2]。SWAT模型空间数据库的精确度将直接影响模型模拟结果的精确度[3],为避免数据精确度导致的不确定性,将空间数据与实际情况更进一步吻合是提高模型精确度的关键。已有学者对优化DEM数据和土壤类型图的精度做过研究,SHEN等[4]通过优化初始GIS数据,重采样到新的网格,并以所有可能方式对可用的GIS图进行分组,探究分辨率的阈值,基于此技术对大宁河流域SWAT模型进行了有效优化。李润奎等[5]探究不同土壤数据对SWAT模型模拟的影响,发现输入高分辨数字土壤数据 (SoLIM) 和美国传统土壤数据 (SSURGO) 这两种不同类型的土壤数据,对SWAT模型模拟的产水结果在空间上具有显著的差异。马永明等[6]通过AW3D30 DSM、SRTM1 DEM和ASTER GDEM2数字高程模型作为基本的地形数据,评价不同DEM数据对SWAT模型精确度的影响。但对于土地利用数据,学者通常使用主要的土地利用/覆被类型 (耕地、林地、草地等) 作为输入数据[7-9],通过设置不同土地利用情景等方式对模型模拟及验证,而农作物种植结构空间分布的差异对水土流失及面源污染负荷量具有较大的影响[10],进一步将会影响模型模拟的精确度。故通过高分辨率基于种植结构的土地利用数据作为空间数据,将会较大程度的提高SWAT模型的模拟效果,并且对研究区域面源污染分析及综合治理提供更加有效的指导。
乌梁素海流域位于干旱-半干旱季风气候区,长期以来由于以农药和化肥的施用来增加粮食产量,加之流域畜禽养殖规模的不断扩大,使得流域农业面源污染问题日益严重,直接影响乌梁素海湖泊水质及流域农业的可持续发展[11-13]。本研究拟通过遥感高精度影像、无人机航拍照片和大量地面实测数据,对2022年乌梁素海流域主要农作物 (小麦、玉米、葵花、瓜果类等) 的种植结构分布进行精准解析,进而通过SWAT模型构建以日为时间尺度的连续模拟,对流域径流、非点源污染负荷和营养物质的迁移转化进行定量模拟和时空分布分析,为乌梁素海流域面源污染治理提供参考,为进一步将其应用于水环境容量的计算,以及流域综合管理提供基础数据。
-
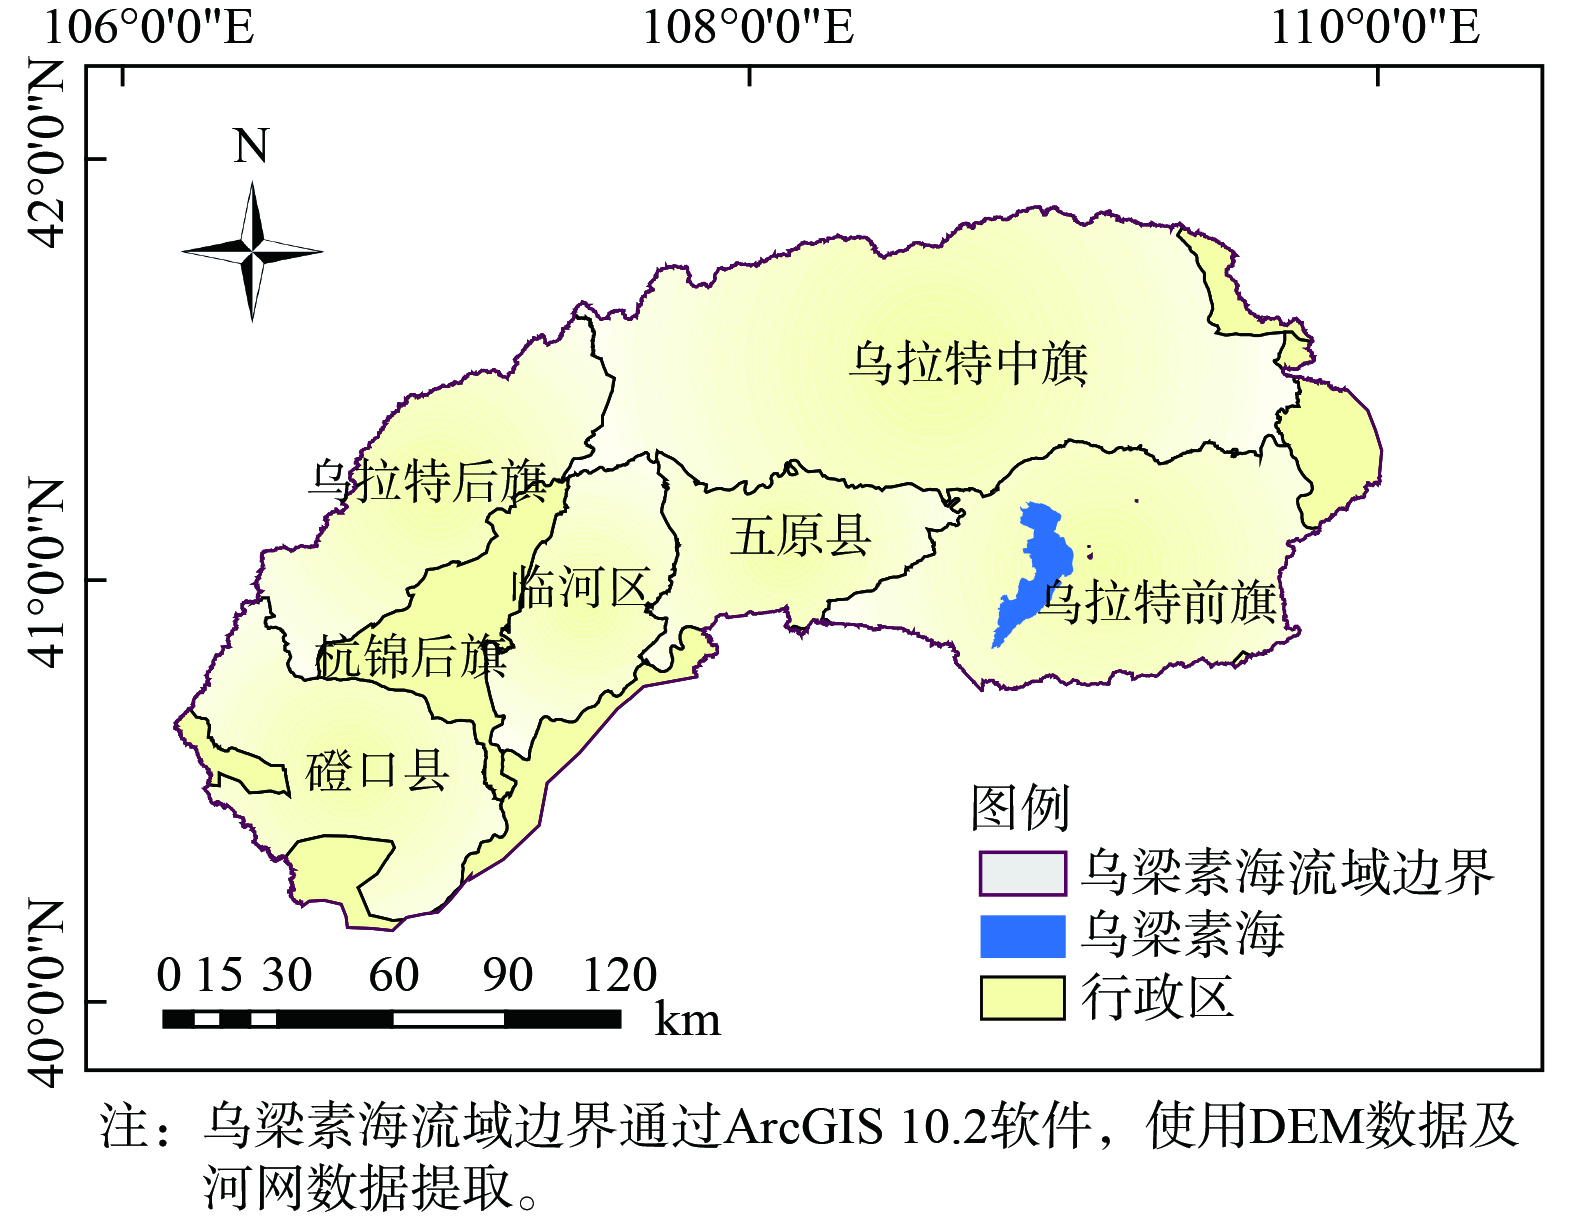
乌梁素海流域 (图1) 位于内蒙古自治区西北部巴彦淖尔市境内 (40°09′N~41°49′N,106°30′E~109°56′E) ,处于我国“两屏三带”重要的生态安全保障关键地区,承担着调节黄河水量,维持生态系统功能,以及调节气候等多种重要的作用[14]。流域平均海拔1 024 m,年平均气温7.7 ℃,年均降水量215 mm。该流域四季分明、春季短促、冬季漫长、昼夜温差大,冰封期有约5个月,受到蒙古高压的影响,地处西风带、风沙强烈,年平均蒸发量达到2 000 mm以上,属于典型的干旱-半干旱地区。乌梁素海流域腹地的河套灌区是我国北方重要的商品粮油生产基地,以种植小麦、玉米、葵花等作物为主,年产量高达3×10⁶ t[15]。流域每年由黄河补水约4.5×10⁸ m3。乌梁素海流域引黄的灌溉分为生育期灌溉和非生育期灌溉,生育期灌溉是用来满足作物生长对水分的需要,非生育期灌溉又分为春灌和秋浇。
-
构建SWAT模型时,需要乌梁素海流域的空间数据库和属性数据库,空间数据库包括栅格数据 (Grid)和矢量数据 (Shapefile)。栅格数据包括乌梁素海流域分辨率为30 m的数字高程地形图 (DEM),以及乌梁素海流域1∶106土壤类型图。矢量数据包括水系矢量图和乌梁素海流域1∶105土地利用图。由于建模时使用的空间数据来源不同,坐标系存在差异,但在SWAT模型划分子流域和水文响应单元时,需要将所有的空间数据投影到相同的坐标系中,本研究将空间数据的地理坐标系统一为GCS_WGS_1984。
1) DEM数据。本研究使用的DEM数据来自地理空间数据云(www.gscloud.cn),分辨率为30 m×30 m的Grid格式的数据,DEM数据包括高程、坡度、坡长、坡向等参数,通过ArcGIS 10.2对DEM数据进行镶嵌、裁剪和填洼等得到乌梁素海流域的DEM和河网水系。
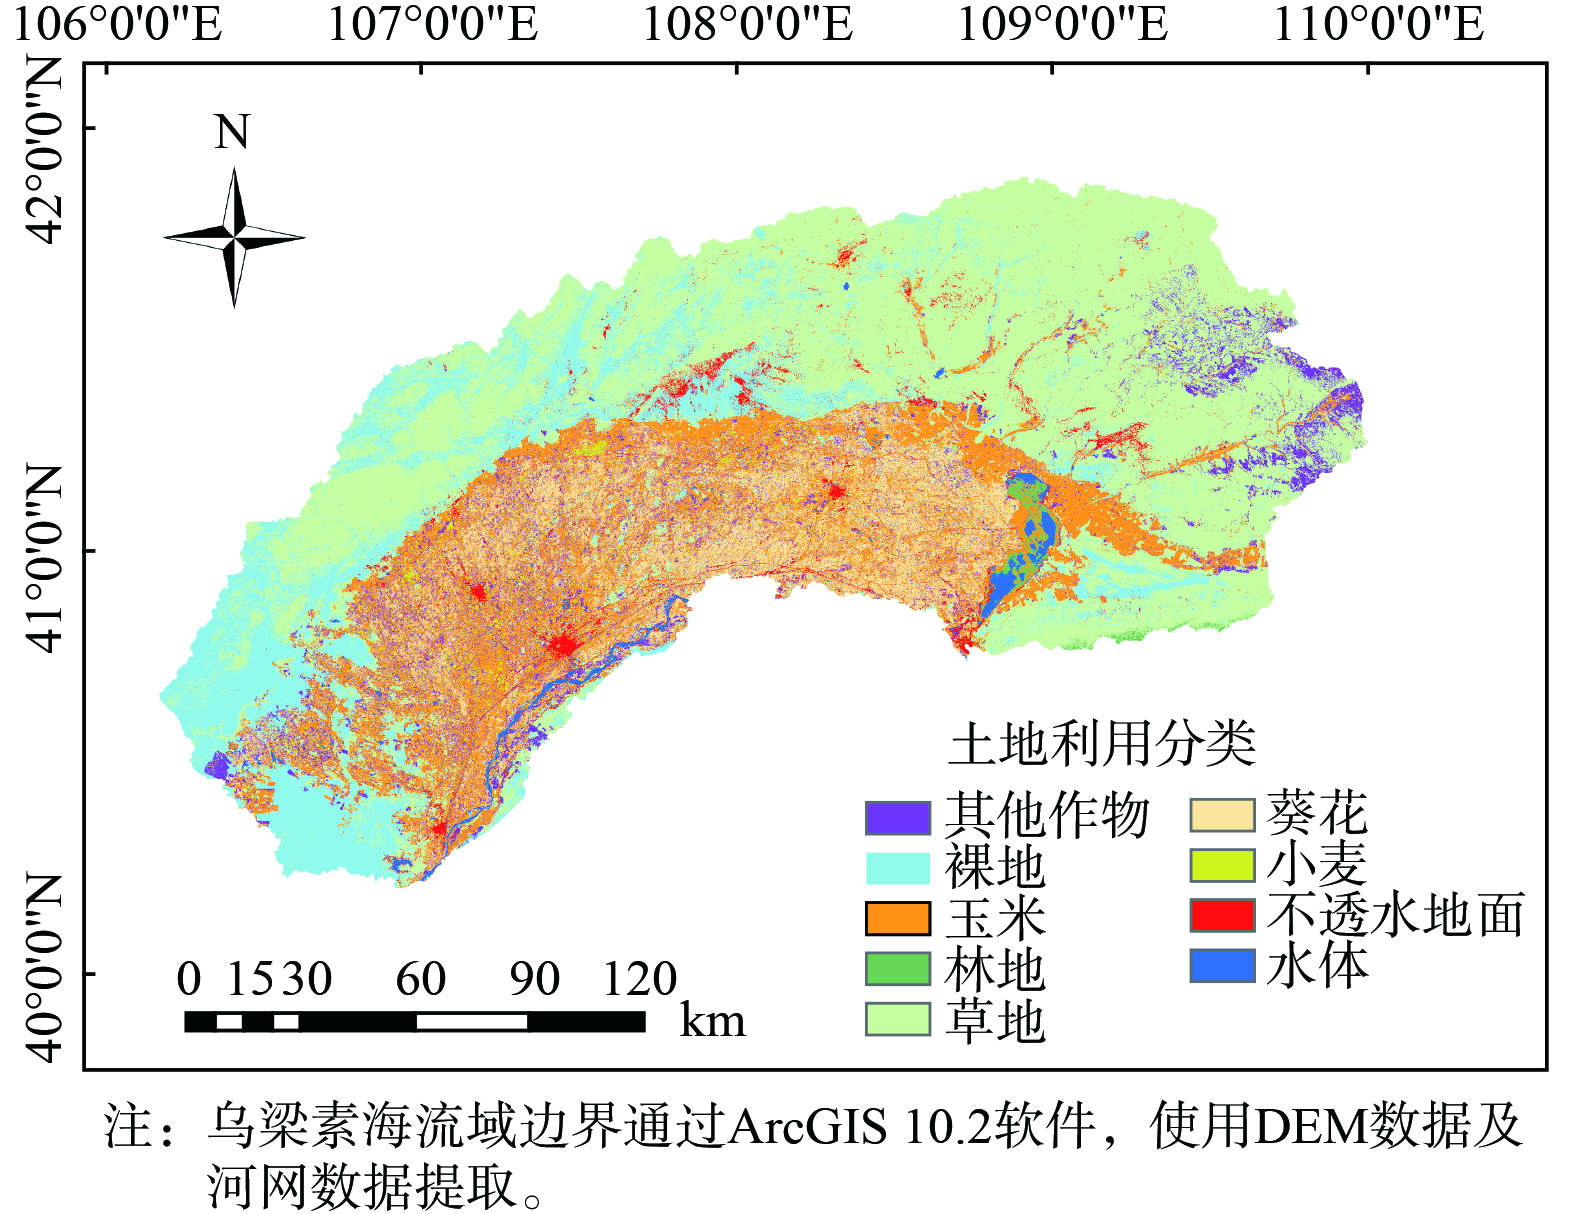
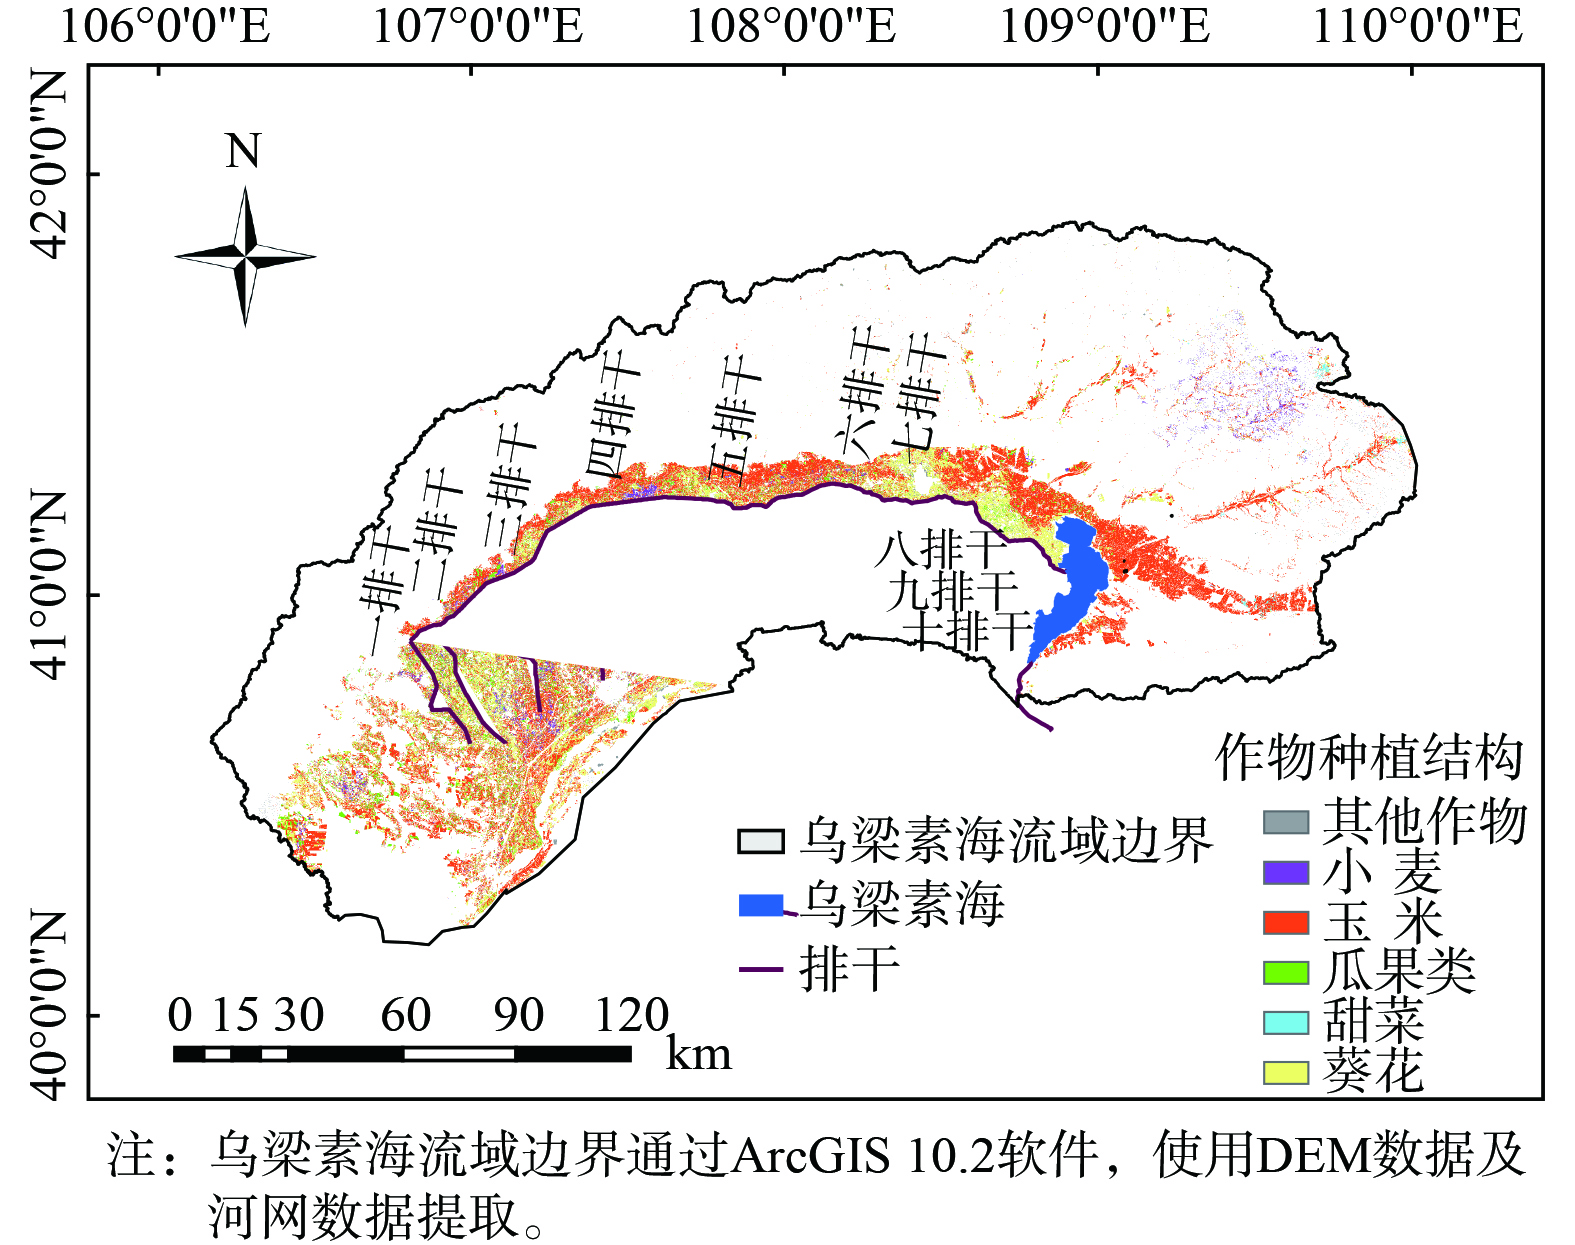
2) 土地利用数据。土地利用数据是SWAT建模中重要的数据之一,土地利用方式会直接影响流域地面的产流汇流,泥沙和营养物质的运输转移过程。本文所用林地、草地、不透水地面等基础土地利用数据来源于中国土地覆盖数据集 (China Land Cover Dataset,CLCD) ,乌梁素海流域的作物种植结构数据是2022年基于无人机高清晰照片及高分辨率遥感影像,通过解译得到。使用Arcgis10.2对CLCD的原始土地利用数据及解译出的种植结构数据,进行坐标系转换、裁剪、重采样、重分类等处理,融合后得到SWAT模型可识别的土地利用数据,分类结果见表1。其中,代码列为土地利用数据库中土地利用类型的英文缩写,土地利用类型检索表以*.txt格式存储。将土地利用类型图与SWAT模型中已有的土地利用类型联系起来,土地利用类型分布见图2。其他作物包括“马铃薯、水稻、油料作物等”。
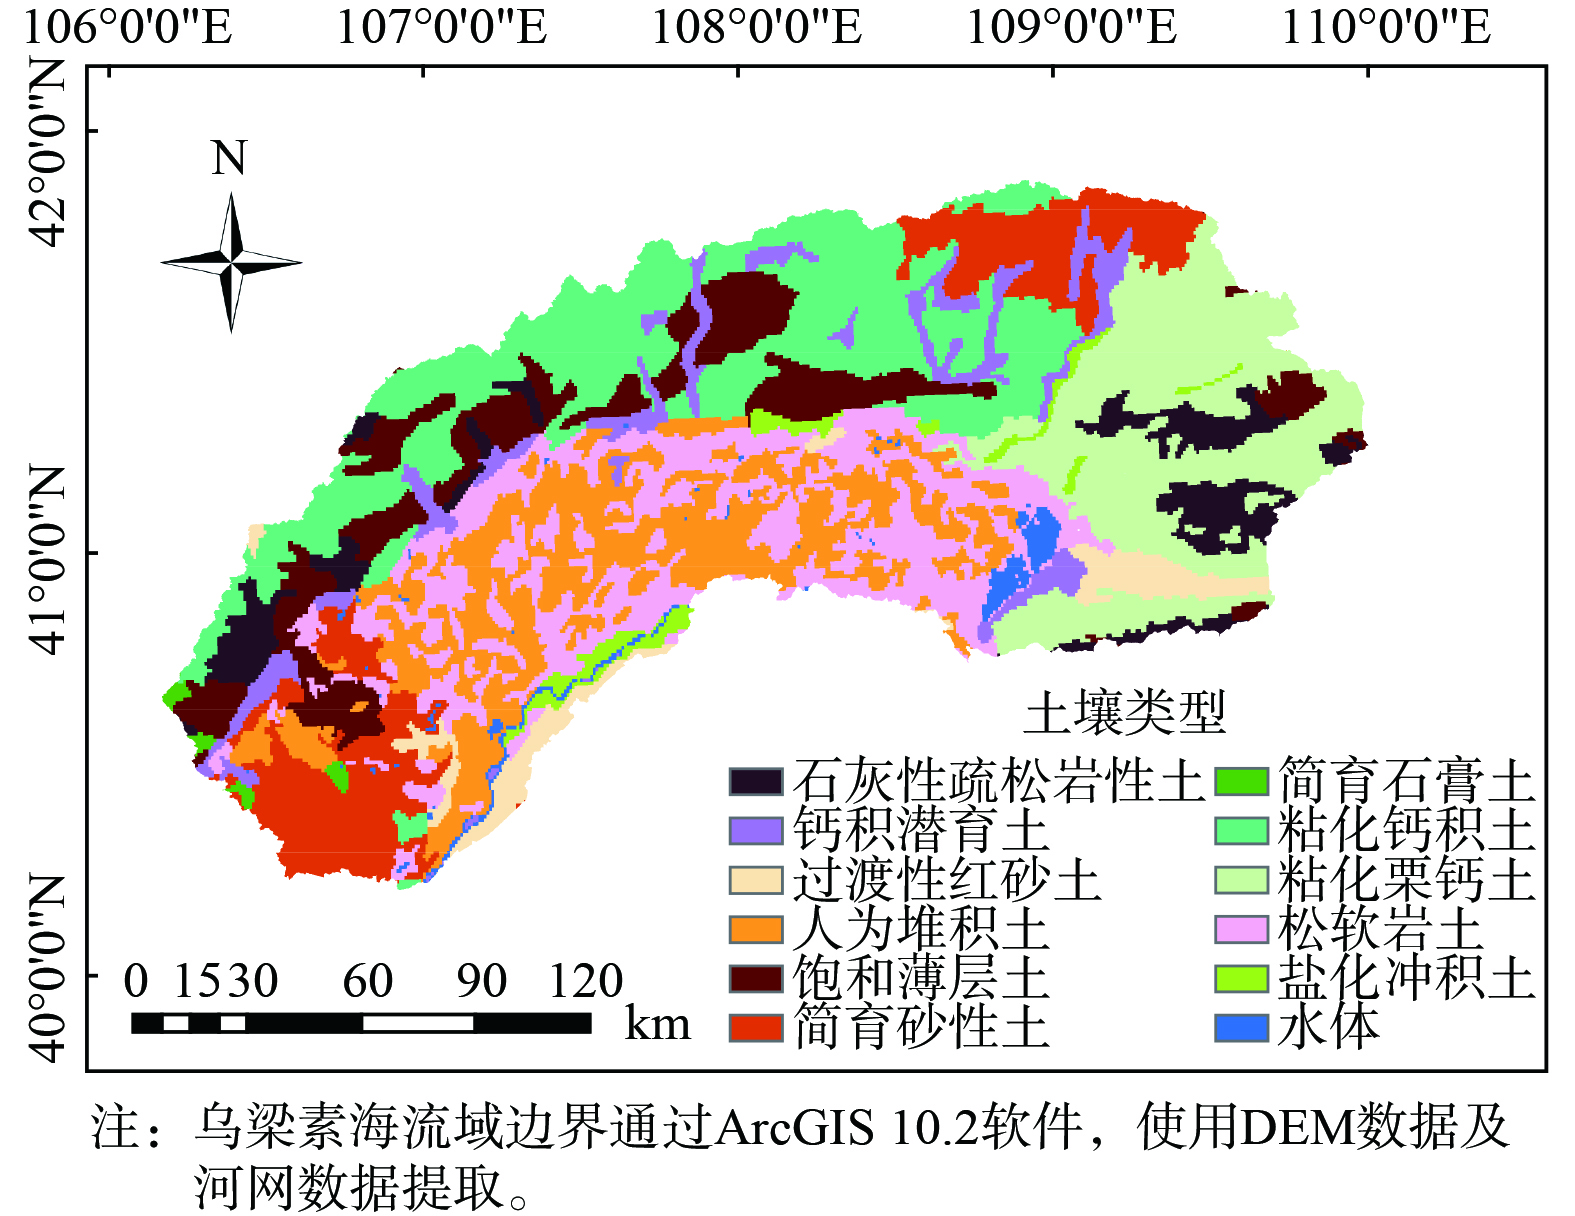
3) 土壤类型数据。土壤属性数据的质量直接影响SWAT模型的精确度,土壤参数包括:土壤物理性质、空间分布格局以及土壤数据索引表[16]。本研究的土壤数据来自世界土壤数据库 (Harmonized World Soil Database, HWSD),以计算壤中流和浅层地下水量。用Arcgis10.2对土壤类型数据进行坐标系转换、裁剪、重分类等处理,构建出完整的土壤类型数据的属性表,存为 Shape格式,土壤类型索引表为 *.txt格式存储,将土壤类型与SWAT模型中的usersoil文件的相应字段结合起来,土壤类型分布图见图3。
构建土壤类型数据库时,使用美国华盛顿州立大学开发的土壤水特性软件SPAW软件,计算SOL_K1、SOL_AWC1 和 TEXTURE 等土壤参数,再将结果输入 SWAT模型所建立的土壤数据库[17]。 土壤属性库包括土壤物理属性 (存储在usersoil.sol中) 和土壤化学属性 (存储在.chm中) 。土壤的物理属性数据是土壤水循环的重要参数,包括土壤名称、饱和导水率、土壤分层数和土壤有机碳含量等,其主要反映了土壤的侵蚀程度及变化规律,化学属性反映氮、磷的初始质量浓度,为模型附初始值使用。
4) 气象数据。本研究使用的气象数据来自巴彦淖尔市的7个国家气象站数据,包括五原、临河、磴口、乌拉特前旗、乌拉特中旗、乌拉特后旗和杭锦后旗气象观测站。气象数据主要包括2010—2020年日降水量、日最高/低温、风速和日辐射量等数据,主要用于计算径流量和蒸散发量。SWAT模型要求对每个站点的气象数据建立一个*.dbf索引表,但由于收集的气象资料中,有些点存在缺测而中断,缺失值在模型中用-99来表示。但长时间的缺测或中断,将会导致模型无法完成初始化运行,故需要使用天气发生器根据研究区气象站点的多年平均气象资料数据的特征,来模拟和估算各站点缺失的气象数据。气象数据将参数值输入到天气发生器 (WGEN_user) 中参与模型计算,相关站点信息见表2。
-
本研究通过SWAT-CUP (SWAT Calibration on Uncertainty Parameter) 对建模结果进行敏感度分析和模型率定,SWAT模型参数敏感性分析主要是通过调整参数的初始值或是参数的取值范围,使其模拟值接近于测量值,提高模型在研究区的适用性[18-19]。对SWAT模型参数敏感性分析是后续率定、校准和验证模型的前提,根据参数敏感性分析,结合各参数实际意义,对比实测值和模拟值调整参数取值范围。使用SUFI2 (Sequential Uncertainty Fitting Version 2) 对参数进行校准,选择对径流影响较大的10个参数,通过SWAT模型敏感性分析,迭代500次,筛选出对模拟结果较敏感的参数。参数的意义及模拟初始值的变化范围如表3所示。
通过决定系数 (R2) 和纳什效率系数 (NSE) 以评价和验证模型的适用性[20]。决定系数用来衡量均值的模拟效果,纳什系数可以衡量参数极值的模拟效果。R2和NSE取值范围均是0~1,其越接近1,拟合程度越好,反之则相关性越低。R2表示模拟值和实测值变化趋势是否一致,NSE 的表示模拟值与实测值的偏离程度。这两个指标通常需要同时对SWAT模型的适用性和精确度进行评价,不单独使用。R2和 NSE 的计算公式见式 (1)~(2) 。
式中:Q0和Qs 分别是观测值和模拟值,
$ {\bar Q_0} $ 和$ {\bar Q_{\text{s}}} $ 分别是观测值的平均值和模拟值的平均值,n是数据的个数。 -
Mann-Kendall趋势检验能够对比历年相同月份或季节的气象水质数据资料分类,广泛应用于国内外气象水文数据趋势变化的研究。该方法适用于顺序变量和类型变量,设 (x1,x2,...,xn)为n个独立的时间序列样本数据,构造秩序列见式 (3) ,相关数据见式 (4) 。
秩序列S是第i时刻数值大于j时刻数值个数的累计数。在时间序列随机独立的假定下,定义统计量UFk见式 (5) 。其中,UF1=0,E(Sk)和var(Sk)分别是Sk的均值和方差,计算见式 (6) 。
UFk是标准的正态分布,检验数据在临界线内变动,则表明变化曲线趋势不明显。UFk若大于零,则序列呈上升趋势,反之呈下降趋势。当其超过临界线,则表明上升或下降趋势显著。进一步得到 Mann-Kendall 统计值 Z见式 (7) 。
接下来,对统计值Z进行Mann-Kendall趋势检验。首先使用双边检验,假设时间序列无趋势变化,在正态分布表中查到显著性水平下的临界检验值 Z1-α/2。当|Z|>Z1-α/2时,原假设被否定,这表明序列具有显著性变化趋势;当|Z|<Z1- α/2时,则原假设被接受,这表明无显著性变化趋势;|Z|在大于1.28、1.96 和 2.32 时,分别表示通过了置信度 0.90、0.95 和 0.99 的显著性检验。Z为正值表示序列呈上升趋势,Z为负值表示序列呈下降趋势,且Z的绝对值越大,表示变化趋势越显著。
-
分布式水文模型的特征之一是能根据输入的参数划分出流域边界和子流域。SWAT模型在空间的离散化方面,基于研究区的DEM数据和河网的矢量文件(*.shp),结合流域进出口的定义,调整子流域面积的阈值,通过SWAT模型的Watershed Delineat子程序,在水文单元的基础上进行子流域的划分[21]。结合反复的尝试和分析比较,将子流域面积划分阈值设置为200 km2,最终将乌梁素海流域划分为103个子流域,具体见图4。水文响应单元(hydrologic response unit,HRU)在是SWAT模型参与水文计算与模拟的最小单元,运用“HRU Analysis”子模块计算。每一个HRU根据坡度、土地利用类型和土壤分类的不同组合和分布作为初始值,将不同水文特征部分定义为不同的水文单元。每个水文单元包含影响水量计算结果的重要信息[22],共划分723个水文响应单元。
-
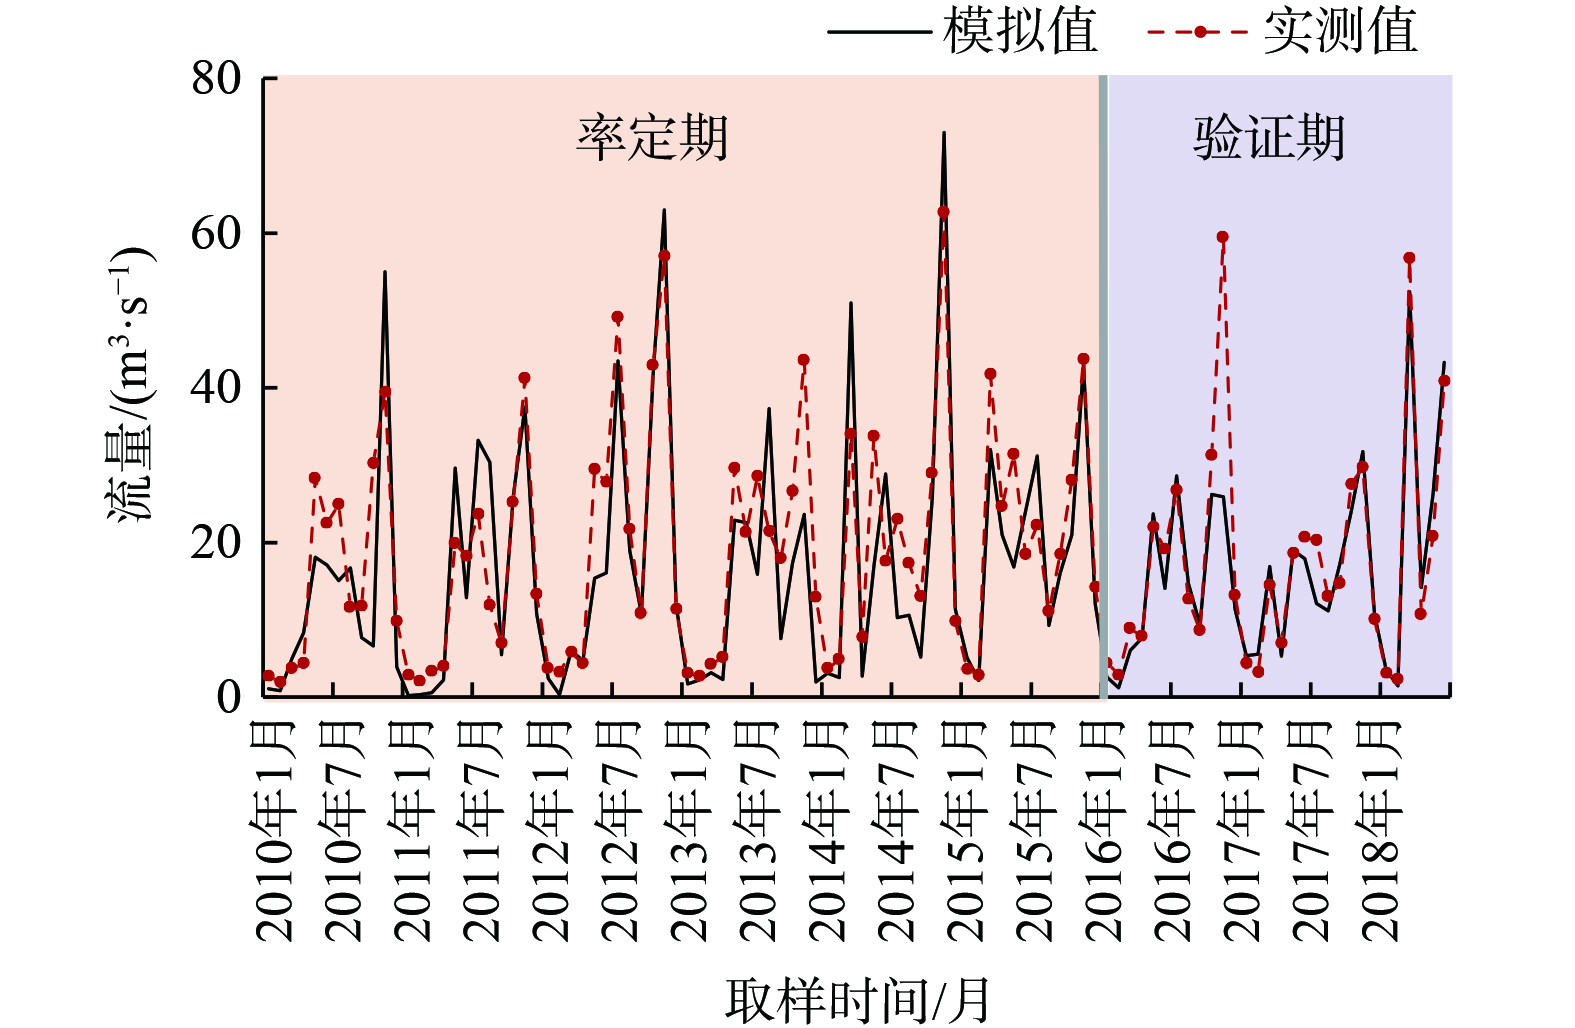
在率定的过程中,使用手动校准和自动校准相结合的方式进行。自动校准时,当径流满模拟值足R2 > 0.6,NSE > 0.5时结束,否则继续调整参数取值。通过红圪卜水文站所在53号子流域的水文监测数据,将2010 — 2015年作为模型率定期,2016—2018年作为模型验证期,对SWAT模型的模拟结果的精确度进行验证。率定期的 R2为0.74,NES为0.81;验证期的R2为0.78,NES为0.67。R2和NES均符合模型的拟合标准。图5为模型模拟效果,模型拟合效果良好,为后续进行污染物的模拟奠定基础。
-
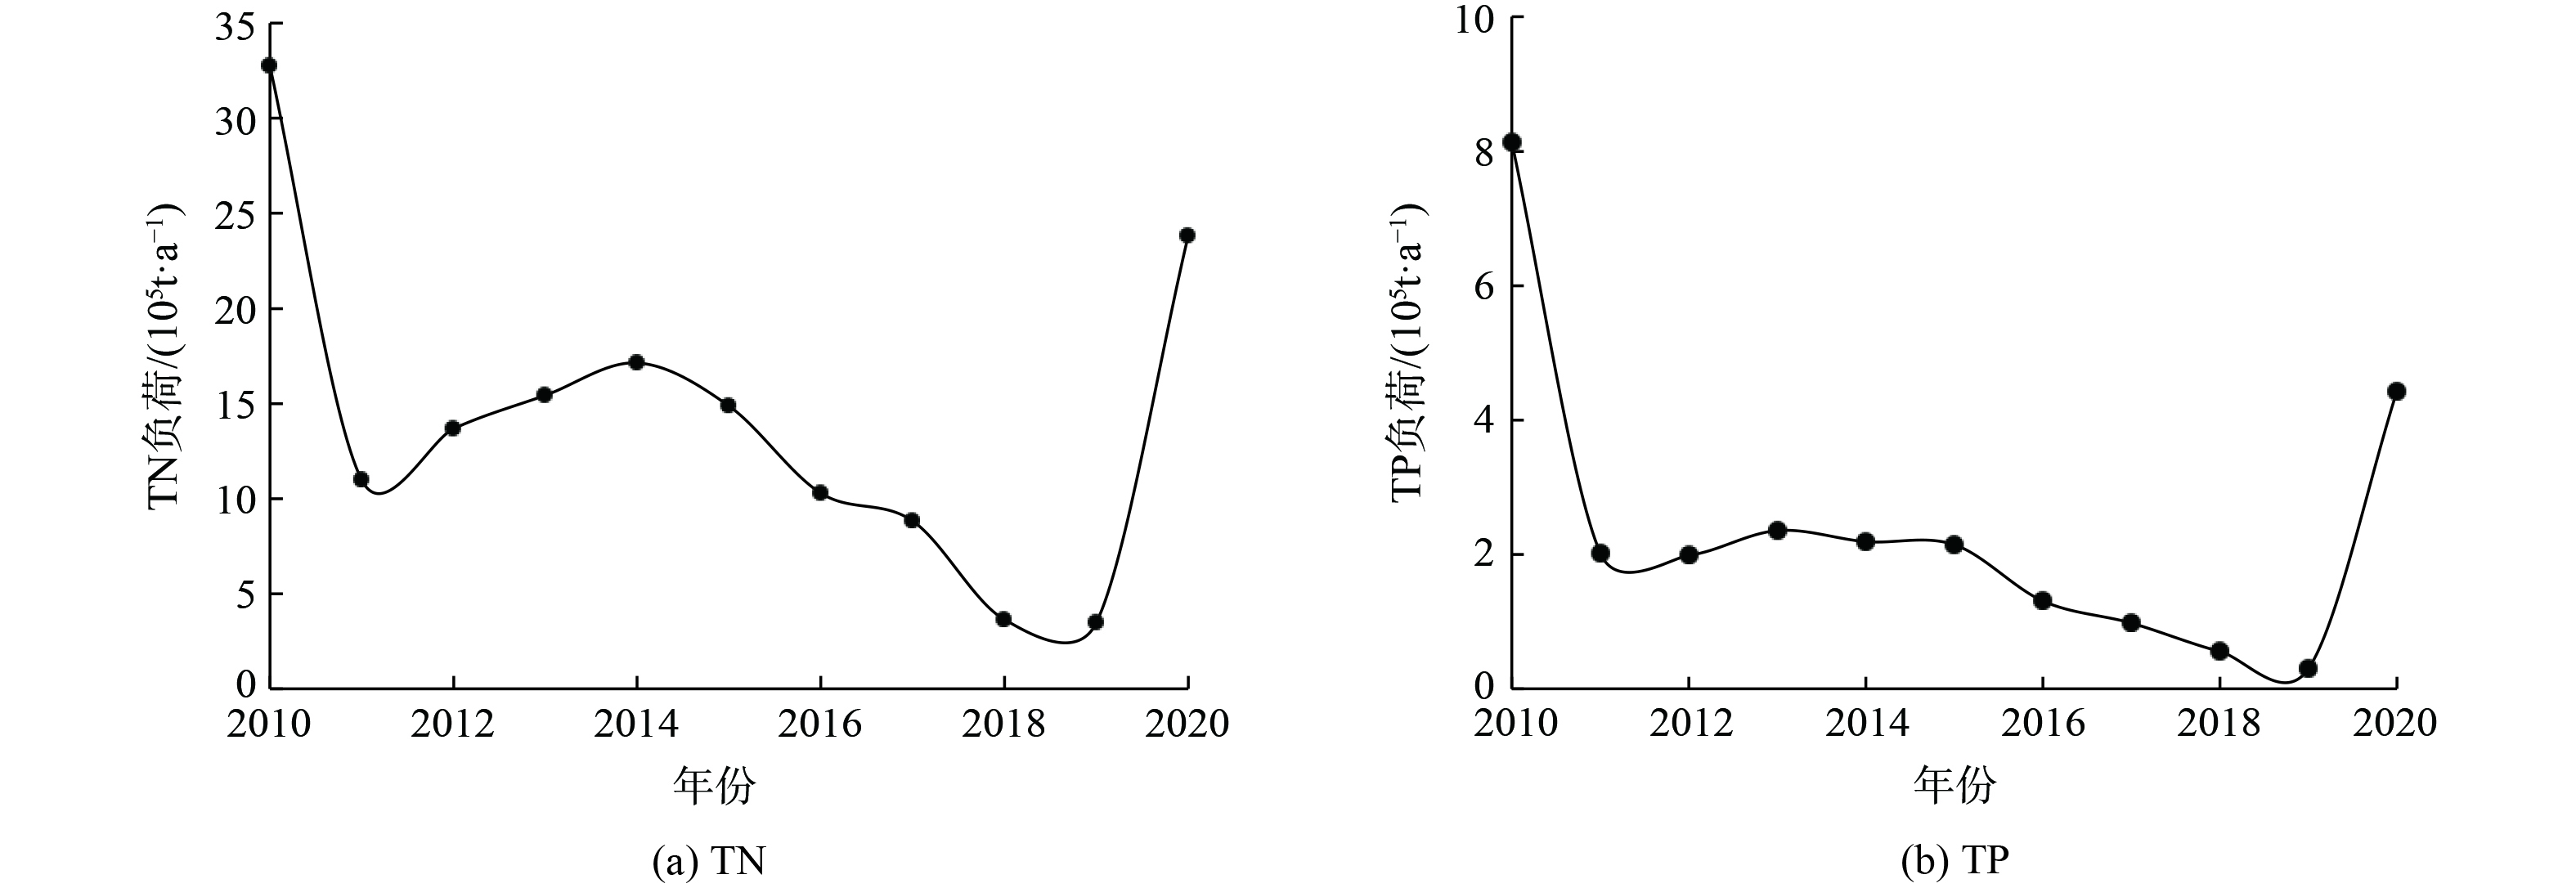
在SWAT模型中,将有机氮 (ORGN) 、硝酸盐总量 (NO3) 、亚硝酸盐总量 (NO2) 和氨氮总量 (NH4) 之和作为氮元素总负荷 (TN) ,将有机磷总量 (ORGP) 和矿物质磷总量 (MINP) 之和作为磷元素总负荷 (TP) ,本节对SWAT模拟的乌梁素海流域氮、磷元素年均输入、输出量以及负荷量进行时空变化规律分析。SWAT模型对乌梁素海流域 2010—2020年,TN和TP负荷量进行模拟。图6表明,TN和TP在2010—2020年间整体呈逐渐下降的趋势,2019年TN和TP负荷量最低,但2020年的TN、TP负荷量均有大幅回升。对TN和TP的年际变化分析表明,2010年污染物负荷量远高于其他年份。根据TN、TP的Mann-Kendall趋势分析发现,2010—2020年TN、TP的统计量Z值分别为−2.377和−1.595。这表明TN具有显著降低 (P < 0.05) 的变化趋势,TP具有降低的变化趋势但不显著。这体现出乌梁素海流域常年生态修复,统筹规划,综合治理有明显的效果 [23-24] 。同时,对SWAT模型模拟的TN和TP月负荷量进行分析,结果表明 (图7) :TN和TP在一年之间的季节变化较大;TN表现为1—3月逐渐增加,4月略有下降,后又迅速上升,5—7月,降低速率较快,8月之后逐渐趋于稳定;TP表现为1—3月迅速上升,4—7月相对缓慢下降,8—12月基本趋于稳定。乌梁素海流域TN和TP均表现为春季负荷量较高。造成这一趋势的原因主要与来水负荷、降水以及水生植物和藻类的生长周期有关,春季水温升高,湖中植物残余物分解,沉积物与水柱物质交换频繁,二次污染严重。此外,春季沙尘暴较多,加速了水分交换[25]。初秋时期,河流和湖泊周围浅水和湖岸缓冲区生长了许多沉水植物。这些植物可净化水质,逐渐降低水体营养物质的浓度,导致水体中TN和TP的负荷量降低。本研究的SWAT模型模拟结果与前期研究建立的乌梁素海富营养化状态多元线性回归模型的拟合结果一致[26] 。
-
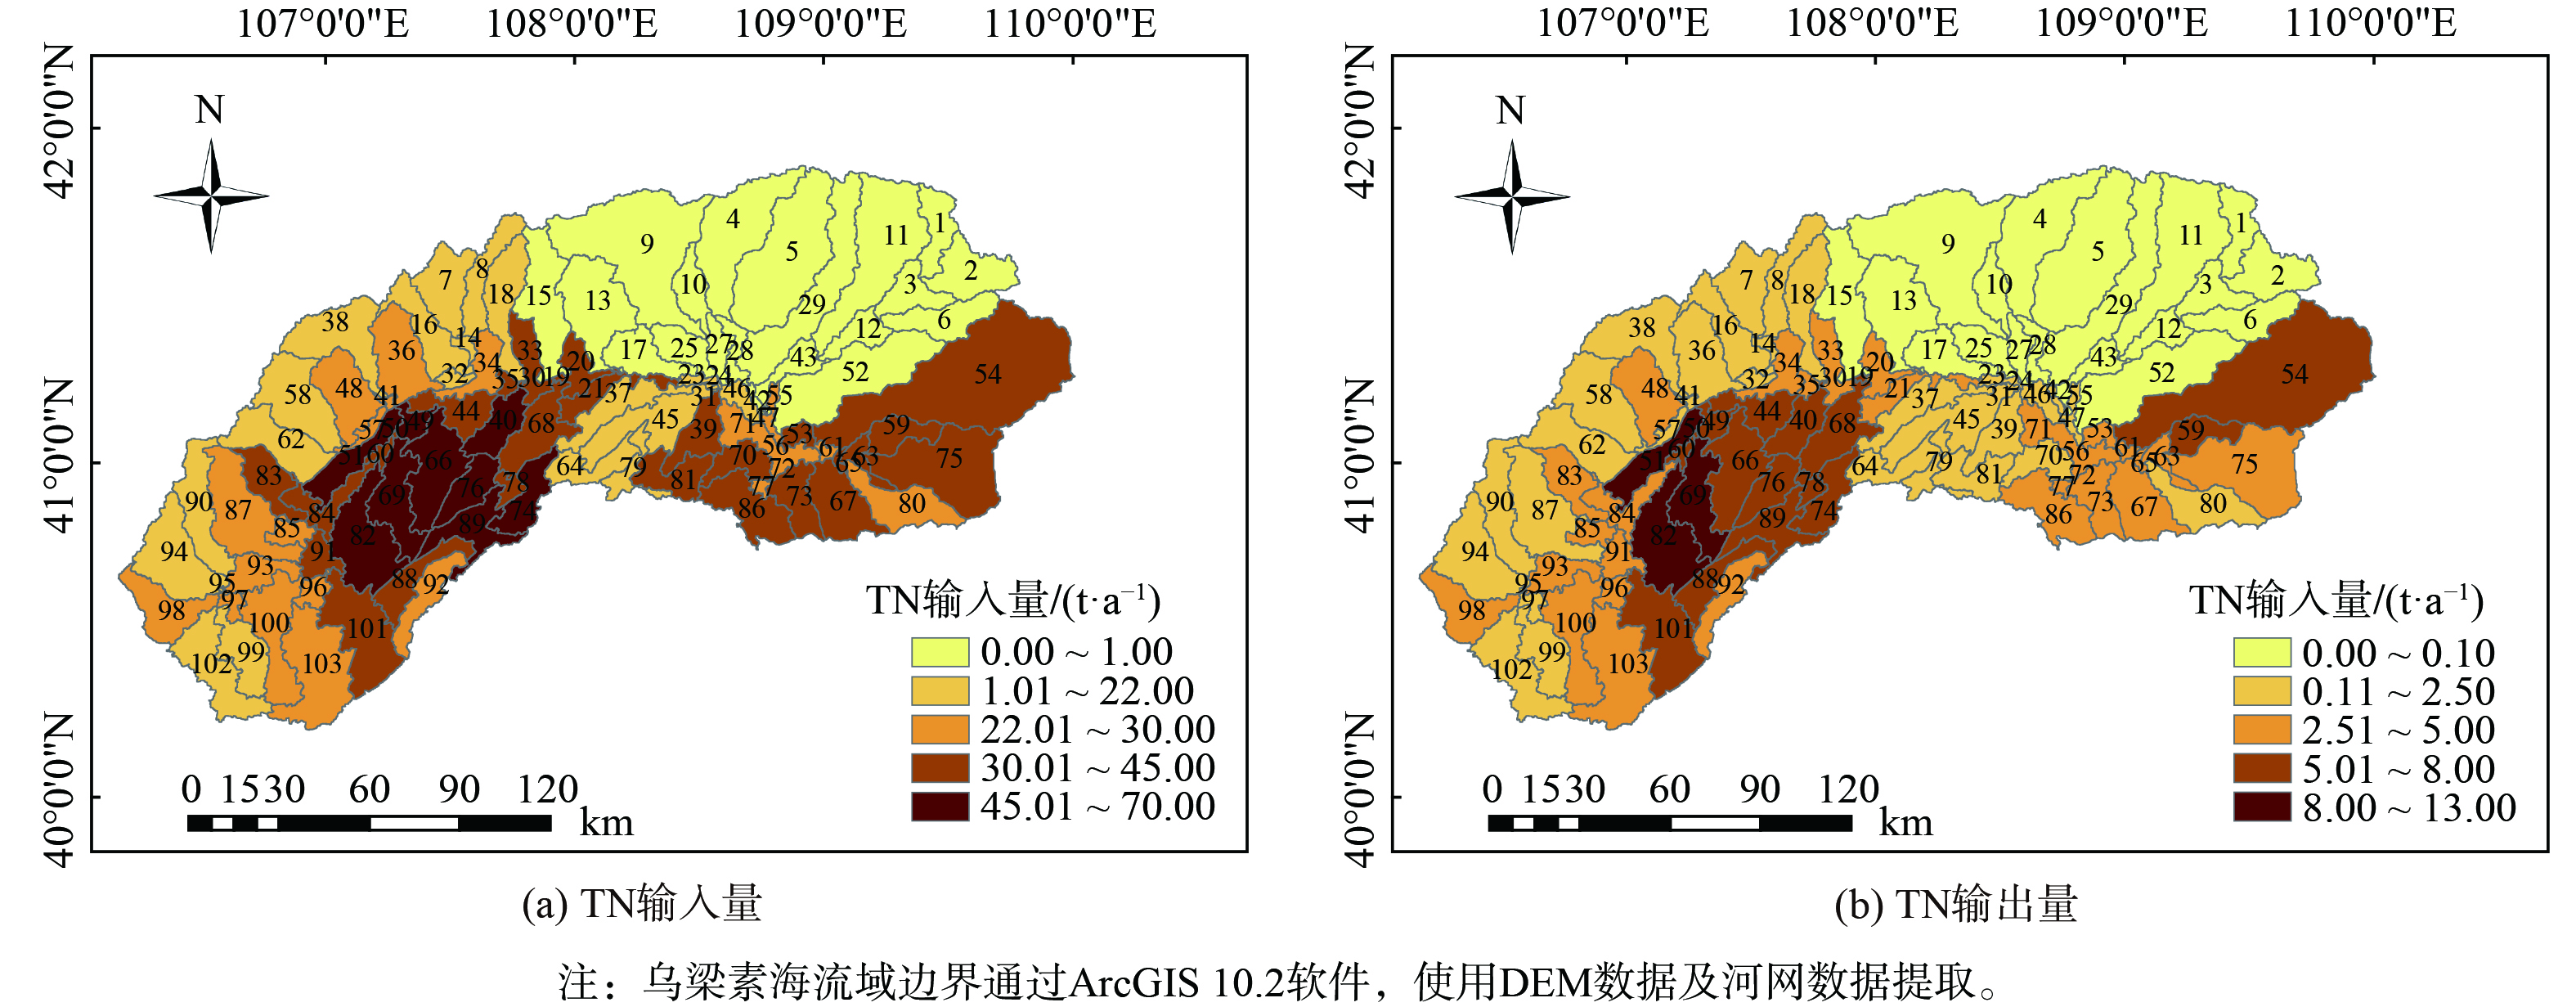
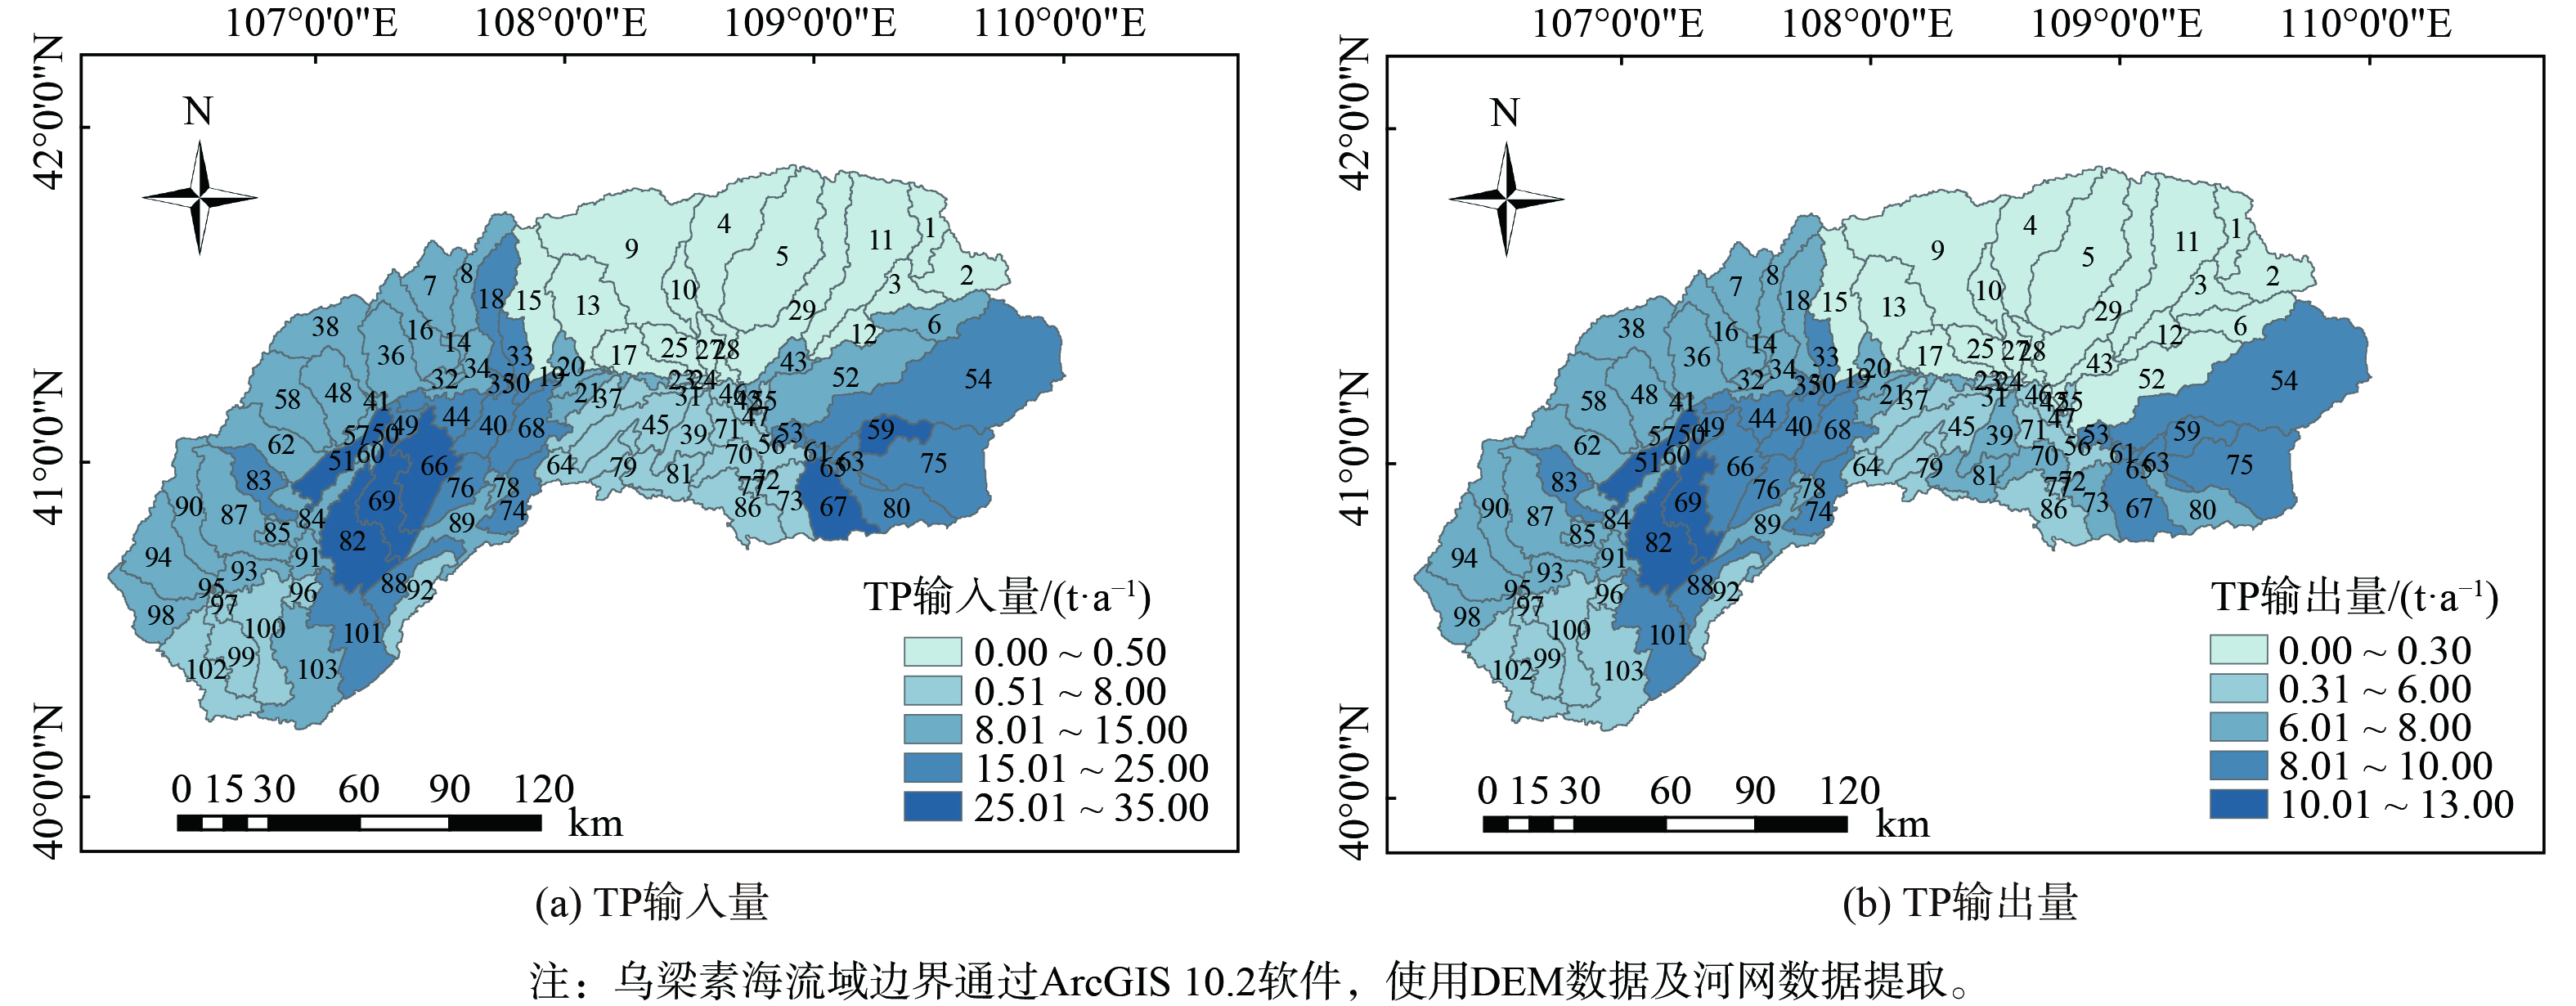
图8(a)和图8(b)为乌梁素海流域总氮输入量和输出量的空间分布图。总氮年均负荷量在南部的河套灌区较高,北部草地较低,在东部番茄、瓜果、甜菜等其他作物集中分布的区域,TN负荷量在30~45 t·a−1。并且,TN负荷量较高的50、51、69、82号子流域年均总氮输出量大于8 t·a−1,这些在流域主要土地利用类型为耕地,根据种植结构分布图,这些子流域均种植大量的玉米和葵花。图9(a)和图9(b)为乌梁素海流域总磷输入和输出量的空间分布图,整体趋势与TN相似,西部较高,东北部较低。50、51、59、69、82号子流域的TP的年均总输出量均超过10 (t·a−1),主要分布在以玉米和葵花为主的子流域。
基于种植结构的乌梁素海流域SWAT模型对面源污染物的模拟结果表明,TN和TP的污染物负荷量空间分布情况与土地利用方式具有较大的关系。结合种植结构发现,造成这一现象可能是因为乌梁素海流域西部以裸地和耕地为主。由于工业污水排放及农业生产中农药和化肥的施用,导致污染负荷量增加[27]。研究区的东北部地区分布大量的草地和林地,有利于减少水土流失,从而降低污染物的负荷量。同时,由于乌梁素海流域位于内蒙古自治区西部,属于温带大陆性季风气候,从西向东降水量逐渐增加,但这与污染物的负荷量并没有明显的相关关系。这表明降水对流域污染负荷的影响小于土地利用对污染负荷的影响。从土地利用方式可以看出,流域湿地面积较小、退化严重,将导致湿地的生态系统功能降低,进一步将会导致无法通过湿地的截流对河流和湖泊的TN、TP等污染物得到有效的净化作用,造成污染物累积,加重乌梁素海流域的面源污染[28]。并且,黄河水通过引水渠引入河套灌区内灌溉农田,引水口在西南,出水口在东北。由于区域内降水少,水渠的吞吐量小,水流速度慢,污染物沉积,这也是导致西南地区污染负荷严重的原因之一。根据乌梁素海流域种植结构图 (图10) 解析面源污染来源发现,流域五排干上游种植面积较为集中的小麦。研究表明[29],小麦种植比重对区域化肥面源污染产生促进作用。同时,小麦的氮磷流失量较大[30],五排干接纳了大量农田退水以及临河区污水处理厂的污水,导致其水质较差。七排干全排域位于巴彦淖尔市五原县内,由于沟道运行水位和地下水位逐年降低,导致污染物浓度高。六排干至七排干种植大量玉米,玉米对氮肥的施用量要求较高[31]。同时,七排干接纳了五原县污水处理厂的污水及两家番茄制作企业的工业排水[32],这均造成七排干水质恶化。本研究结果与王希欢[33]通过对乌梁素海流域各季节企业排口、排干水质的时空分析结果一致。在保证粮食作物产量的基本需求下,适当减少粮食作物小麦、玉米的种植面积,增加经济作物葵花、番茄和瓜类的种植面积,有利于减少粮食生产过程中给环境带来负面效应,并维持经济收入的增长。本研究对乌梁素海流域构建SWAT模型时,基于流域主要农作物的精准种植结构分布作为土地利用数据的模型输入数据,使模型模拟精确度更高,将人工沟渠与分布式水文模型相结合,对面源污染的评估具有重要意义。
-
1) 基于乌梁素海流域种植结构数据的SWAT模型对乌梁素海流域的径流量以及污染物负荷量进行模拟,将研究区划分为103个子流域,723个水文响应单元,率定期的R2为0.74,NES为0.81,验证期的R2为0.78,NES为0.67。2) 年际变化分析表明,TN和TP的负荷量在2010年最高,2010—2019年均有显著下降的趋势,但在2020年又大幅回升;季节性分析表明,乌梁素海流域污染物浓度在春季最高,夏季次之,秋冬季维持在较低的水平上。3) 乌梁素海流域面源污染的空间分布表明,TN和TP在东北部污染物输入、输出量较低,流域南部的河套灌区污染物输出量较高,流域种植结构对面源污染负荷量具有较大的影响。
基于种植结构改进的SWAT模型模拟乌梁素海流域面源污染负荷
Simulation of non-point source pollution load in Ulansuhai watershed by SWAT model based on improved planting structure
-
摘要: 乌梁素海是黄河流域最大的湖泊湿地,其地处河套灌区,是灌区排水的承泄湖。多年来面临着严重的水生态系统功能退化、水环境污染等问题,而改善和治理湖泊水环境的基础是要厘清乌梁素海流域灌区退水导致的农业面源污染负荷问题。基于无人机获取的高分辨照片与遥感影像和地面实测数据相结合所获取的精准种植结构数据可作为SWAT模型输入的土地利用数据,以确保对农业面源污染迁移转化过程的模拟更接近真实情况。结果表明,基于作物种植结构数据对流域径流模拟精确度较高,率定期R2为0.74,NES为0.81,验证期R2为0.78,NES为0.67。TN和TP在2010—2020年间整体呈逐渐下降的趋势。季节分析发现,TN和TP均表现为春季负荷量较高。空间分布表明,乌梁素海流域总氮年均负荷量在南部的河套灌区较高,北部草原区较低,在流域东部番茄、瓜果、甜菜等经济作物集中分布的区域,TN负荷量为30~45 t·a−1;总磷污染物负荷量的空间分布与总氮基本一致,主要分布在以玉米和葵花为主的子流域,TP年均总输出量均超过10 t·a−1。本研究结果可为乌梁素海流域面源污染治理及种植结构调整提供参考。Abstract: Ulansuhai, as the largest ecological functional area in north China, has been faced with serious problems of water ecosystem function degradation and water environment pollution for many years. The basis of improving and controlling the lake water environment was to clarify and solve the non-point source pollution caused by irrational irrigation and farming in Ulansuhai Watershed. Based on the SWAT model, this paper combined the high-resolution photos obtained by Unmanned Aerial Vehicle with remote sensing images and ground measured data as the land use data input by the SWAT model to ensure that the simulation of the migration and transformation process of non-point source pollution was closer to the real situation. The results showed that the simulation accuracy of runoff was high based on crop planting structure data, and the preheating period R2 was 0.74, NES was 0.81, and the verification period R2 was 0.78, NES was 0.67. TN and TP showed a gradual decline from 2010 to 2020. The seasonal analysis showed that both TN and TP showed a higher load in spring. The spatial distribution showed that the average annual load of total nitrogen in the Ulansuhai Watershed was higher in the southern Hetao irrigation area, but lower in the northern grassland. In the eastern part of the basin, where tomato, melon, fruit, beet and other crops were concentrated, TN load was 30-45 (t·a-1), and the spatial distribution of total phosphorus pollutant load was basically consistent with that of total nitrogen.It was mainly distributed in the sub-basins of corn and sunflower, and the annual total output of TP exceeds 10 (t·a-1). The results of this study can provide theoretical basis for non-point source pollution acontroll and planting structure improvement in Ulansuhai watershed.
-
Key words:
- Ulansuhai Watershed /
- SWAT model /
- planting structure /
- non-point source pollution
-

-
表 1 乌梁素海流域土地利用数据索引表
Table 1. Index table of land use data in Ulansuhai Basin
土地利用类型 代码 占比 林地 FRST 0.44% 草地 PAST 45.89% 水体 WATR 1.08% 不透水地面 URBN 2.32% 裸地 BARR 14.93% 玉米 CORN 18.71% 小麦 DWHT 0.81% 葵花 SUNF 9.28% 其他作物 AGRL 6.54% 表 2 气象站基本情况列表
Table 2. List of basic weather stations
编号 名称 气象站点 东经 / (°) 北纬 / (°) 1 五原 53337 108.467 41.083 2 临河 53513 107.367 40.733 3 磴口 53419 107.000 40.333 4 乌拉特前旗 53433 108.650 40.733 5 乌拉特中旗 53336 108.310 41.340 6 乌拉特后旗 53324 107.050 41.067 7 杭锦后旗 53420 107.117 40.850 表 3 SWAT模型可用参数
Table 3. SWAT model available parameters
序号 参数名称 参数描述 变化范围 1 CN2.mgt SCS径流曲线系数 28~99 2 ALPHA_BF.gw 基流 α 系数 0~1 3 GWQMN.gw 浅层地下水径流系数 0~5 000 4 SOL_K(1).sol 饱和水力传导系数 -100~100 5 ESCO.hru 土壤蒸发补偿系数 0~2 6 GW_REVAP.gw 地下水再蒸发系数 0~1 7 REVAPMN.gw 浅层地下水再蒸发系数 0~10 8 GW_DELAY.gw 地下水滞后系数 0~90 9 CH_N2.rte 主河道曼宁系数值 -10~100 10 SURLAG.bsn 地表径流滞后时间 0~10 -
[1] ADDAB H, BAILEY R T. Simulating the effect of subsurface tile drainage on watershed salinity using SWAT[J]. Agricultural Water Management, 2022, 262(31): 107431. [2] 刘卫林, 李香, 吴滨, 等. 修河中上游流域土地利用变化对径流的影响[J]. 水土保持究, 2023, 30(3): 111-120. [3] 陈祥义, 肖文发, 黄志霖, 等. 空间数据对分布式水文模型SWAT流域水文模拟精度的影响[J]. 中国水土保持科学, 2016, 14(1): 138-143. [4] SHEN Z Y, CHEN L, LIAO Q, et al. A comprehensive study of the effect of GIS data on hydrology and non-point source pollution modeling[J]. Agricultural Water Management, 2013, 118: 93-102. doi: 10.1016/j.agwat.2012.12.005 [5] 李润奎, 朱阿兴, 秦承志, 等. 土壤数据对分布式流域水文模型模拟效果的影响[J]. 水科学进展, 2011, 22(2): 168-174. [6] 马永明, 张利华, 张康, 朱志儒, 吴宗凡. 基于SWAT模型和多源DEM数据的流域水系提取精度分析[J]. 地球信息科学学报, 2019, 21(10): 1527-1537. [7] ABBASPOUR K C, JING Y, MAXIMOV I, et al. Modelling of hydrology and water quality in the pre-alpine/alpine thur watershed using SWAT[J]. Journal of Hydrology, 2007, 333(2/3/4): 413-430. [8] WU D, CUI Y L, WANG Y T, et al. Reuse of return flows and its scale effect in irrigation systems based on modified SWAT model[J]. Agricultural Water Management, 2019, 213: 280-288. doi: 10.1016/j.agwat.2018.10.025 [9] 刘卫林, 李香, 吴滨, 等. 修河中上游流域土地利用变化对径流的影响[J]. 水土保持研究, 2023, 30(3): 111-120. [10] 王维刚, 史海滨, 李仙岳, 等. 遥感订正作物种植结构数据对提高灌区SWAT模型精度的影响[J]. 农业工程学报, 2020, 36(17): 158-166. [11] LIU X H, LIU H M, CHEN H, et al. Spatiotemporal distribution and prediction of chlorophyll-a in Ulansuhai lake from an arid area of China[J]. Frontiers in Environmental Science, 2023, 11: 1045464. doi: 10.3389/fenvs.2023.1045464 [12] 杨文焕, 尹强, 钟清涛, 等. 2013—2019年乌梁素海排干入湖污染负荷与湖区水质的响应关系[J]. 华北水利水电大学学报(自然科学版), 2021, 42(1): 7-15. [13] 于瑞宏, 刘廷玺, 许有鹏, 等. 人类活动对乌梁素海湿地环境演变的影响分析[J]. 湖泊科学, 2007(4): 465-472. [14] 田野, 冯启源, 唐明方, 等. 基于生态系统评价的山水林田湖草生态保护与修复体系构建研究——以乌梁素海流域为例[J]. 生态学报, 2019, 39(23): 8826-8836. [15] 郭萍, 赵敏, 张妍, 等. 基于水足迹的河套灌区多目标种植结构优化调整与评价[J]. 农业机械学报, 2021, 52(12): 346-357. [16] KUMAR S N, THOMAS B W, XINZHONG D, et al. Modeling nitrous oxide emissions from rough fescue grassland soils subjected to long-term grazing of different intensities using the Soil and Water Assessment Tool (SWAT)[J]. Environmental Science & Pollution Research, 2018, 25(27): 27362-27377. [17] 魏怀斌, 张占庞, 杨金鹏. SWAT模型土壤数据库建立方法[J]. 水利水电技术, 2007(6): 15-18. doi: 10.13928/j.cnki.wrahe.2007.06.026 [18] ESLAMIAN S, SINGH V P, OSTAD-ALI-ASKARI K, et al. Sensitivity Analysis of Runoff Model by SWAT to Meteorological Parameters: A Case Study of Kasillian Watershed, Mazandaran, Iran[J]. International Journal of Agricultural Sciences, 2017, 3(3): 2454-6224. [19] ZADEH F K, NOSSENT J, SARRAZIN F, et al. Comparison of variance-based and moment-independent global sensitivity analysis approaches by application to the SWAT model[J]. Environmental Modelling and Software, 2017, 91(5): 210-222. [20] MORIASI D N, MARGARET W G, NARESH P, et al. Hydrologic and Water Quality Models: Performance Measures and Evaluation Criteria[J]. Transactions of the Asabe, 2015, 58(6): 1763-1785. doi: 10.13031/trans.58.10715 [21] RATHJENS H, BIEGER K, CHAUBEY I, et al. Delineating floodplain and upland areas for hydrologic models: a comparison of methods[J]. Hydrological Processes, 2016, 30(23): 4367-4383. [22] QI J Y, ZHANG X S, MCCARTY G W, et al. Assessing the performance of a physically-based soil moisture module integrated within the Soil and Water Assessmen Tool[J]. Environmental modelling & software, 2018, 209: 329-341. [23] 崔战江, 马锐霞. 浅谈总排干沟水资源在巴彦淖尔市水资源管理中的合理配置[J]. 内蒙古水利, 2014(4): 43-44. [24] 田伟东, 贾克力, 史小红, 等. 2005-2014 年乌梁素海湖泊水质变化特征[J]. 湖泊科学, 2016, 28(6): 1226-1234. [25] 郭嘉, 韦玮, 于一雷, 等. 乌梁素海湿地富营养化研究进展[J]. 生态学杂志, 2015, 34(11): 3244-3252. [26] 杜丹丹, 李畅游, 史小红, 等. 乌梁素海水体营养状态季节性变化特征研究[J]. 干旱区资源与环境, 2019, 33(12): 186-192. [27] MAO X, WANG C, WEI X, et al. The Distribution of Chlorophyll-a and its' Correlation with Related Indicators in the Ulansuhai Lake, China[J]. Journal of Environmental Accounting & Management, 2014, 2(2): 123-131. [28] M. F COVENEY, D. L STITES, E. F LOWE, et al. Nutrient removal from eutrophic lake water by wetland filtration[J]. Ecological Engineering, 2002, 19(2): 141-159. doi: 10.1016/S0925-8574(02)00037-X [29] 王晓娅. 粮食作物种植结构与化肥面源污染——基于长江经济带市级数据的实证研究[D]. 武汉: 华中农业大学, 2022. [30] 刘根红, 许强, 乔娜, 等. 宁夏自流灌区农作物氮磷低污染种植结构优化[J]. 干旱地区农业研究, 2016, 34(1): 140-146. doi: 10.7606/j.issn.1000-7601.2016.01.22 [31] 薛垠鑫, 刘根红, 王晓钰. 滴灌条件下氮磷钾肥配施对玉米株高、光合速率及产量的影响[J]. 甘肃农业大学学报, 2020, 55(6): 77-85. [32] 丁夏平, 王瑞. 内蒙古河套灌区灌排体系现状及污染变化规律[J]. 水利科学与寒区工程, 2022, 5(5): 51-54. [33] 王希欢. 乌梁素海流域氮污染来源的时空特征解析研究[D]. 北京: 中国环境科学研究院, 2021. -


 下载:
下载:
