-
城镇污水处理厂(以下简称“污水厂”)在运营过程中消耗大量能源、物料,并在生化处理过程中释放温室气体(主要为CO2、N2O、CH4),其碳排放量可占全社会总碳排放量的1%~2%,是我国城市碳排放的重要来源[1-2]。并且,随污水处理行业快速发展和出水排放标准日益严格,污水厂碳排放呈逐渐上升趋势[3-5]。在我国实现“碳达峰,碳中和”的目标背景下,对污水厂进行碳排放特征研究是实现污水处理行业低碳转型、助力“双碳”战略的重要基础。
目前,针对国内污水厂的碳排放研究有所增多,主要包括以下几个方面:考察单个污水厂碳排放量及排放类别组成;研究单个污水厂处理流程碳足迹;对采用不同处理工艺的污水厂碳排放特征进行对比[6-22]。总体而言,相关研究多以少量样本为考察对象,样本地域分布较分散、数量较不足。由于气候、水文、进水水质、处理规模、处理工艺以及管理水平等上的差别,不同地区污水厂碳排放特征存在差异,个例的污水厂碳排放数据并不足以为特定地区污水厂碳排放路径制定提供可靠参考。另外,现有研究多以污水厂月/年均运营数据为基础进行碳排放核算,忽略了污水处理每日进出水工况变化,核算精确度不足[6-7]。在此局面下,有必要在获得大量样本详细运营数据前提下,对区域性的污水厂进行全面的碳排放研究,科学评判碳排放特征及主要影响因素,为本区域城镇污水处理行业低碳运营之路提供针对性依据。
南方某省人口数量大、经济发达、污水处理规模巨大,但尚无针对其城镇污水处理行业全面的碳排放特征调查研究。本研究以该省59座污水厂2021年度的每日运营数据为基础,对其碳排放量和强度进行了核算。基于核算结果,考察不同类别(运营状况、处理工艺等)污水厂总体碳排放特征和影响因素,以期科学助力该省污水处理行业低碳发展和国家“双碳”政策实施。
-
研究对象为南方某省59座正常运行、服务所在城市主要城镇区域和大部分人口的污水厂,所在城市均位于亚热带季风气候区域,年均气温均接近22 ℃。污水厂设计规模在0.1×10⁴~120.0×10⁴ t·d−1,分布范围广,其中数量上以中小型为主,20×104 t·d−1以下设计规模污水厂为41座,占总数量的83.1%;规模上以大型为主,20×104 t·d−1以上设计规模污水厂总规模为503.9×10⁴ t·d−1,占总设计规模的64.1%(表1)。污水厂中A2/O类、SBR类、MBR和氧化沟类工艺占绝大多数,数量占比94.9%(表2),设计规模占比94.0%。2021年进水COD、BOD5、TN和氨氮平均值(文中所提及平均值均为加权处理后平均值)分别为213、113、27和22 mg·L−1,污染物去除均执行《城镇污水处理厂污染物排放标准》(GB 18918-2002)一级A及以上标准。
-
碳排放(文中所涉及碳排放均统一为CO2当量)的核算边界包括污水和污泥处理的主要环节,具体以污水进入污水厂为起点,以处理后水排入受纳水体和污泥外运为终点。本研究中电耗碳排放核算不包括生活、办公用电,主要由于核算与污染物去除密切相关的环节,生活、办公用电为污水厂辅助用电,不属于此范畴。另外,本次考察的污水厂生活、办公电耗仅占总电耗的0.7%~1.6%,占比较小,对污水厂整体碳排放特征影响不大。同时,因所考察污水厂污泥处置方式多样,包括直接焚烧、水泥窑掺烧、卫生填埋、土地利用等,污泥处置大多交予外部企业执行,相关碳排放核算基础数据未得到良好统计,故不将污泥处置环节碳排放统计在内。
-
污水厂的碳排放核算方法参考联合国政府间气候变化专门委员会(Intergovernmental Panel on Climate Change, IPCC)发布的《IPCC国家温室气体清单指南》[23]、《IPCC国家温室气体清单指南(2019年修订版)》[24]、中国环境保护产业协会发布的《污水处理厂低碳运行评价技术规范》[25]和中国城镇供水排水协会发布的《城镇水务系统碳核算与减排路径技术指南》[26],并尽量选择贴近国内生产实际的参数。根据各污水厂2021年每日污水处理量、进/出水水质、燃料消耗(燃耗)、电耗、药耗、热耗等运营数据,计算每日直接碳排放和间接碳排放,进而得出各污水厂2021年度碳排放数据。因本研究将核算边界限定在污水厂厂界内且污水/污泥出厂后续环节数据欠缺,与《城镇水务系统碳核算与减排路径技术指南》相比,此次核算未将尾水排入受纳水体和出厂污泥处置产生的直接碳排放统计入内,其他碳排放类别及核算方法与上述标准基本一致。
1)直接碳排放。污水厂运行过程中厂内因污泥干化、物料运输或备用发电等活动消耗的化石燃料,产生的CO2直接排放按式(1)和式(2)计算。因所考察污水厂均无污泥厌氧消化或堆肥处理,故仅计算污水厌氧生化处理工艺CH4碳排放,CH4碳排放量(换算为CO2当量)按式(3)和式(4)计算。污水生化处理工艺的缺氧阶段和好氧阶段会产生N2O,N2O对应的碳排放量(换算为CO2当量)按式(5)和式(6)计算。直接碳排放总量按式(7)和式(8)计算。
式中:mD,F,i为第i座污水厂燃耗碳排放量,t;ESC为消耗单位质量标准煤对应CO2排放量(标准煤碳排放因子),取值为2.772 5 kg·kg−1;MF,k,i,j为第i座污水厂第j天第k种化石燃料消耗量,按标准煤质量计算,本研究中污水厂使用的化石燃料为天然气,折算系数为1.215 kg·m−3(即1 m3天然气与1.215 kg标准煤燃烧碳排放量相同)[27];mD,F为59座污水厂燃耗碳排放量,t。
式中:
$ {m}_{\mathrm{D},\mathrm{C}{\mathrm{H}}_{4},i} $ 为第i座污水厂CH4碳排放量,t;QIn,i,j为第i座污水厂第j天进水量,m3;BIn,i,j为第i座污水厂第j天进水BOD5,mg·L−1;$ {E}_{\mathrm{C}{\mathrm{H}}_{4}} $ 为去除单位BOD5对应CH4排放量(CH4排放因子),kg·kg−1,不同处理工艺污水厂CH4排放系数取值见表3[26];$ {G}_{\mathrm{C}{\mathrm{H}}_{4}} $ 为CH4全球增温潜势(即单位质量CH4对应相同温室效应的CO2量),取值为28 kg·kg−1;$ {m}_{\mathrm{D},\mathrm{C}{\mathrm{H}}_{4}} $ 为59座污水厂CH4碳排放量,t。式中:
$ {m}_{\mathrm{D},{\mathrm{N}}_{2}\mathrm{O},i} $ 为第i座污水厂N2O碳排放量,t;QIn,i,j为第i座污水厂第j天进水量,m3;NIn,i,j为第i座污水厂第j天进水TN值,mg·L−1;$ {E}_{{\mathrm{N}}_{2}\mathrm{O}} $ 为去除单位TN对应N2O-N排放量(N2O排放因子),kg·kg−1,不同处理工艺污水厂N2O排放系数取值见表3[26];$ {\omega }_{\mathrm{N}/{\mathrm{N}}_{2}\mathrm{O}} $ 为N2O中N质量分数,取值为28/44;$ {G}_{{\mathrm{N}}_{2}\mathrm{O}} $ 为N2O全球增温潜势(即单位质量N2O对应相同温室效应的CO2量),取值为265 kg·kg−1;$ {m}_{\mathrm{D},{\mathrm{N}}_{2}\mathrm{O}} $ 为59座污水厂N2O碳排放量,t。式中:mD,i、mD,F,i、
$ {m}_{\mathrm{D},\mathrm{C}{\mathrm{H}}_{4},i} $ 和$ {m}_{\mathrm{D},{\mathrm{N}}_{2}\mathrm{O},i} $ 分别为第i座污水厂直接碳排放总量、燃耗碳排放量、CH4碳排放量和N2O碳排放量,t;mD为59座污水厂直接碳排放总量,t。2)间接碳排放。电耗碳排放量指污水厂运行过程中(不包括生活、办公用电)消耗外购电量产生的碳排放量根据式(9)和式(10)计算。药耗碳排放量指污水厂运行过程中消耗碳源、混凝剂、絮凝剂、消毒剂等化学药剂产生的碳排放根据式(11)和式(12)计算。
式中:mI,E,i为第i座污水厂电耗碳排放量,t;EE为外购电力碳排放因子(即消耗单位kWh对应CO2排放量),取值为0.804 2 kg·kWh−1[25-26];Wi,j为第i座污水厂第j天用于生产的外购电能消耗量,kWh;mI,E为59座污水厂电耗碳排放量,t。
式中:mI,C,i为第i座污水厂药耗碳排放量,t;EC,k为第i座污水厂消耗单位质量第k种药剂对应CO2排放量(药剂碳排放因子),kg·kg−1,所使用主要药剂碳排放因子取值见表4[25-26];MC,k,j,i为第i座污水厂第j天第k种药剂消耗量,kg;mI,C为59座污水厂药耗碳排放量,t。
热耗碳排放量指污水厂运行过程中(不包括生活区、办公区用热)消耗外购热量产生的碳排放量,按式(13)和式(14)计算。间接碳排放总量按式(15)和式(16)计算。
式中:mI,H,i为第i座污水厂热耗碳排放量,t;ESC为标准煤碳排放因子,取值为2.772 5 kg·kg−1;Hi,j为第i座污水厂第j天用于生产的外购热能消耗量,按标准煤质量计算,kg,折算系数为0.034 1 kg标准煤·10−6 J[27];mI,H为59座污水厂电耗碳排放量,t。
式中:mI,i、mI,E,i、mI,C,i和mI,H,i分别为第i座污水厂间接碳排放总量、电耗碳排放量、药耗碳排放量和热耗碳排放量,t;mI为59座污水厂间接碳排放总量,t。
3)碳排放总量和碳排放强度的计算。碳排放总量按式(17)和式(18)计算。碳排放强度指污水厂运行过程中处理单位体积污水产生的碳排放量,按式(19)和式(20)计算。
式中:mT,i、mD,i和mI,i分别为第i座污水厂碳排放总量、直接碳排放总量和间接碳排放总量,t;mT为59座污水厂碳排放总量,t。
式中:IT,i为第i座污水厂碳排放强度,kg·m−3;mT,i为第i座污水厂碳排放总量,t;QIn,i,j为第i座污水厂第j天进水量,m3;IT为59座污水厂总体碳排放强度,kg·m−3。
-
59座污水厂年碳排放量范围为0.02×10⁴~11.98×10⁴ t(图1(a)),其中平均值为1.38×10⁴ t,中位值为0.62×10⁴ t。由图1(b)可知,各污水厂年碳排放量随处理规模增大而上升,2者大致呈正相关关系。
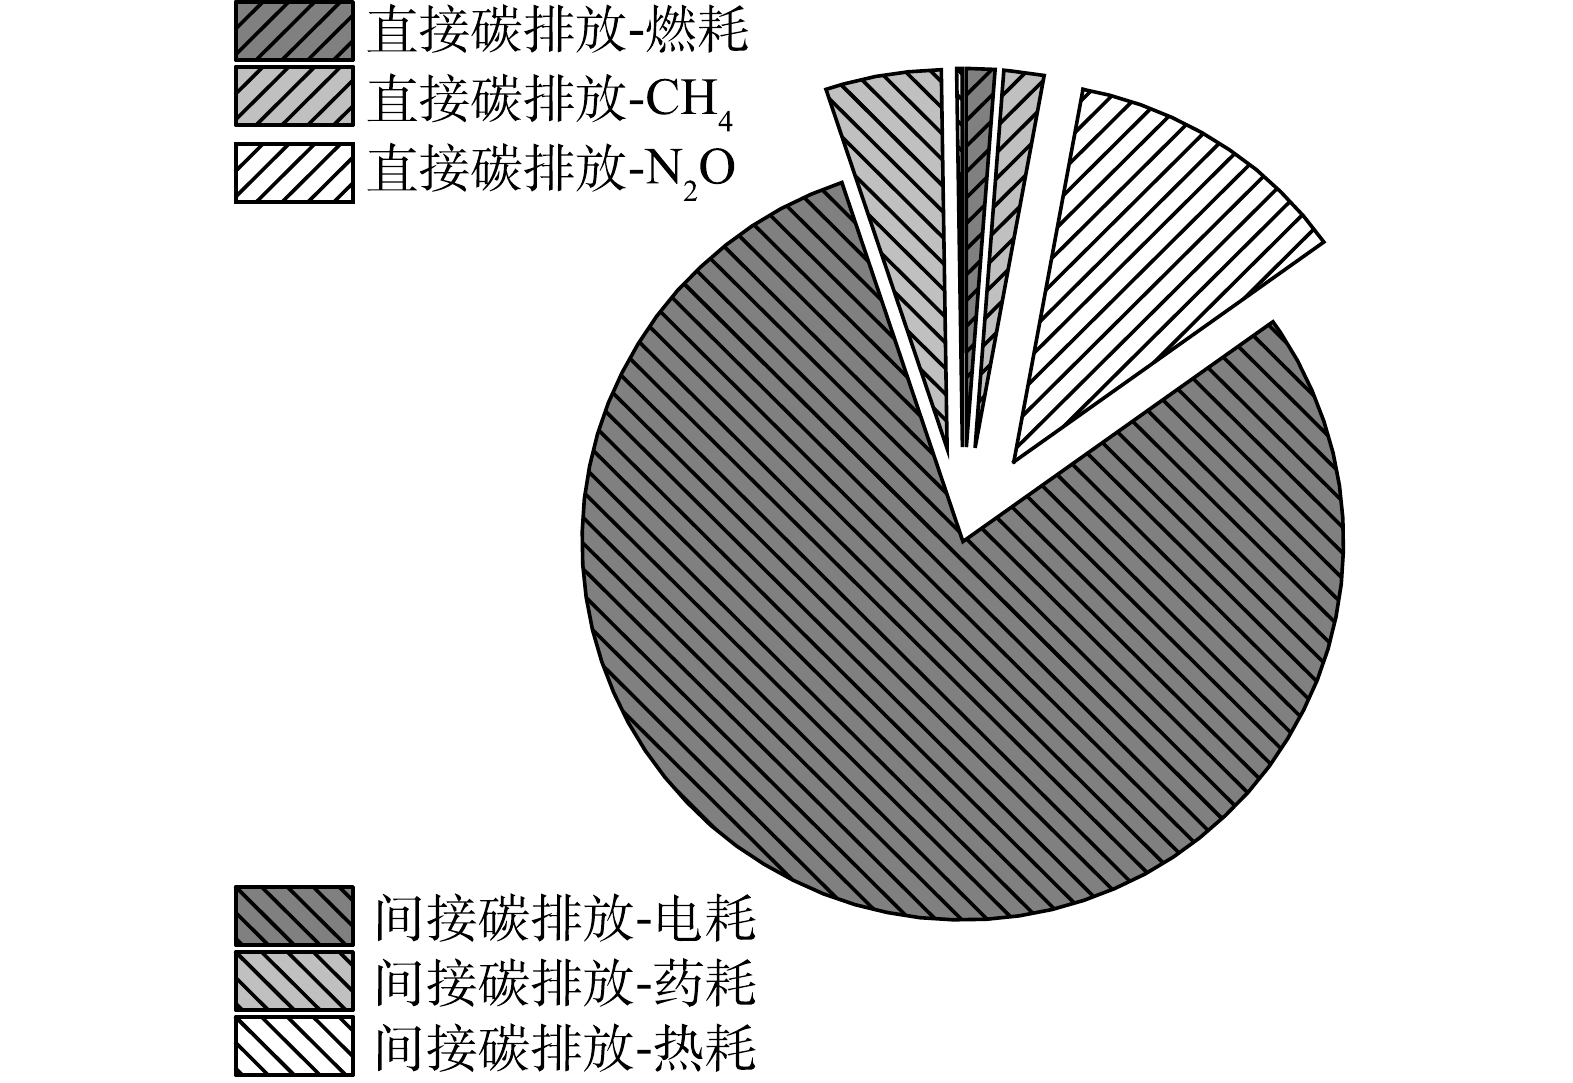
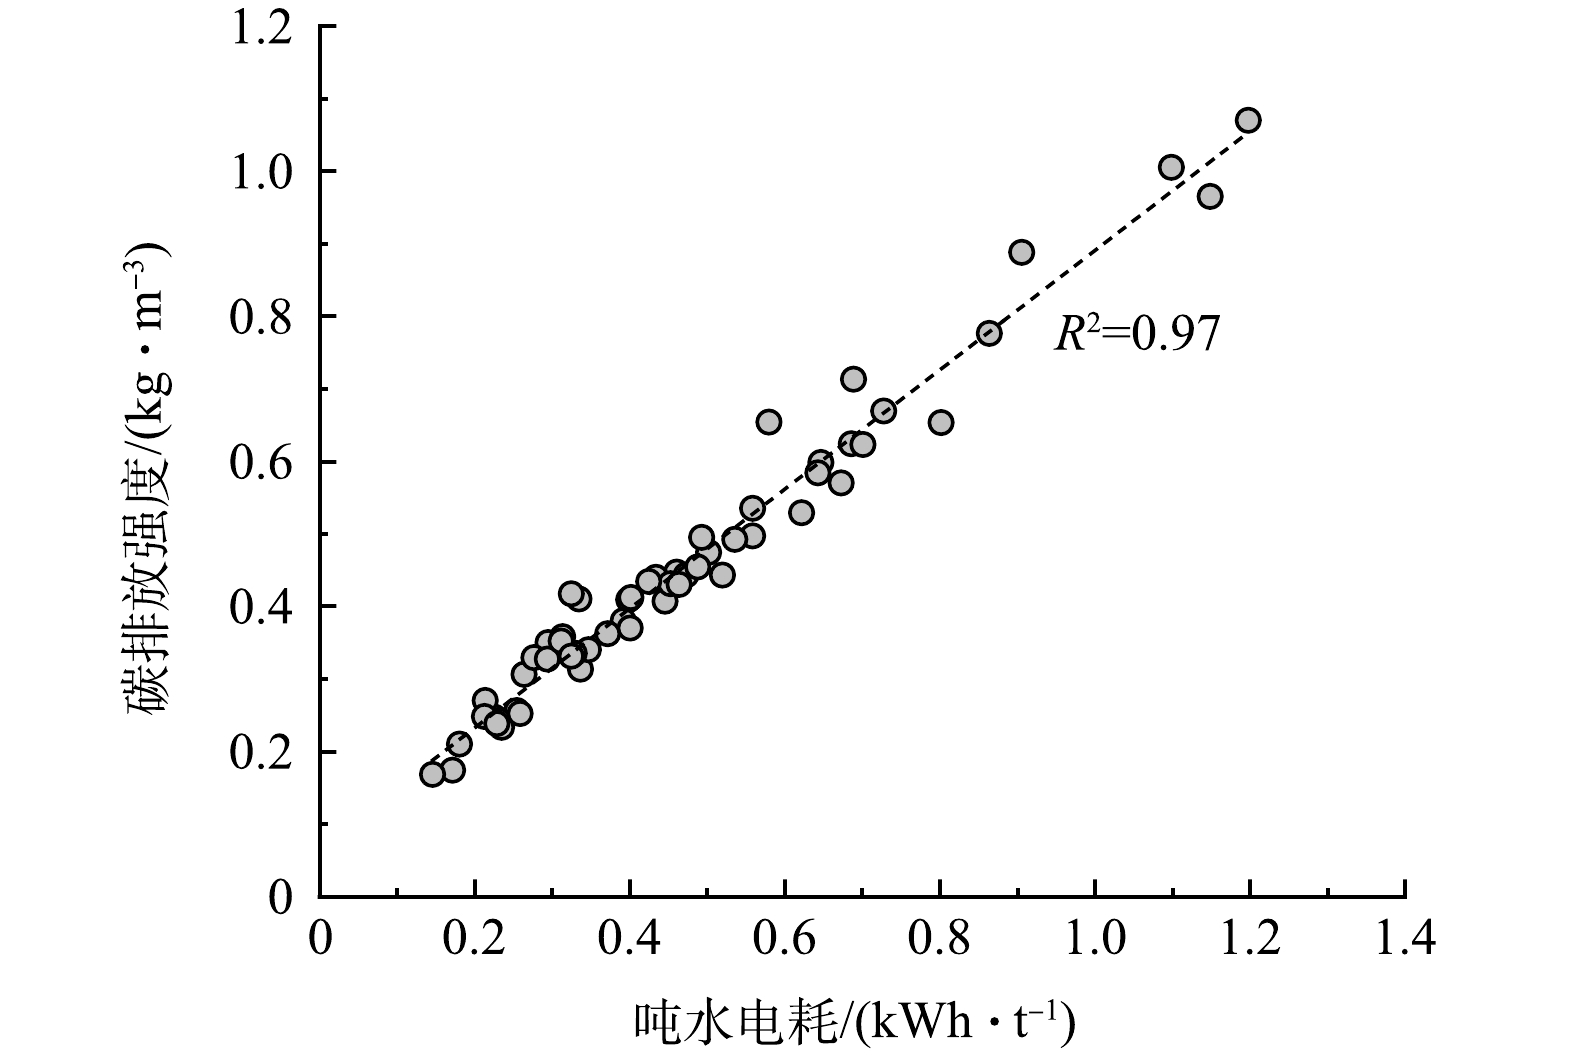
污水厂各碳排放类别总体占比如图2所示。间接碳排放是污水厂碳排放主要来源(84.8%),其中电耗碳排放占比(79.7%)最高,药耗碳排放(4.9%)次之,热耗碳排放(0.2%,仅有2座污水厂使用外购热力)最少。各污水厂电耗碳排放占各自总碳排放比例均为最大(62.6%~98.9%),这是由于污水处理流程涉及曝气、污水提升、污水/污泥回流、污泥干化等高耗能环节,使得电耗成为影响碳排放水平的关键因素[28-29]。由图3可见,污水厂碳排放强度与吨水电耗呈显著正相关关系。
直接碳排放总体占比15.2%,其中N2O碳排放占比(12.2%)较高,CH4和燃耗碳排放占比(分别为1.7%和1.2%)较低。N2O碳排放占比较高的原因一方面在于所考察水厂多数进水C/N比较低(平均值为3.6),除氮效果不理想,中间副产物N2O产量较高[30-34]。另一方面,N2O具有较高的全球增温潜势(265 kg·kg−1),远高于CH4(28 kg·kg−1)和CO2(1 kg·kg−1) 2种温室气体对应值[24]。因此,尽管全部水厂的N2O排放量(374.8 t)低于CH4排放量(492.9 t),但N2O碳排放依然是直接碳排放的主要来源。
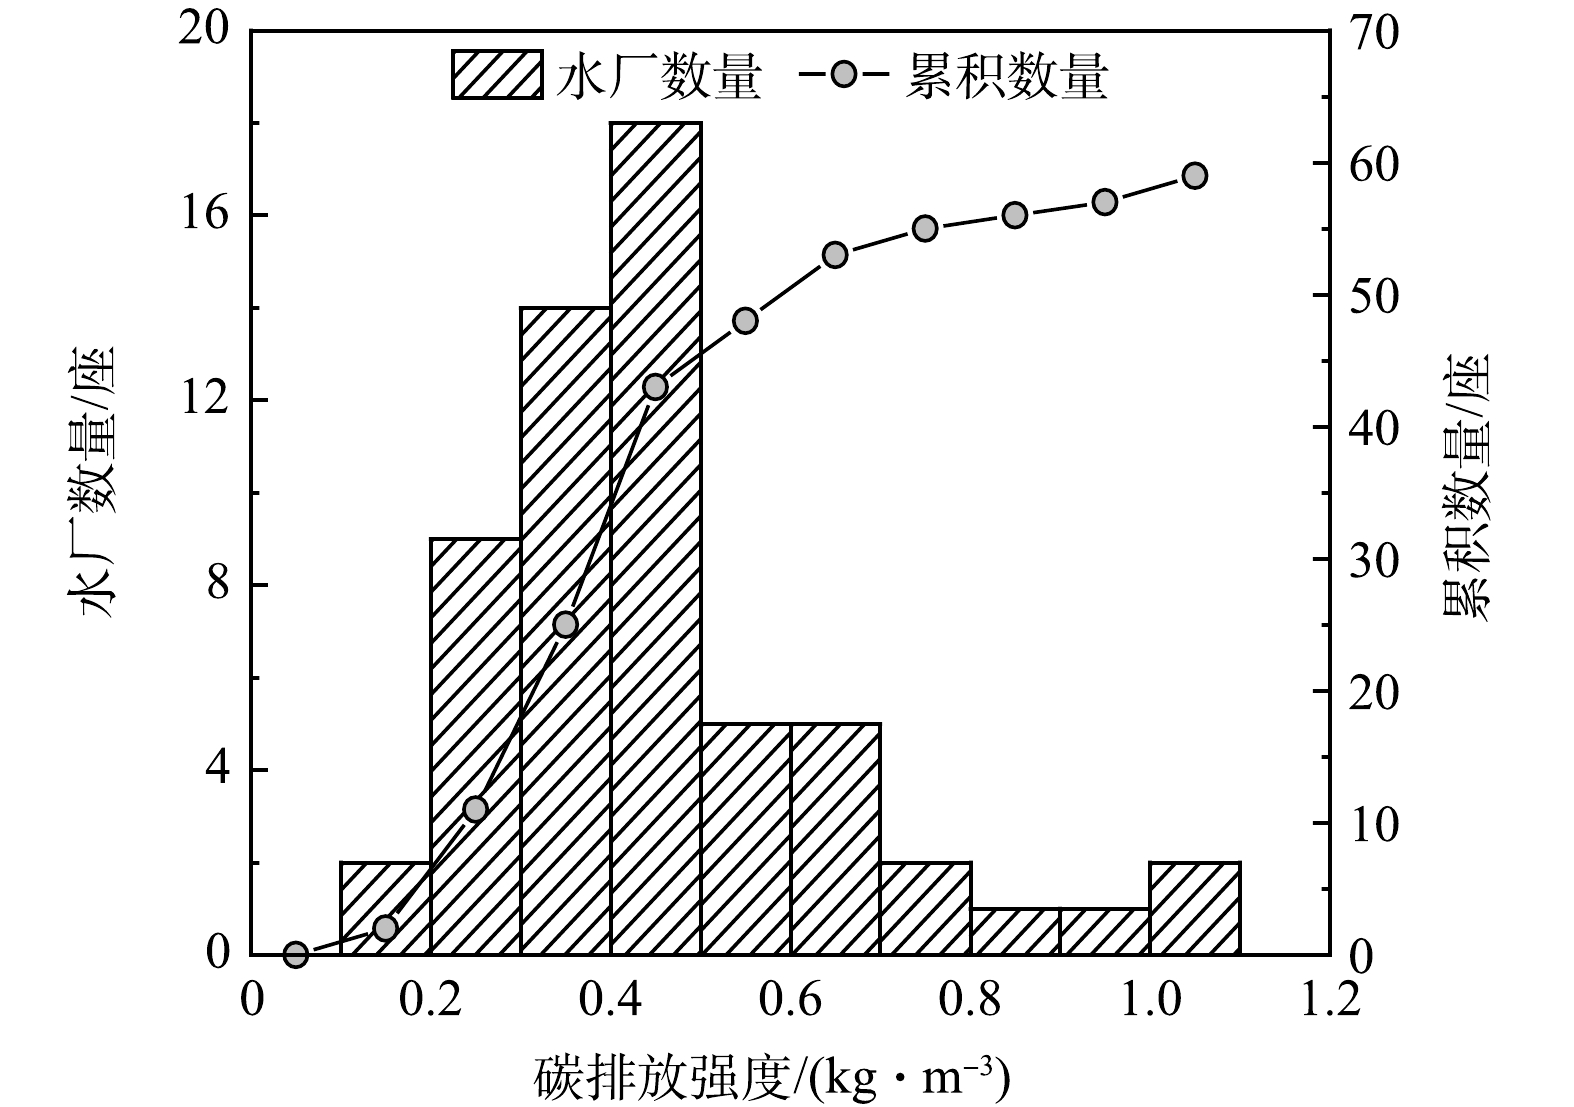
所考察污水厂总体碳排放强度为0.326 kg·m−3,强度范围为0.168~1.070 kg·m−3。如图4所示,仅2座污水厂碳排放强度小于0.3 kg·m−3,占比3.4%;41座污水厂碳排放强度在0.2~0.5 kg·m−3,占比(69.5%)最大;14座污水厂(占比23.7%)碳排放强度分布在0.5~1.0 kg·m−3;仅2座污水厂碳排放强度高于1.0 kg·m−3,占比3.4%。与文献中我国其他地区污水厂(0.360~1.439 kg·m−3,表5)相比,该省污水厂碳排放强度范围接近,总体值较低[6-22]。张程[15]的研究表明2017年西安市某50×104 t·d−1倒置A2/O工艺污水厂碳排放强度为0.498 kg·m−3。处理水量较小的污水厂由于不具备规模效应,碳排放强度明显较高。夏天虹[19]研究了四川省某0.2×10⁴ t·d−1 CASS工艺污水厂全生命周期碳排放情况,其运行阶段碳排放强度为0.650 kg·m−3。张玲丽等[22]核算了2019年浙江省某4×10⁴ t·d−1污水厂(进水中包含工业废水)改进工艺前后的碳排放强度,改为CAST+MBBR工艺后碳排放强度有了明显降低(改进前为CAST工艺,1.040 kg·m−3),但仍达到了0.790 kg·m−3。总体而言,已有研究中我国污水厂碳排放以电耗碳排放为主,在污水厂处理工艺、进水水质/水量相对稳定之后,生化处理阶段微生物活动产生的温室气体变化幅度有限,较为直接有效的降碳方式即降低污水处理过程电耗,包括优化工艺参数、提升设备效率、升级调控水平或使用清洁能源。所考察省份污水厂电力碳排放因子(0.804 2 kg·(kWh)−1)低于同时期国内其他多数地区(0.858 7~1.082 6 kg·(kWh)−1),很大程度上降低了总体碳排放强度[25-26]。此外,该省污水厂在工艺、设备、管理上具有一定优势,通过精准曝气、智能投药等方式进一步降低了整体碳排放强度。然而,与发达国家相比,该省碳排放水平依然较高,主要原因在于发达国家清洁能源应用广泛,电耗碳排放因子较低[35-38]。另外需指出,由于以往污水厂碳排放核算研究领域无统一的核算边界和标准,或由于数据欠缺,文献中污水厂碳排放核算尽管多基于《IPCC国家温室气体清单指南》,但核算类别和方法不尽一致,此处比较仅供大致参考。
鉴于电耗碳排放是该省污水厂碳排放水平的关键组成部分,下文将主要结合电耗水平,辅以其他碳排放来源,对该省不同类别污水厂碳排放强度特征进行讨论分析。
-
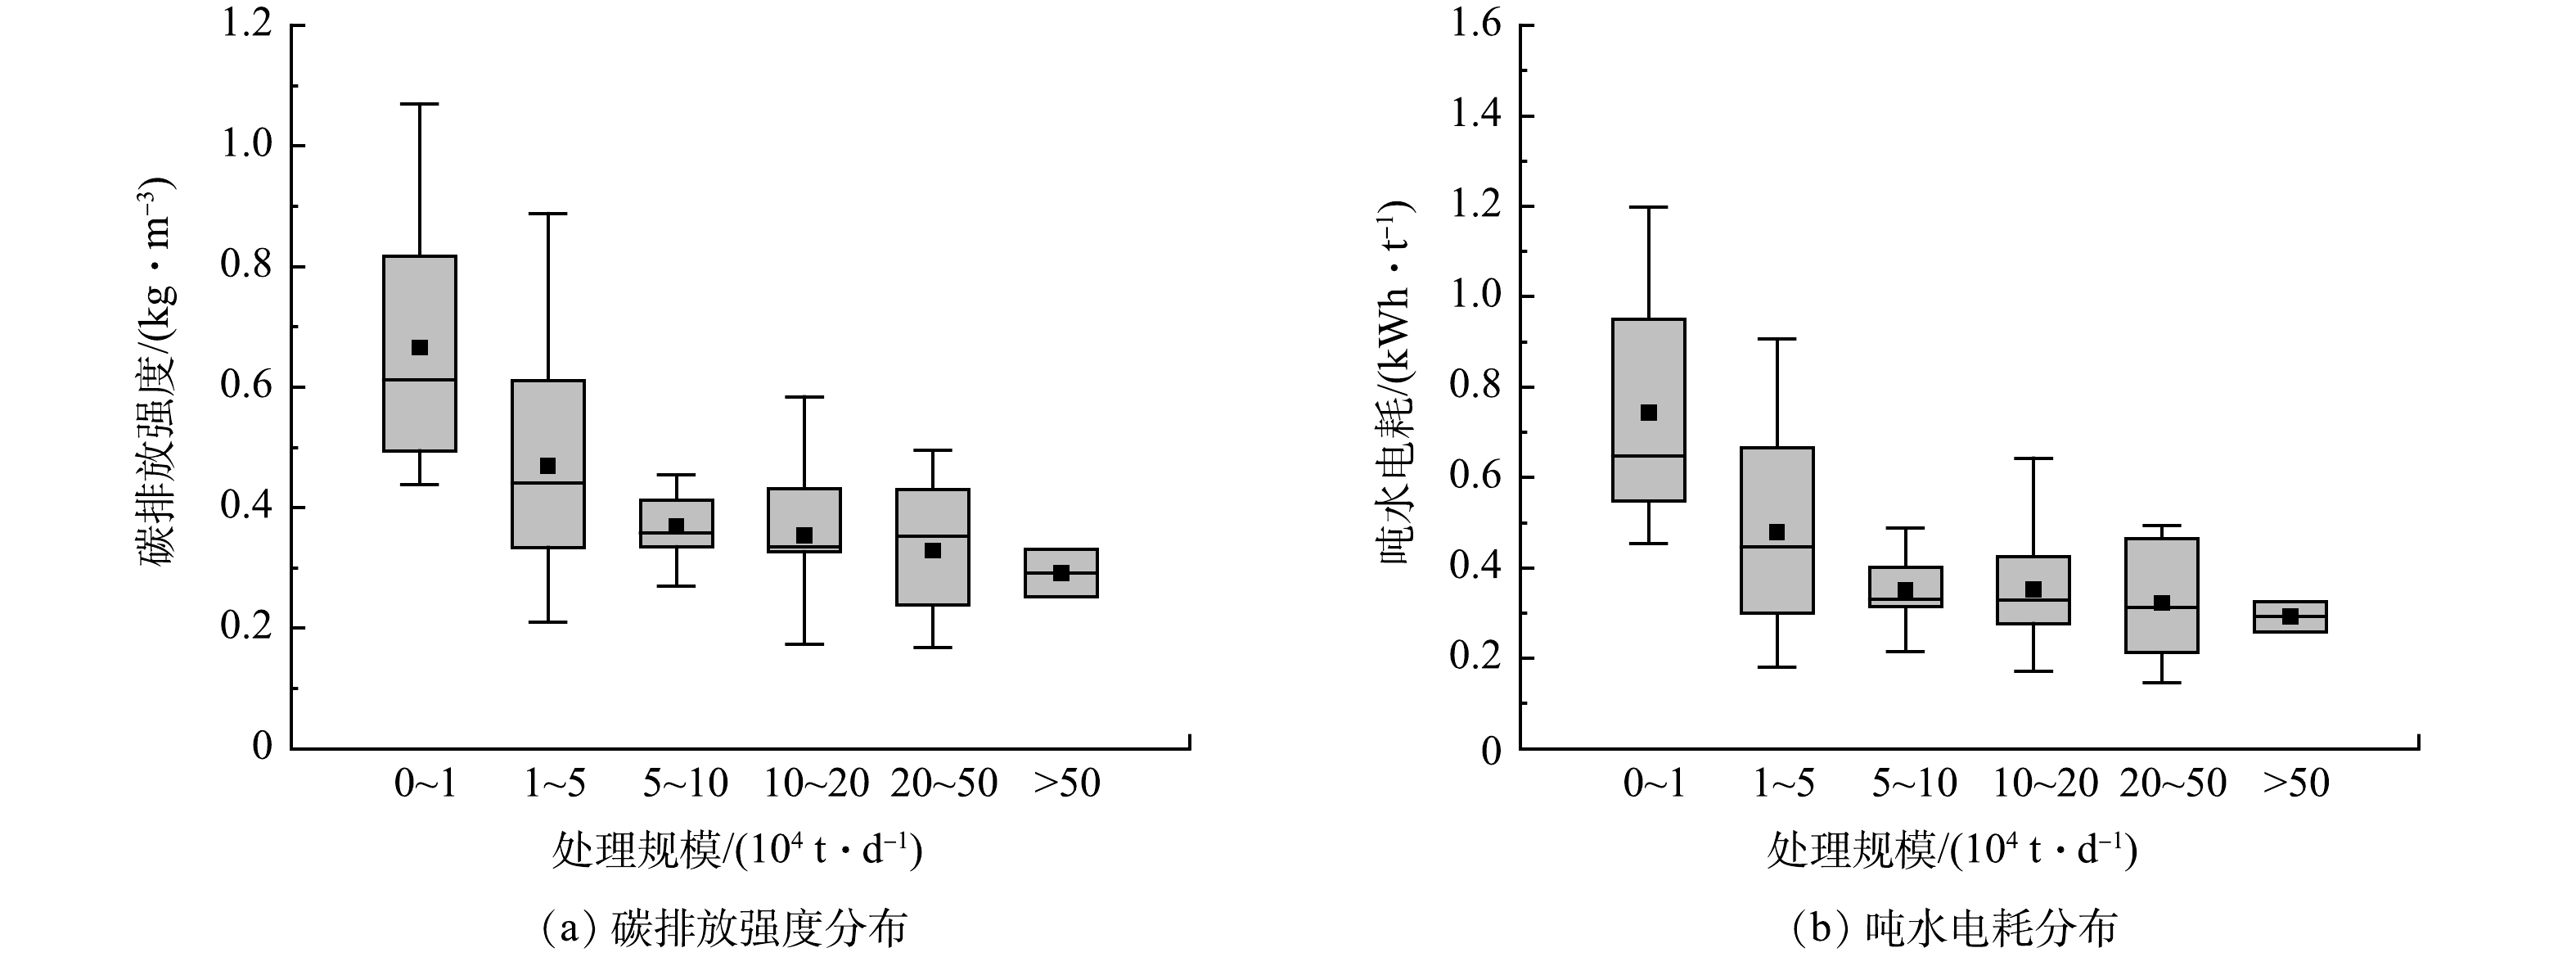
1)处理规模。图5(a)展示了不同处理规模的污水厂碳排放强度分布。整体而言,处理规模小于1×10⁴ t·d−1的污水厂,平均碳排放强度高达0.550 kg·m−3。随着处理规模增大,对应污水厂平均碳排放强度显著下降,处理规模为1×10⁴~5×10⁴ t·d−1的污水厂为0.456 kg·m−3。然而,处理规模进一步增大时,对应污水厂平均碳排放强度的降低幅度趋于平缓,处理规模为5×10⁴~10×104、10×104~20×104、20×104~50×104和>50×104 t·d−1(包括70.5×10⁴ t·d−1和130.5×10⁴ t·d−1 2座污水厂)的污水厂分别为0.374、0.355、0.310和0.280 kg·m−3。由此可见,污水厂处理规模仅在较小时对碳排放强度有较大影响,但高于5×10⁴ t·d−1时碳排放强度受处理规模影响较小。
污水厂碳排放强度随处理规模的变化趋势可由污水处理规模效应来解释[6, 30]。当污水厂处理规模很小时,水处理设备运行效能低,吨水电耗高(处理规模为0×104~1×10⁴ t·d−1的污水厂平均电耗为0.616 kWh·t−1,图5(b)),导致碳排放强度较高。当处理规模较大时,设备运行效能高,呈现出明显的规模效应,吨水电耗大幅降低(处理规模为1×10⁴~5×10⁴ t·d−1的污水厂平均电耗为0.469 kWh·t−1),碳排放强度也随之降低。当处理规模达到一定程度后,处理规模继续提高对设备运行效能的提升无显著影响,此时吨水电耗不再明显变化(如处理规模为20×104~50×104和>50×104 t·d−1的污水厂平均电耗分别为0.302 kWh·t−1和0.282 kWh·t−1),碳排放强度降低幅度有限。
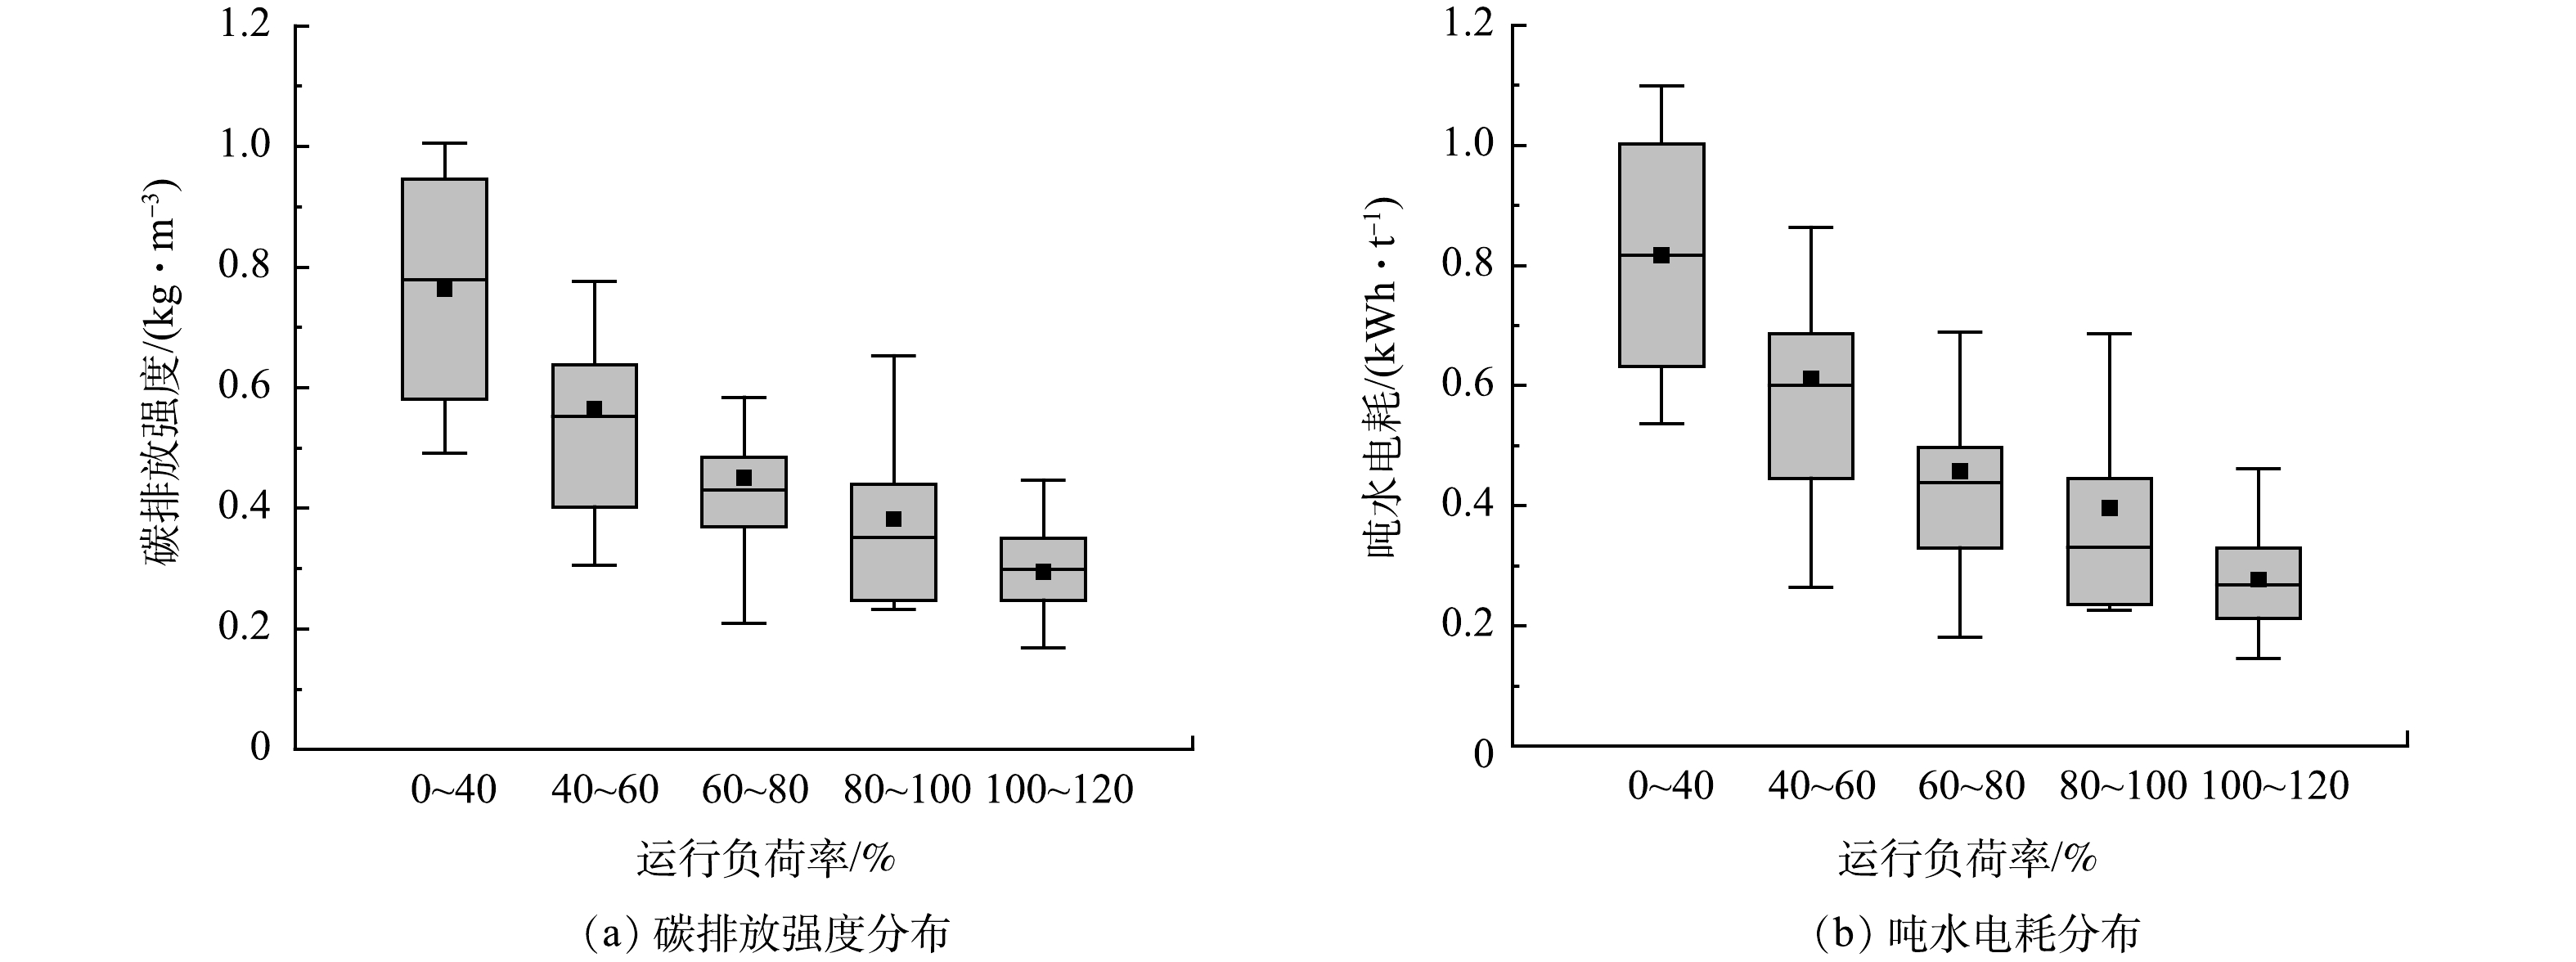
2)运行负荷率。图6(a)展示了不同运行负荷率污水厂的碳排放强度分布。由图明显可见,污水厂碳排放强度随运行负荷率增高而降低。运行负荷率低于40%的污水厂平均碳排放强度高达0.729 kg·m−3,而运行负荷率为40%~60%和60%~80%的污水厂平均碳排放强度则大幅降至0.492和0.431 kg·m−3,运行负荷率为80%~100%和略高于100% (100%~120%)的污水厂平均碳排放强度最低,仅分别为0.313 kg·m−3和0.258 kg·m−3。
污水厂运行负荷率对其电耗水平具有重要影响[6]。由于所研究污水厂多数使用定频水泵,运行负荷率较低时,设备利用率低导致电耗较高(运行负荷率小于40%的污水厂平均电耗为0.765 kWh·t−1,图6(b)),使得碳排放强度较高。随运行负荷率提高,水处理设备利用率增大,电耗水平降低(运行负荷率为40%~60%和60%~80%的污水厂平均电耗分别为0.532 kWh·t−1和0.432 kWh·t−1),碳排放强度也随之降低。当运行负荷率接近污水厂设计值时,设备得以充分利用,运行效能最高,吨水电耗大大降低(运行负荷率为80%~100%和100%~120%的污水厂平均电耗分别为0.306 kWh·t−1和0.252 kWh·t−1),碳排放强度最低。
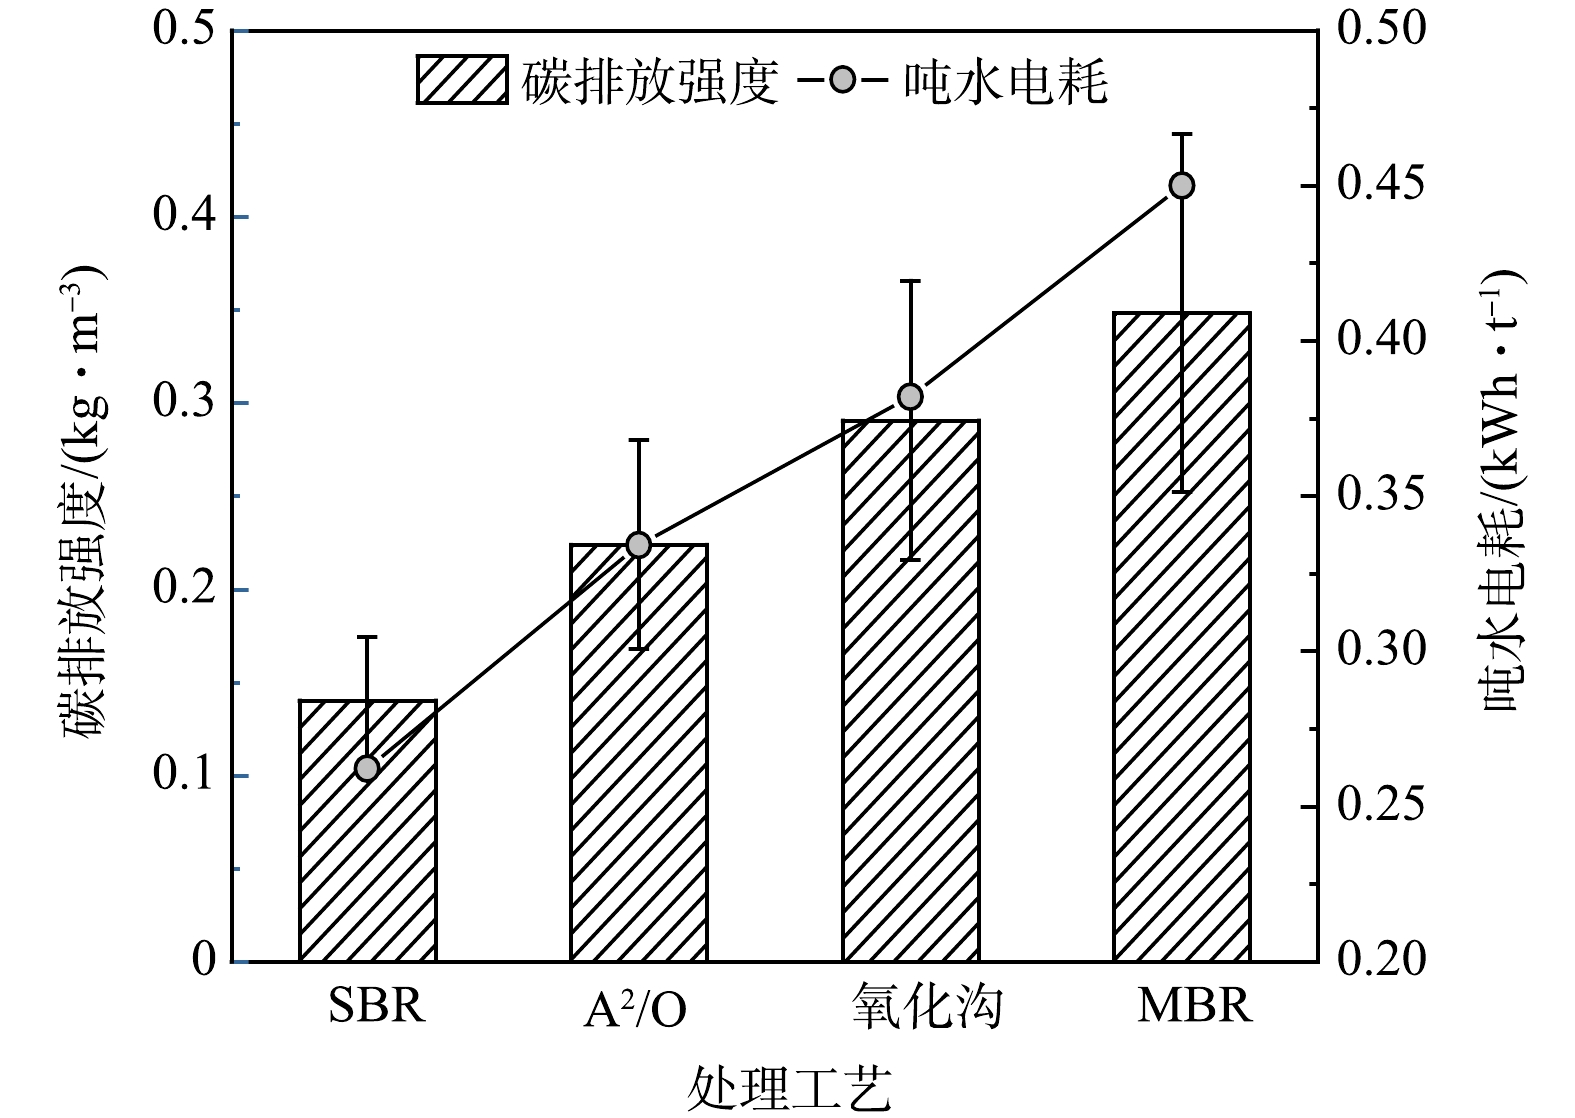
3)处理工艺。不同污水处理工艺因进水方式、处理水量、曝气量、污水/污泥回流等方面的不同,能耗有较大差异,直接影响处理单位体积污水产生的电耗碳排放,进而导致碳排放强度的差别[6, 29-30]。本研究对59座污水厂碳排放强度按所使用处理工艺进行了分类统计分析,因碳排放强度同时也受处理水量和运行负荷率等因素影响,为更合理比较不同处理工艺碳排放水平,参考《污水处理厂低碳运行评价技术规范》中方法对碳排放强度进行了加权修正处理[25]。如图7所示,不同污水厂的碳排放强度受处理工艺影响明显。SBR类工艺(如CASS、CAST工艺)污水厂由于其工艺流程简单、处理设备少,吨水电耗较低(平均为0.26 kWh·t−1),碳排放强度相对最低(平均值为0.140 kg·m−3)。A2/O类工艺(如倒置A2/O、多模式A2/O工艺)和氧化沟类工艺(如微曝氧化沟)污水厂由于污水、污泥回流量大,平均吨水电耗明显增加(平均值分别为0.33 kWh·t−1和0.38 kWh·t−1),导致碳排放强度较大(平均值分别为0.224 kg·m−3和0.291 kg·m−3)。MBR工艺污水厂由于膜池系统对保证泥水分离、提高污泥传氧速率、避免膜污染等方面有较高要求,水泵流量和曝气量大,导致平均吨水电耗最高(0.45 kWh·t−1),碳排放强度也最高(平均值为0.348 kg·m−3)。
由于各污水厂诸多工艺参数上各有差异,为更直观说明处理工艺对污水厂碳排放水平的影响,本研究选取了5座不同工艺污水厂进行比较,选择的污水厂尽可能在设计/处理规模、进/出水水质等方面相近,进水来源均为生活污水、电耗碳排放占比均在80%以上,其碳排放数据列于表6。由表6可见,3座设计规模为1.0×104~1.1×104 t·d−1、处理规模为0.5×10⁴~0.6×10⁴ t·d−1的污水厂吨水电耗和碳排放强度大小排序皆为WWTP1(CASS工艺)<WWTP2(改良氧化沟工艺)<WWTP3(A2/O工艺)。WWTP5(A2/O+MBR工艺)尽管污染物削减量低于规模相近的WWTP4(A2/O工艺),前者吨水电耗和碳排放强度都远远高于后者。
污水处理中N2O作为脱氮过程的副产物,主要在硝化和反硝化反应中产生,生成途径多样、机理复杂,故通常采用基于实测经验值的排放因子法对其进行碳排放核算。溶解氧浓度(DO)被广泛认为对N2O生成有重要影响,对N2O产生起关键作用的硝化细菌和反硝化过程中Nos还原酶对DO比较敏感,硝化过程中低DO和反硝化过程中DO的存在都会促进N2O生成[14, 18, 31-34]。A2/O类工艺污水厂厌氧区、缺氧区、好氧区含氧量梯度分明且便于调节,有利于硝化/反硝化作用进行,脱氮较为彻底,N2O产量较小(N2O排放因子为0.004 66 kg·kg−1,平均碳排放占比9.8%)。氧化沟类工艺虽然属于完全混合式活性污泥法,在池体内部无物理分割,但沿推流方向上仍存在较大的溶解氧梯度,脱氮效果较好(N2O排放因子为0.006 41 kg·kg−1,平均碳排放占比11.1%)。SBR类工艺虽可以通过灵活控制运行方式来实现好氧、缺氧、厌氧状态交替,但由于其对不同工艺段时长和溶解氧控制要求严格,且反硝化阶段有机底物不足,从而影响脱氮效果,N2O产量较大(N2O排放因子为0.020 20 kg·kg−1,平均碳排放占比22.5%)。
污水处理中CH4生成比较公认的来源为厌氧阶段产CH4菌对有机物的转化,其中严格的厌氧环境是产CH4菌进行正常生理活动的基本条件[14, 18, 31, 39]。A2/O工艺厌氧段与其他工艺段空间界限明显,DO值低,适于CH4生成(CH4排放因子为0.014 2 kg·kg−1,平均碳排放占比2.1%)。周期性设置厌氧阶段的SBR类工艺和沿推流方向形成厌氧区的氧化沟类工艺虽然都存在CH4生成环境,但可能由于厌氧段的时间、体积和DO难以精确控制,CH4排放因子相比于A2/O工艺较低(CH4排放因子分别为0.010 0 kg·kg−1和0.009 6 kg·kg−1,平均碳排放占比分别为1.7%和1.5%)。
尽管不同工艺对污水厂N2O、CH4碳排放强度有较大影响,但需指出的是,这2种温室气体的生成同时受污水水质、处理工艺、运行工况及微生物种群结构影响,单纯处理工艺上的不同并不一定决定N2O、CH4产量的不同[14, 18]。
对于药剂碳排放,由于污水厂主要依据进水水质、水量及出水标准计算药剂投加量,且不同污水厂采用的碳源、混凝剂、絮凝剂、碱度药剂等不尽相同,加之部分污水厂为保证出水达标而过量投加药剂,所考察污水厂在药剂种类、用量、药剂碳排放因子上有较大差异,故药剂碳排放与污水处理工艺种类并无显著关联[30]。不过,对于采用MBR工艺的污水厂,因其需定期对MBR膜系统进行化学清洗,会消耗大量次氯酸钠、柠檬酸、氢氧化钠等药剂,相比工艺、水质相似且未采用MBR工艺代替二沉池的污水厂,药耗碳排放强度会有所提高。本研究1座采用A2/O的污水厂年均进水和出水BOD5分别为127.8 mg·L−1和1.1 mg·L−1,进水和出水TN分别为25.8 mg·L−1和7.8 mg·L−1。另一座采用A2/O+MBR工艺的污水厂(与前者隶属于同一公司)年均进水和出水BOD5分别为124.1 mg·L−1和1.0 mg·L−1,进水和出水TN分别为24.9 mg·L−1和7.9 mg·L−1。2座污水厂进水和出水水质接近,且后者除额外投加次氯酸钠和柠檬酸等药剂外,其他药剂种类、用量与前者相似,但其药剂碳排放强度(0.032 kg·m−3)明显高于前者(0.026 kg·m−3)。
4)耗氧污染物削减量。除处理规模、运行负荷率、处理工艺外,污水厂能耗与进出水水质有密切联系,污水厂吨水电耗很大程度上反映的是污染物削减水平[30]。本研究中基本所有污水厂出水污染物指标均执行国家一级A排放标准,且因多数污水厂出水受纳水体为流速缓慢的河涌,对排入水水质要求严格,各污水厂出水水质较高、差距较小(COD、BOD5、TN、NH3-N平均值分别为(11.4±3.8)、(2.2±1.1)、(7.3±2.2)、(0.32±0.18) mg·L−1),削减值与进水值对能耗影响基本一致。根据污水厂每日水质数据,除2座污水厂出水TN年度达标率分别为98.6%、98.9%、1座污水厂出水NH3-N年度达标率为99.7%外,其他污水厂出水COD、BOD5、TN、NH3-N年度达标率均为100%。由于污水厂电耗较大部分来源于生化池曝气,本研究将以耗氧污染物削减量为指标污染物来考察污染物削减水平对污水厂碳排放的影响。
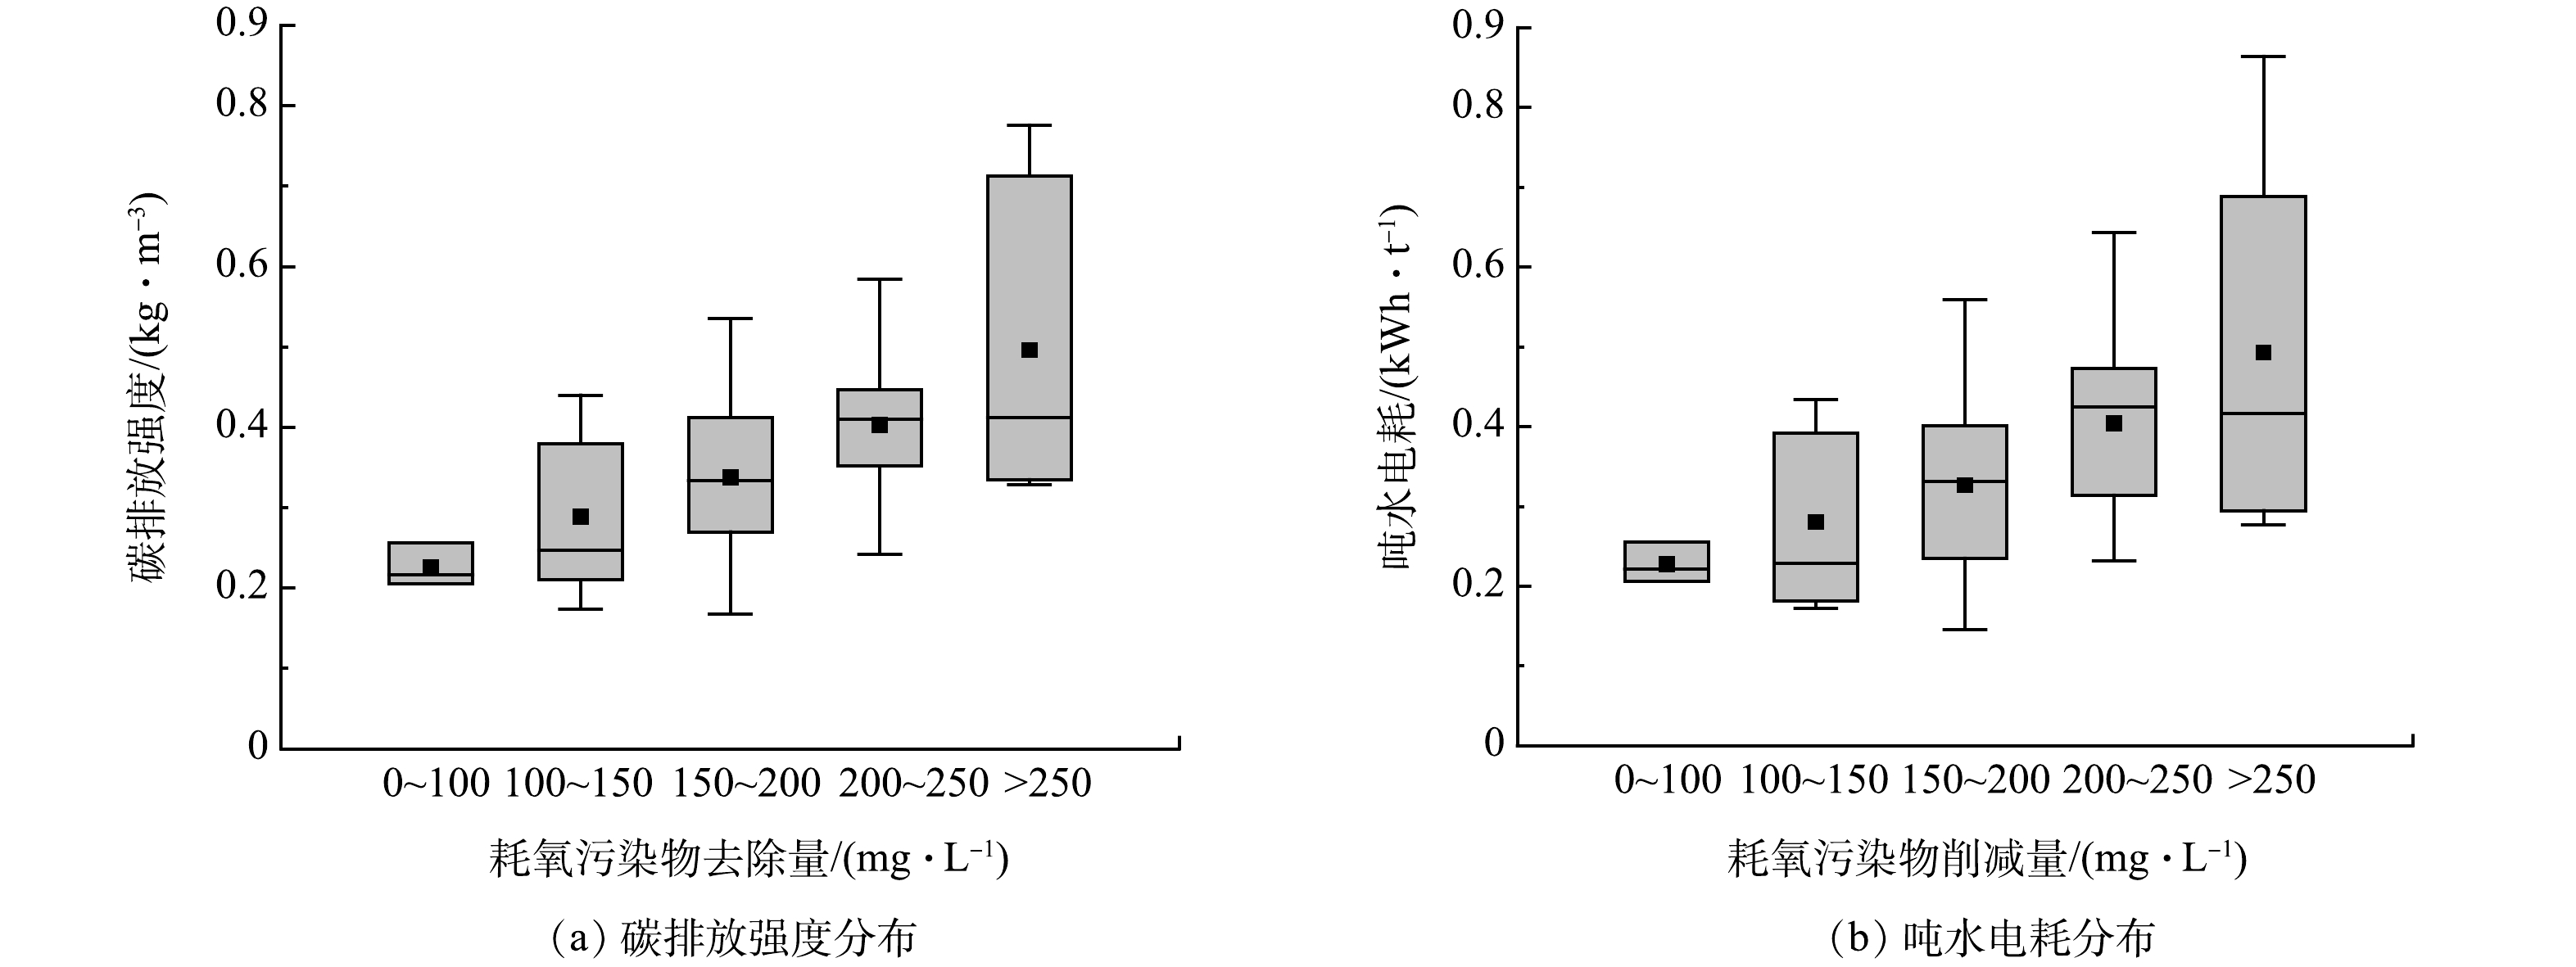
图8(a)展示了不同耗氧污染物削减量(即削减BOD5和TN所对应的耗氧质量浓度[25])的污水厂碳排放强度分布。由图明显可见,污水厂碳排放强度随耗氧污染物削减量升高而增大。耗氧污染物削减量为0~100 mg·L−1和100~150 mg·L−1的污水厂平均碳排放强度分别为0.238 kg·m−3和0.257 kg·m−3。随耗氧污染物削减量增加,对应污水厂平均碳排放强度稳步上升,耗氧污染物削减量为150~200 mg·L−1和200~250 mg·L−1的污水厂平均碳排放强度分别为0.303 kg·m−3和0.339 kg·m−3。耗氧污染物削减量高于250 mg·L−1时,由于包含2座对应值分别为363.1 mg·L−1和636.8 mg·L−1的污水厂,平均碳排放强度显著升高(0.411 kg·m−3)。
污水厂BOD5和TN去除过程需消耗大量氧气,直接影响电耗水平。与碳排放强度分布相似,污水厂吨水电耗同样随耗氧污染物削减量增加而升高(图8(b))。耗氧污染物削减量低的污水厂(此类污水厂本身进水耗氧污染物浓度较低)处理污水时所需曝气量、回流比低,吨水电耗低,耗氧污染物削减量为0~100 mg·L−1和100~150 mg·L−1的污水厂平均电耗分别为0.239 kWh·t−1和0.249 kWh·t−1,平均碳排放强度也较低。随耗氧污染物削减量增加,污水厂吨水电耗相应逐步提升,耗氧污染物削减量为150~200 mg·L−1和200~250 mg·L−1的污水厂平均电耗分别为0.295 kWh·t−1和0.340 kWh·t−1,平均碳排放强度较高。耗氧污染物削减量高于250 mg·L−1的污水厂平均电耗最高,达到0.387 kWh·t−1,平均碳排放强度最高。由此可见,在出水达标且不影响受纳水体整体水质的前提下,若污水厂尚无其他节能降耗措施,如能尽量避免对进水过度净化,污水处理电耗及碳排放强度也可有效降低。
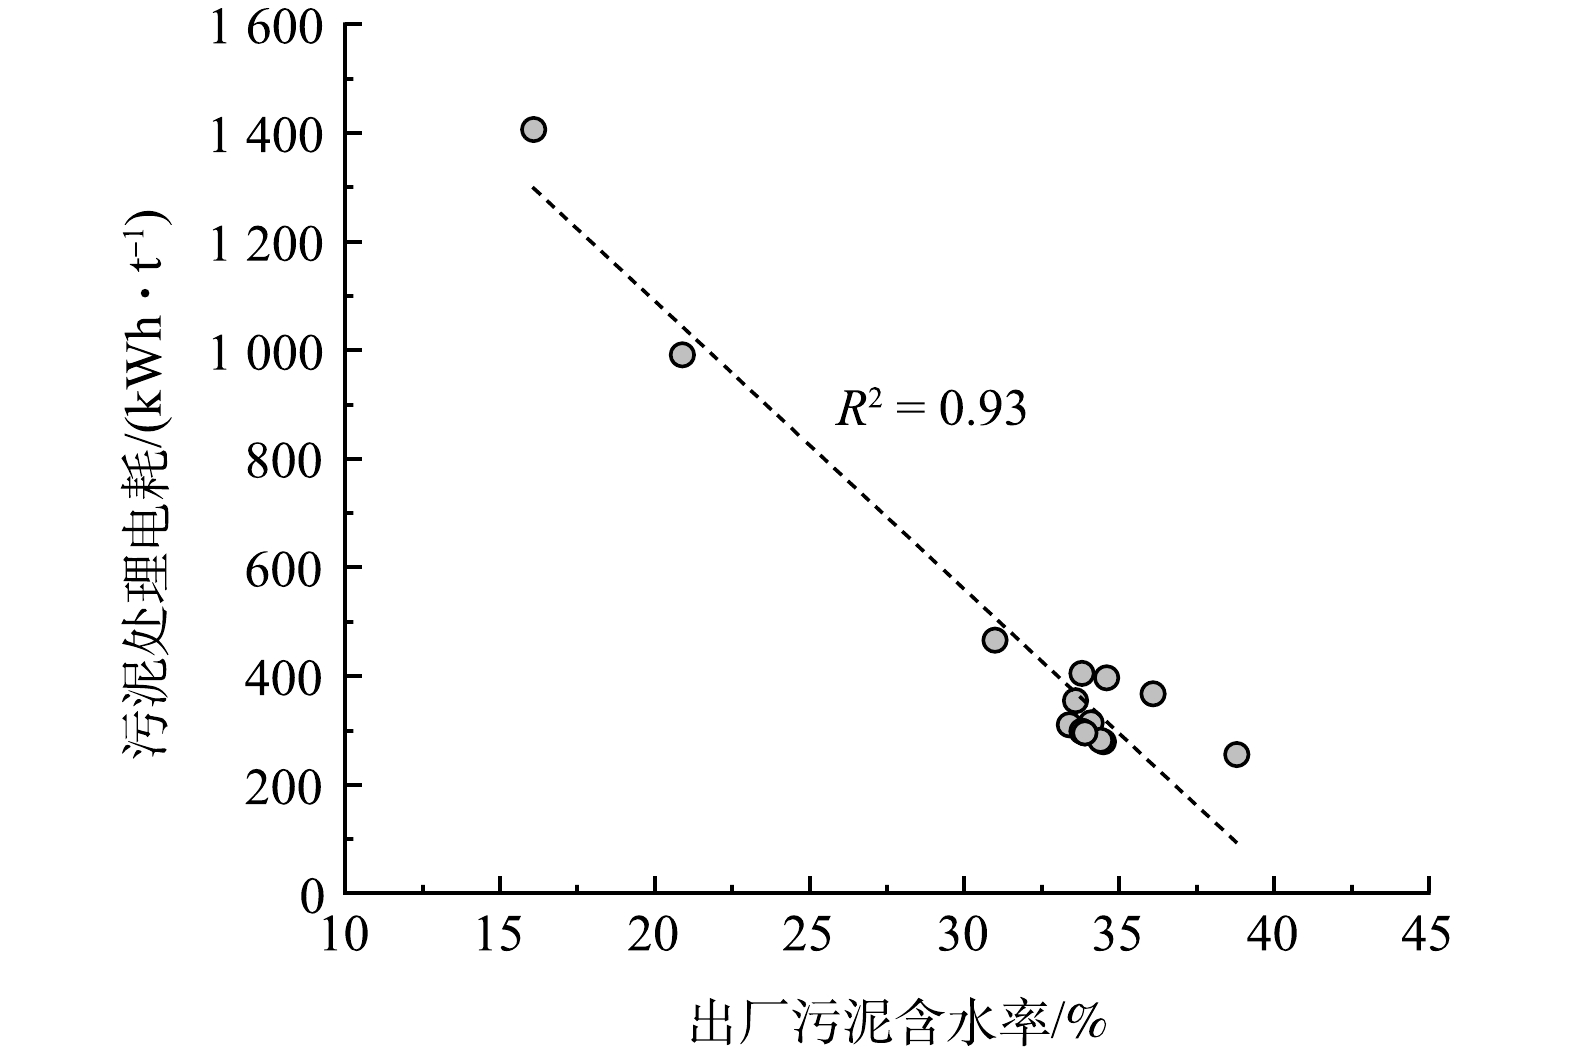
5)干化污泥含水率。污水厂产生的大量剩余污泥,一般需经浓缩、脱水、干化处理降至一定含水率方能运至厂外,因此出厂(干化)污泥含水率直接影响污泥处理能耗,进而影响污水厂碳排放[40]。本研究中污水厂均采用重力浓缩+机械脱水+电力热干化工艺处理污泥,其中有16座污水厂对污泥处理单元电耗进行了单独计量。如图9所示,16座污水厂污泥处理电耗(处理单位重量绝干污泥(DS)耗电量)随干化污泥含水率(年加权均值)降低而升高(R2 = 0.93)。干化污泥含水率为38.8%的污水厂,污泥处理电耗为255.1 kWh·t−1,而干化污泥含水率为16.1%的污水厂,污泥处理电耗高达1 405.6 kWh·t−1。污泥处理电耗升高将导致污水厂碳排放量和排放强度提高,但由于16座污水厂污泥处理电耗量仅占其总电耗量的8.7%~26.3%,污泥处理电耗碳排放仅占污水厂总碳排放量的6.9%~18.6%,因此干化污泥含水率对污水厂碳排放强度影响并不显著。本研究中污泥处理机制为物化作用,不涉及温室气体直接排放,除部分污水厂在此阶段投加少量辅助药剂外,污泥处理碳排放基本源于电力消耗,故污泥处理环节对其他类别碳排放强度影响很小。而因污水厂电耗主要取决于污水处理段曝气、污水提升等与工艺、水量、水质密切相关的环节,不同污水厂干化污泥含水率对其他类型碳排放比例并无规律性影响。不过,对于单个污水厂,在较短时期内水量、水质相对稳定,随污泥干化程度增大,电耗类碳排放比例增加,其他类别碳排放比例相应降低。如某20×104 t·d−1 A2/O工艺污水厂2021年3月中旬某不连续3日的干化污泥含水率分别为26.6%、31.6%、36.8%,电耗碳排放比例由90.6%降至83.6%,而CH4、N2O、药耗碳排放比例分别上升了0.8%、5.6%、1.0%。值得指出的是,污水厂在出厂污泥含水率达标前提下,应尽量避免过度干化,以降低生产能耗和碳排放。
基于前述分析,为进一步确定不同因素对污水厂碳排放水平影响,本研究利用SPSS软件对污水厂处理规模、运行负荷率、处理工艺、耗氧污染物削减量、干化污泥含水率与碳排放强度关系进行了多元线性回归分析。由于处理工艺属于分类变量,在进行线性回归分析前,先通过创建哑变量将其转换为了连续变量,并以SBR工艺类为工艺分类参照。分析结果显示,多元线性回归拟合度较高(R2 = 0.708),模型建立较为理想。如表7所示,所考察因素VIF值较低,表明不同因素间共线性不强。运行负荷率(P<0.001)、耗氧污染物削减量(P=0.002)是具有统计显著性的影响因素,且分别与污水厂碳排放强度呈负相关、正相关关系。而与前述影响因子分析相一致,处理规模(处理规模大于5×10⁴ t·d−1时污水厂碳排放强度无明显变化)、干化污泥含水率(污泥干化碳排放占比较小)与污水厂碳排放强度均无显著相关性。水处理工艺因素方面,A2/O类和氧化沟类工艺P<0.05,说明二者与污水厂碳排放强度显著相关,而MBR类P值略大于0.05,与碳排放强度相关性不强,这可能是由于参与统计的MBR类工艺样本量过小或不同污水厂MBR膜池工艺条件差别较大导致碳排放强度范围较大,从而影响了因素的显著相关性。
通过前述分析可知,处理工艺和运行参数等对污水厂碳排放存在不同程度影响。总体而言,污水厂可通过采取降碳和替碳措施实现低碳运营,其中降碳措施包括通过工艺优化、设备提升、调控升级等方法来实现节能/药降耗,替碳措施主要包括物料回用、能源回收、清洁能源利用等。上述低碳途径理论上可有效降低污水厂碳排放,但由于污水厂自身经济、技术等层面的限制和污水处理政策的要求,低碳措施应用存在一定难度。根据前期实地调研,污水厂生产运营中低碳措施应用存在的主要难点包括:污水厂通过提高运行负荷率、在达标的前提下适当降低出水水质/提高出厂污泥含水率等措施也能显著实现节能/药降耗,但排水管网调度与污水厂运行需求不一致,协同管理程度不高,污水厂运行负荷率无法稳定维持在较高水平;污水厂出水受纳水体自身水质较高,倒逼污水厂处理强度提升来确保受纳水体水质不受影响,进而增加污水处理能耗/药耗;较多城市提倡对污水厂出厂污泥进行焚烧处置,其含水率必须降至较低值方可满足污泥焚烧工艺要求;除污水厂或市政单位回用少量处理后中水满足清洁、绿化等需求,外部单位使用意愿不高;光伏发电虽能降低外购电力使用量,但其建设及后续维护成本较高,且因气象、季节的变化增加系统运行不稳定性,对供配电系统管理要求较高。由此可见,污水厂的减碳措施需结合自身特点及现行政策要求来进行选择、调整,并尽量实现污水处理全流程协同运行。
针对本研究所考察省份的污水厂,较为可行的低碳运营建议如下:对拟新建污水厂,应贴近实际水处理需求,确定设计规模及处理工艺,选择合适的处理设备或变频设备,合理搭配设备机组;推动污水厂与管网一体化进程,针对不同季节、时段进水量波动,优化进水调度方案,使污水厂运行负荷率处于合理水平,提高处理设备运行效率;在出水水质和出厂泥质达标前提下,尽量选择低能耗处理工艺、避免污水/污泥过度处理。
由于获取数据有限,此次研究仅从整体层面对所考察城镇污水处理厂进行碳排放特征分析。后续将在此基础上对各个工艺环节的碳排放(污水处理碳足迹)进行深入分析,以进一步确定影响污水厂碳排放的关键环节和因素,助力污水处理行业低碳发展。
-
1)2021年南方某省59座污水厂碳排放总量为0.02×10⁴~11.98×10⁴ t,其中电耗为碳排放主要来源。碳排放强度较为分散,为0.168~1.070 kg·m−3,与文献中我国其他地区接近,总体值为0.326 kg·m−3,略低于我国其他地区。
2)结合SPSS多元线性回归分析结果,该省污水处理厂碳排放强度受运行负荷率、耗氧污染物削减量、处理工艺因素影响较大,而受处理规模、干化污泥含水率影响较小。运行负荷低的污水厂设备运行效率低、吨水电耗高,导致碳排放强度较高。耗氧污染物削减量大的污水厂对曝气强度和污水回流量要求高,增加了碳排放强度。采用高能耗处理工艺的污水厂碳排放强度较高,不同处理工艺整体碳排放强度大致呈MBR类工艺>氧化沟类工艺> A2/O类工艺>SBR类工艺。另外,由于污水厂达到一定处理规模后规模效应不再明显,对碳排放强度影响有限。污泥干化处理虽然产生一定的碳排放,但其电耗占污水厂总电耗比例较低,对污水厂碳排放强度影响不显著。
3)由于污水厂自身经济、技术等层面限制和污水处理政策要求,低碳措施应用存在一定的难度。污水厂减碳措施需结合自身特点及现行政策要求来进行选择、调整,并尽量实现污水处理全流程协同运行。
南方某省城镇污水处理厂碳排放特征
Characteristics of carbon emission from municipal wastewater treatment plants in a south-China province
-
摘要: 城镇污水处理厂是城市碳排放的重要来源。在双碳政策下,探明城镇污水处理厂碳排放特征是污水厂实现低碳运营的基础。本研究参考现有污水处理厂碳排放核算标准,对南方某省59座城镇污水处理厂2021年度碳排放进行了核算,并结合能耗分析了不同类型污水厂碳排放强度与处理规模、运行负荷率、处理工艺、耗氧污染物削减量、干化污泥含水率的关系。结果表明,所考察城镇污水处理厂2021年度碳排放量为0.02×10⁴~11.98×10⁴ t,其中电耗碳排放是主要碳排放来源,占比为62.6%~98.9%,总体占比79.7%。污水厂的碳排放强度为0.168~1.070 kg·m−3,均值为0.326 kg·m−3,且多数低于国内其他地区强度值。碳排放强度与吨水电耗呈正相关,结合SPSS多元线性回归分析,结果显示运行负荷率、耗氧污染物削减量、处理工艺均显著影响污水厂碳排放水平,而处理规模、干化污泥含水率对污水厂碳排放水平无显著影响。以上研究结果可为该省城镇污水处理厂实现低碳运营提供参考,同时也可为其他省市城镇污水处理厂碳排放特征研究提供参考。Abstract: Municipal wastewater treatment plants (WWTPs) are notable sources of carbon emission for cities in China. With the policy implementation of carbon peak and carbon neutrality, it is fundamental to investigate carbon emission from WWTPs for their low-carbon operation. Based on the available standards, the carbon emissions from 59 WWTPs in a south-China province in 2021 were calculated. And the influences of treatment capacity, loading rate, treatment process, reduction in oxygen-demanding pollutants and moisture content of dried sludge on carbon emission intensity in different types of WWTPs were analyzed combined with power consumption. Results show that the carbon emission from the studied WWTPs in 2021 ranged from 0.02×10⁴ to 11.98×10⁴ t, of which the emission resulting from electricity consumption (79.7% with the range of 62.6%~98.9%) was the key part. Moreover, the carbon emission intensities of the WWTPs were in the range of 0.168~1.070 kg·m−3 (with an average value of 0.326 kg·m−3), most of which were lower than the corresponding values in other parts of China. Furthermore, SPSS multiple linear regression analysis indicated that carbon emission intensity was found to correlate positively with specific electricity consumption, and loading rate, reduction in oxygen-demanding pollutants and treatment process all significantly affected carbon emission intensities of WWTPs, while treatment capacity and moisture content of dried sludge had insignificant effects on carbon emission intensities. The research result was expected to contribute to the low-carbon operation of WWTPs in the cities of the target province and also provides useful references to the study of WWTPs carbon emission in other parts of China.
-

-
表 1 污水厂规模分布
Table 1. Scale distribution of WWTPs
设计规模/(104 t·d−1) 数量/座 数量占比/% 总设计规模/(104 t·d−1) 总设计规模占比/% 总处理规模/(104 t·d−1) 总处理规模占比/% 0~1 10 16.9 6.2 0.8 3.6 0.5 1~5 19 32.2 59.4 7.6 39.1 5.7 5~10 12 20.3 96.7 12.3 77.3 11.4 10~20 8 13.6 124.9 15.9 95.4 14.0 20~50 7 11.9 253.9 32.3 215.7 31.7 > 50 3 5.1 250.0 31.8 250.9 36.9 表 2 污水厂处理工艺分布
Table 2. Process distribution of WWTPs
处理工艺 数量/座 数量占比/% 总设计规模/(104 t·d−1) 总设计规模占比/% 总处理规模/(104 t·d−1) 总处理规模占比/% A2/O类 27 45.8 455.8 58.0 423.4 62.2 SBR类 13 22.0 97.7 12.4 94.2 13.8 MBR 10 16.9 142.5 18.1 81.5 12.0 氧化沟类 6 10.2 43.0 5.5 33.5 4.9 其他 3 5.1 47.2 6.0 47.8 7.0 表 3 不同处理工艺污水厂CH4和N2O排放因子
Table 3. Emission factors of CH4 and N2O for WWTPs with different treatment processes
处理工艺 CH4排放因子/(kg·kg−1) N2O排放因子/(kg·kg−1) A2/O类 0.014 2 0.004 66 SBR类 0.010 0 0.020 20 氧化沟类 0.009 6 0.006 41 表 4 不同药剂碳排放因子
Table 4. Carbon emission factors of different chemicals
类别 药剂名称 药剂碳排放因子/(kg·kg−1) 碳源 乙酸钠 0.623 糖浆 1.6 甲醇 0.985 混凝剂/絮凝剂及助凝剂 聚丙烯酰胺 1.48 聚合氯化铝 0.53 聚合氯化铝铁 2.5 硫酸铝 0.16 生石灰 1.74 消毒剂 次氯酸钠 0.99 液氯 0.93 膜清洗剂 柠檬酸 1.6 氢氧化钠 (50%) 1.12 表 5 国内外城镇污水处理厂碳排放强度
Table 5. Global carbon emission intensities of WWTPs
污水厂
所在地统计年份 处理工艺 处理规模/(104 t·d−1) 碳排放强度/(kg·m−3) 参考文献 浙江省 2019 CAST 4.00 0.790 [22] CAST+MBBR 1.040 西安市 2017 倒置A2/O 50.00 0.498 [15] 深圳市 2012 A2/O 35.00 0.360 [12] 重庆市 2009 多数为氧化沟或SBR 251.24 1.439(多厂均值,生活污水) [16] 0.526(多厂均值,工业废水) 北京市 2014 A/O 50.00 0.404 [14] SBR 8.00 0.864 四川省 2016 CASS 0.20 0.650 [19] 中国北方 2006 A2/O 60.00 0.470 [13] 波兰 2017 A2/O 2.30 0.600 [35] SBR 0.70 0.700 JHB 0.65 0.700 A2/O 0.87 0.600 A2/O 0.85 0.800 芬兰 2017 AO-AO 2.20 0.700 [35] AO 1.35 0.600 AO 2.60 0.600 AO+生物滤床 4.80 0.700 发达国家 1995~2012 A2/O, SBR, BAF, MBR等 0.02~2 0.390(多厂均值) [36] 发展中国家 1995~2012 A2/O, SBR, BAF, MBR等 0.02~2 0.530(多厂均值) [36] 西班牙 2011 A2/O 0.93 0.224 [37] 预缺氧+A2/O 7.42 0.242 表 6 4座不同处理工艺污水厂碳排放数据
Table 6. Carbon emission data of 4 WWTPs with different treatment processes
污水
处理厂设计规模/
(104 t·d−1)处理规模/
(104 t·d−1)处理工艺 进水水质/(mg·L−1) 出水水质/(mg·L−1) 吨水电耗/
(kWh·t−1)电耗碳
排放占比/%碳排放
强度/
(kg·m−3)COD BOD5 TN COD BOD5 TN WWTP1 1.0 0.5 CASS 94.9 41.9 16.5 8.4 1.3 7.3 0.520 86.1 0.485 WWTP2 1.1 0.6 改良氧化沟 131.0 58.9 19.0 6.9 1.1 7.5 0.622 86.0 0.582 WWTP3 1.0 0.5 A2/O 110.5 40.8 16.7 12.1 1.6 8.3 0.673 88.9 0.609 WWTP4 5.0 3.7 A2/O 243.9 122.3 31.6 9.8 1.1 8.3 0.347 82.4 0.519 WWTP5 5.0 3.5 A2/O+MBR 209.0 106.7 27.7 8.4 2.8 9.0 0.824 84.6 0.953 注:水质为年加权平均值。 表 7 污水厂碳排放多元线性回归分析相关数据
Table 7. Related data of multiple linear regression analysis for carbon emissions of WWTPs
污水厂碳排放影响因素 回归分析系数 标准化系数Beta 显著性 VIF 处理规模 −0.059 0.635 1.605 运行负荷率 −0.825 < 0.001 1.866 A2/O类 0.303 0.030 1.159 氧化沟类 0.322 0.028 1.294 MBR类 0.221 0.058 1.420 耗氧污染物削减量 0.495 0.002 1.530 干化污泥含水率 −0.047 0.753 1.141 -
[1] HUANG Y J,MENG F L,LIU S M,et al. China's enhanced urban wastewater treatment increases greenhouse gas emissions and regional inequality[J]. Water Research, 2023, 230: 119536. doi: 10.1016/j.watres.2022.119536 [2] 陆家缘. 中国污水处理行业碳足迹与减排潜力分析[D]. 合肥: 中国科学技术大学, 2019. [3] 中华人民共和国国务院. 水污染防治行动计划[EB/OL]. [2023-06-28].https: //www.gov.cn/zhengce/content/2015-04/16/content_9613.htm. [4] SU H S,YI H,GU W Y,et al. Cost of raising discharge standards:A plant-by-plant assessment from wastewater sector in China[J]. Journal of Environmental Management, 2022, 308: 114642. doi: 10.1016/j.jenvman.2022.114642 [5] 郭恰. 高标准出水对污水厂实现双碳目标的影响及减排对策分析[J]. 净水技术, 2022, 41(s2): 111-114+126. [6] XIE T, WANG C W. Impact of different factors on greenhouse gas generation by wastewater treatment plants in China[C]//IEEE. 2011 International Symposium on Water Resource and Environmental Protection. 2011: 1448-1451. [7] 闫旭,韩云平,李琦路,等. 污水处理过程中温室气体产生研究进展[J]. 环境化学, 2015, 34(5): 853-862. doi: 10.7524/j.issn.0254-6108.2015.05.2014092401 [8] XI J R,GONG H,ZHANG Y J,et al. The evaluation of GHG emissions from Shanghai municipal wastewater treatment plants based on IPCC and operational data integrated methods (ODIM) [J]. Science of the Total Environment, 2021, 797: 148967. doi: 10.1016/j.scitotenv.2021.148967 [9] LIAO X W,TIAN Y J,GAN Y W,et al. Quantifying urban wastewater treatment sector's greenhouse gas emissions using a hybrid life cycle analysis method- An application on Shenzhen city in China[J]. Science of the Total Environment, 2020, 745: 141176. doi: 10.1016/j.scitotenv.2020.141176 [10] ZHOU X X,YANG F,YANG F,et al. Analyzing greenhouse gas emissions from municipal wastewater treatment plants using pollutants parameter normalizing method:a case study of Beijing[J]. Journal of Cleaner Production, 2022, 376: 134093. doi: 10.1016/j.jclepro.2022.134093 [11] 王雪松,宋蕾,白润英. 呼和浩特地区污水厂能耗评价与碳排放分析[J]. 环境科学与技术, 2013, 36(2): 196-199. doi: 10.3969/j.issn.1003-6504.2013.02.040 [12] 宋宝木,秦华鹏,马共强. 污水处理厂运行阶段碳排放动态变化分析:以深圳某污水处理厂为例[J]. 环境科学与技术, 2015, 38(10): 204-209. [13] 谢淘,汪诚文. 污水处理厂温室气体排放评估[J]. 清华大学学报 (自然科学版) , 2012, 52(4): 473-477. [14] 鲍志远. 典型城市污水处理工艺温室气体排放特征及减排策略研究[D]. 北京: 北京林业大学, 2019. [15] 张程. 污水处理系统碳排放规律研究与量化评价[D]. 西安: 西安理工大学, 2017. [16] 张成. 重庆市城镇污水处理系统碳排放研究[D]. 重庆: 重庆大学, 2011. [17] UCT工艺污水处理厂二氧化碳排放特性[D]. 镇江: 江苏大学, 2019. [18] 王金鹤. 城镇污水处理厂中温室气体的释放研究[D]. 济南: 山东大学, 2011. [19] 夏天虹,张清东,董桂君. 小城镇污水处理厂生命周期的碳排放评估[J]. 四川环境, 2018, 37(3): 135-140. doi: 10.3969/j.issn.1001-3644.2018.03.023 [20] 周政,李怀波,王燕,等. 低碳氮比进水AAO污水处理厂低碳运行[J]. 中国环境科学, 2022, 42(11): 5088-5099. doi: 10.3969/j.issn.1000-6923.2022.11.015 [21] BAO Z Y,SUN S C,SUN D Z. Assessment of greenhouse gas emission from A/O and SBR wastewater treatment plants in Beijing,China[J]. International Biodeterioration & Biodegradation, 2016, 108: 108-114. [22] 张玲丽,顾敦罡,陆嘉麒,等. MBBR用于某CAST工艺污水处理厂提标改造的效能及碳排放分析[J]. 环境工程技术学报, 2022, 13(2): 679-686. [23] IPCC. 2006 IPCC Guidelines for National Greenhouse Gas Inventories[R]. Japan: Institute for Global Environmental Strategies, 2006. [24] IPCC. 2019 Refinement to the 2006 IPCC guidelines for national greenhouse gas inventories[R]. Switzerland: Intergovernmental Panel on Climate Change, 2019. [25] 中国环境保护产业协会. 污水处理厂低碳运行评价技术规范: T/CAEPI 49-2022[S]. 北京: 中国标准出版社, 2022. [26] 中国城镇供水排水协会. 城镇水务系统碳核算与减排路径技术指南[M]. 北京: 中国建筑工业出版社, 2022. [27] 国家统计局能源统计司. 中国能源统计年鉴2022[M]. 北京: 中国统计出版社, 2023. [28] ZHANG J,SHAO Y,WANG H,et al. Current operation state of wastewater treatment plants in urban China[J]. Environmental Research, 2021, 195: 110843. doi: 10.1016/j.envres.2021.110843 [29] 杨敏,李亚明,魏源送,等. 大型再生水厂不同污水处理工艺的能耗比较与节能途径[J]. 环境科学, 2015, 36(6): 2203-2209. doi: 10.13227/j.hjkx.2015.06.038 [30] CRINI G,LICHTFOUSE E. Advantages and disadvantages of techniques used for wastewater treatment[J]. Environmental Chemistry Letters, 2019, 17(1): 145-155. doi: 10.1007/s10311-018-0785-9 [31] TUMENDELGER A,ALSHBOUL Z,LORKE A. Methane and nitrous oxide emission from different treatment units of municipal wastewater treatment plants in Southwest Germany[J]. PLOS ONE, 2019, 14(1): e0209763. doi: 10.1371/journal.pone.0209763 [32] DESLOOVER J,VLAEMINCK S E,CLAUWAERT P,et al. Strategies to mitigate N2O emissions from biological nitrogen removal systems[J]. Current Opinion in Biotechnology, 2012, 23(3): 474-482. doi: 10.1016/j.copbio.2011.12.030 [33] ZHANG W,PENG Y,REN N,et al. Improvement of nutrient removal by optimizing the volume ratio of anoxic to aerobic zone in AAO-BAF system[J]. Chemosphere, 2013, 93(11): 2859-2863. doi: 10.1016/j.chemosphere.2013.08.047 [34] PENG L,NI B J,YE L,et al. The combined effect of dissolved oxygen and nitrite on N2O production by ammonia oxidizing bacteria in an enriched nitrifying sludge[J]. Water Research, 2015, 73: 29-36. doi: 10.1016/j.watres.2015.01.021 [35] MAKTABIFARD M,AWAITEY A,MERTA E,et al. Comprehensive evaluation of the carbon footprint components of wastewater treatment plants located in the Baltic Sea region[J]. Science of the Total Environment, 2022, 806: 150436. doi: 10.1016/j.scitotenv.2021.150436 [36] COROMINAS L,FOLEY J,GUEST J S,et al. Life cycle assessment applied to wastewater treatment:State of the art[J]. Water Research, 2013, 47(15): 5480-5492. doi: 10.1016/j.watres.2013.06.049 [37] XU X. The carbon footprint analysis of wastewater treatment plants and nitrous oxide emissions from full-scale biological nitrogen removal processes in Spain[D]. Cambridge: Massachusetts Institute of Technology, 2013. [38] WANG H,YANG Y,KELLER A A,et al. Comparative analysis of energy intensity and carbon emissions in wastewater treatment in USA,Germany,China and South Africa[J]. Applied Energy, 2016, 184: 873-881. doi: 10.1016/j.apenergy.2016.07.061 [39] WANG J,ZHANG J,XIE H,et al. Methane emissions from a full-scale A/A/O wastewater treatment plant[J]. Bioresource Technology, 2011, 102(9): 5479-5485. doi: 10.1016/j.biortech.2010.10.090 [40] 戴晓虎,张辰,章林伟,等. 碳中和背景下污泥处理处置与资源化发展方向思考[J]. 给水排水, 2021, 57(3): 1-5. doi: 10.13789/j.cnki.wwe1964.2021.03.001 -


 下载:
下载:
