-
含碳气溶胶是大气气溶胶中的重要含碳组分,主要由元素碳(elemental carbon,EC)和有机碳(organic carbon,OC)组成[1]。元素碳EC在文献中也称为黑碳(black carbon,BC)或石墨碳[2],它具有较好的化学稳定性和良好的光吸收性,可以作为人为一次排放源的标识物质[3],主要是由化石燃料和生物质的不完全燃烧产生[4]。OC则是一种具有光散射性的混合气溶胶,来源既包括由排放源直接排放的一次有机碳(primary organic carbon,POC)又包括一些大气中气态前体物(如VOCs等)经过光化学反应、二次凝结凝聚及吸湿增长后生成的二次有机碳气溶胶(secondary carbon,SOC)[5-7]。研究表明,含碳气溶胶已对大气污染、气候的变化和人类身体健康产生非常多的影响[8-12],因此对含碳气溶胶的研究对大气污染和环境治理都有着重要意义。
长三角地区是中国经济最发达的地区之一,同时也是中国和世界PM2.5污染最为严重的地区之一[13]。近年来,在长三角地区对含碳气溶胶也展开了非常多的研究。吴梦龙等[14]分析了2011年南京市区和南京北郊工业区全年PM2.1中OC与EC的含量,发现工业区污染更加严重,OC、EC的含量和OC与EC的相关性更高的原因都是春冬两季燃煤量增加和气候原因导致。Wang等[15]则分析了花鸟岛中PM2.5和总悬浮颗粒物中的OC、EC和正构烷烃,发现OC、EC和正构烷烃主要集中于PM2.5中。张懿华等[16]分析上海城区中OC与EC的来源发现,OC与EC的主要来源是机动车尾气、燃煤排放、道路扬尘和生物质燃烧。同时PM2.5引起的灰霾和以O3为主要污染物的光化学污染形成的复合型污染,是目前中国面临的主要大气污染问题,尤其是在长三角地区、京津冀地区、珠三角地区以及西南四川盆地更为严重[17]。O3的强氧化性会促进大气化学反应的生成,从而产生更多的二次气溶胶,而气溶胶对O3的质量浓度也有影响。Feng等[18]对夏季西安及其周边地区一次高O3和PM2.5个例过程研究认为,高质量浓度的气溶胶显著降低O3的光解率并且使其质量浓度降低超过50.0 μg·m−3。蔡彦枫等[19]对个例中大气颗粒物影响近地面O3的过程进行模拟,发现大气颗粒物质量浓度的升高使得气溶胶光学厚度增加,造成O3净生成率下降。说明在大气复合型污染中,PM2.5与O3之间的相互作用十分复杂,气溶胶与O3之间的变化特征和相互关系需要进一步的研究分析。目前基于在线仪器长时间序列对南京地区OC、EC研究开展较少。
为进一步了解南京城区含碳气溶胶污染的变化趋势及季节分布特征等,本研究基于在线监测设备TCA08型总碳分析仪和AE-33型Aethalometer,初步分析了南京2019年4月19日—6月27日PM2.5中含碳气溶胶季节、日变化特征、对比分析了3次O3污染过程中的含碳气溶胶变化特征,以期为有效控制及治理南京含碳气溶胶污染提供基础资料和科学依据。
-
采样时间为2019年4月19日至2019年6月27日,采样点位于南京信息工程大学气象楼楼顶(32.2 °N,118.7 °E),距地面高度约40 m,平均海拔高度约62 m.其东面500 m左右是双向六车道的宁六路;龙王山风景区在东南方约900 m处,它的海拔约为100 m左右。观测点处在南京信息工程大学校区内东部,北侧多为住宅小区。在学校东南方6 km左右为南京工业园区,其中分布有扬子石化、南钢集团等各类大型化工和钢铁企业。
-
总碳(TC)的观测设备是北京赛克玛环保仪器有限公司生产的TCA08型总碳分析仪。设计原理包括:两个相同的用于采样和分析流量通道;样品采集在47 mm石英纤维滤膜上;燃烧室由不锈钢制成;通过两个通道交替采样和分析来实现连续操作;将采集的样品瞬间加热以将总碳转化为CO2;过滤的环境空气用作分析载气;对载气流中超过环境基线的大脉冲CO2积分计算以确定样品的总碳含量。采样时间为1 h,可以得到样品的总碳含量。黑碳(BC)通过AE-33型Aethalometer测量,以及通过TCA08总碳分析仪测定总碳(TC)的热学方法,将含碳气溶胶的有机碳(OC)分数确定为OC=TC-BC,并获得高时间分辨率的OC/EC数据。
本研究所涉及到2019年4月—2019年6月期间的大气污染物(PM2.5、PM10、O3、NO2、SO2、CO)小时质量浓度数据来源于中国环境监测总站的全国城市空气质量实时发布平台(http://106.37.208.233:20035/)。
气象要素来自于南京信息工程大学大气探测基地,包括温、压、湿、风和能见度,时间分辨率为1 h.
-
OC一般分为一次排放的一次有机碳POC和在大气环境中被二次污染所生成的二次有机碳SOC。就目前的各项研究来说,对POC和SOC的精确分离和计算非常难,各方法中最为广泛的分析方法为EC示踪法。由于EC的主要来源为一次排放且化学性质稳定,而一次源排放出的EC与POC相关性较好,一般假设监测的EC来源均来自于一次排放,基于这一假设,Lim等[20]提出了以下经验公式用来计算SOC:
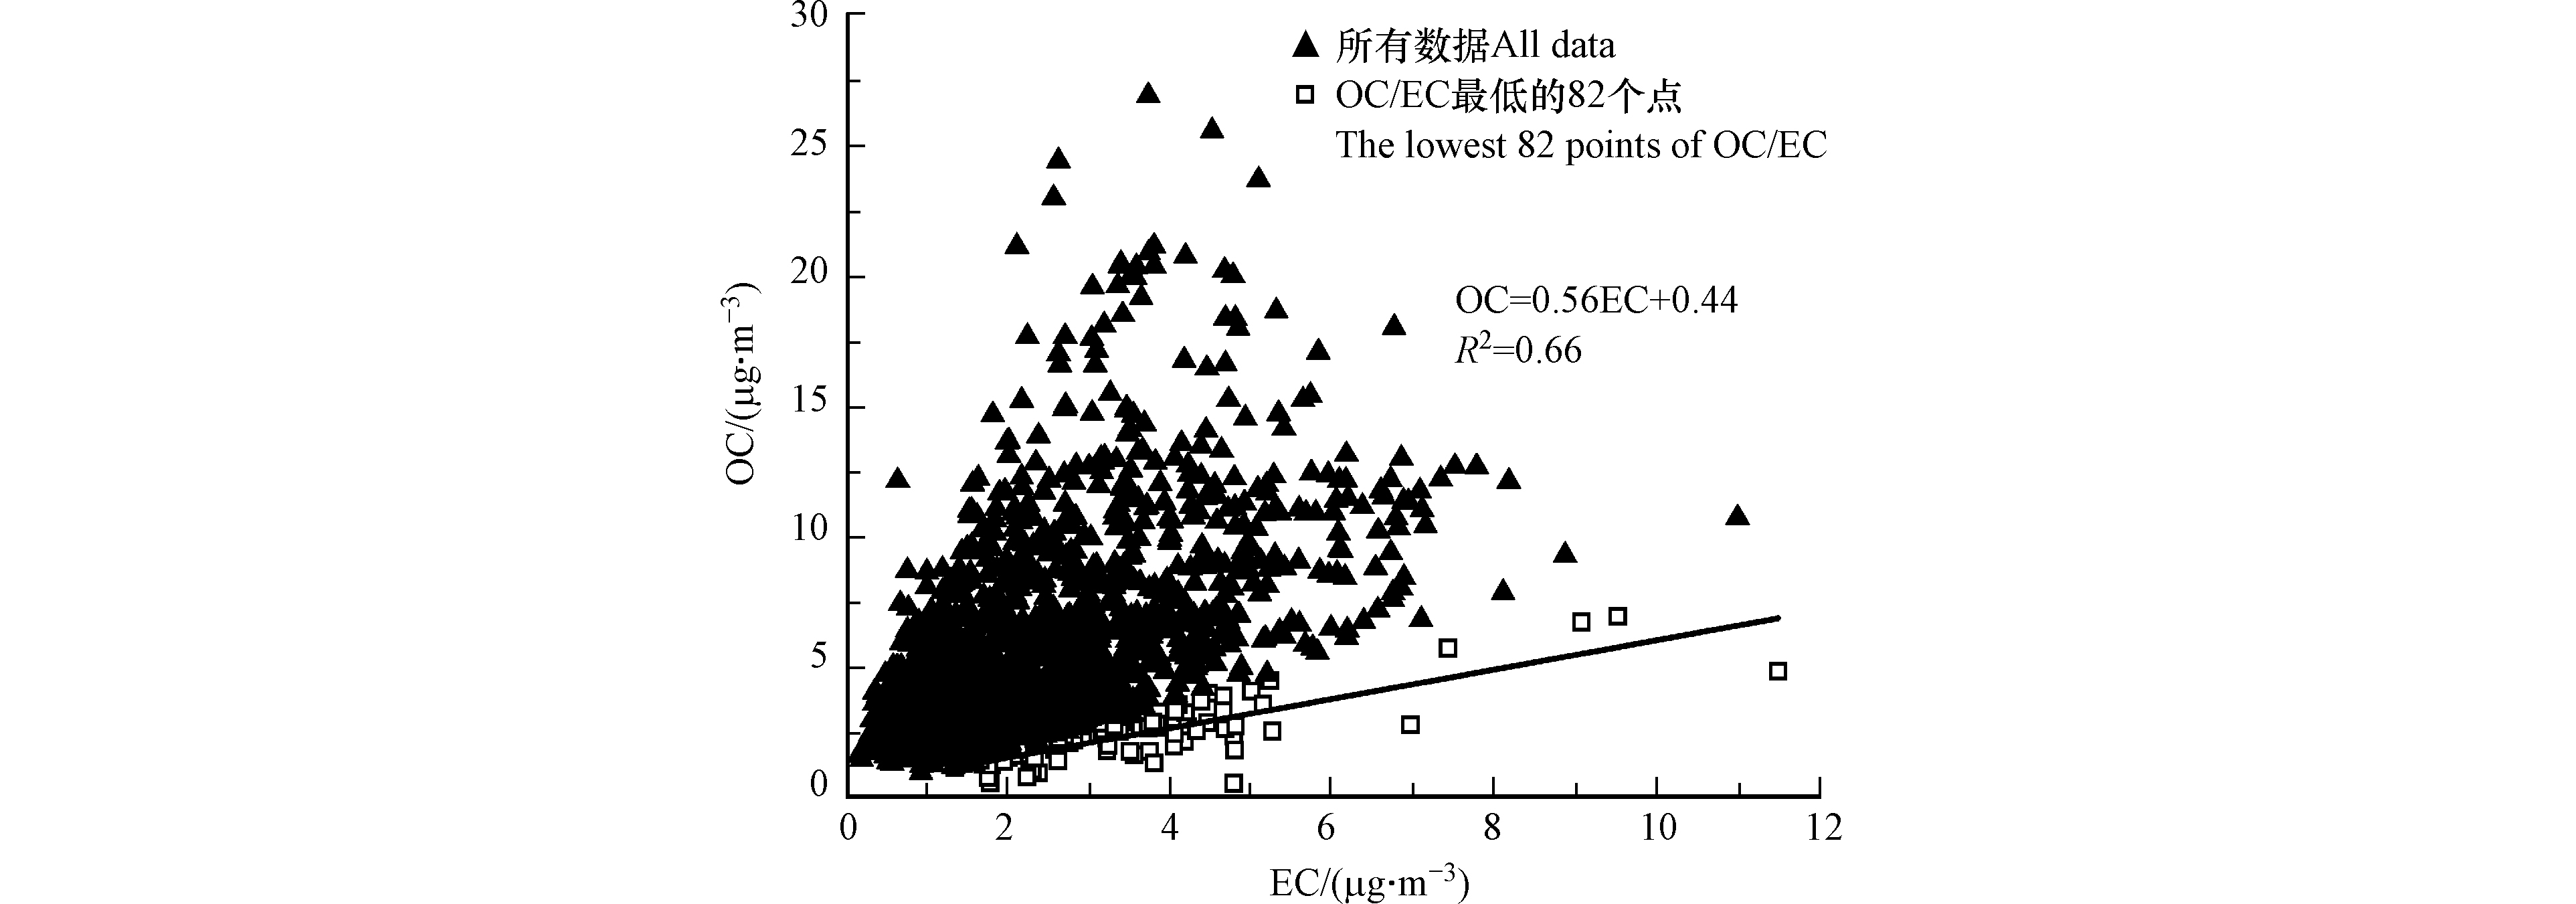
式中,POC、(OC/EC)POC、N和SOC分别代表一次有机碳、一次燃烧源产生的OC与EC的比值、一次非燃烧源产生的有机碳和二次有机碳。在公式(1)中,得到1个准确的(OC/EC)POC值是估算POC的关键。Lim等[20]的研究指出,使用样品中OC与EC比值最小的5%—10%去估算(OC/EC)POC从而可以得到相对准确的数值结果,所以在此次样本中取OC与EC比值最小的75个。对OC与EC的质量浓度做线性回归分析,回归方程的斜率为(OC/EC)POC,截距为N,结果见图1。假定这82个样品都是一次排放所产生的,没有在大气中受到二次污染。将各拟合曲线的斜率和截距代入公式(1)、(2)对SOC进行估算,估算可知SOC的平均质量浓度为4.1 μg·m−3占OC的70.7%。
-
由图2可知,观测期间大气污染物波动较大,在几小时或十几小时内,质量浓度会出现成倍的波动。如5月17日14:00时PM2.5和PM10的质量浓度分别为78.5 μg·m−3和117.0 μg·m−3,但是在17日20点,PM2.5和PM10质量浓度仅仅为37.1 μg·m−3和61.2 μg·m−3,在短短6 h内下降了52.6%和47.9%。其中含碳气溶胶波动更为显著,如5月24日15:00时OC和SOC的质量浓度分别为4.9 μg·m−3和4.2 μg·m−3,但是在5月25日4:00时OC和SOC质量浓度却达到27.0 μg·m−3和24.5 μg·m−3,在13 h内就上升了451.0%和483.3%,又如5月29日4:00时EC质量浓度为11.0 μg·m−3,但是在29日13点EC质量浓度仅仅为1.6 μg·m−3,在短短9 h内下降了85.5%。
由图2可见,当温度较低、RH较高时,污染物质量浓度普遍较低,如4月26日—5月2日、5月13日—5月19日和5月25日—5月31日。由图2还可发现,当温度突然降低时,往往是以北风为主,即是受到冷空气活动影响。当冷空气影响南京时,扩散条件较好,因此污染物质量浓度较低。而当冷空气活动结束后,大气污染物又开始逐渐积累,质量浓度开始逐渐上升。说明观测期间不同大气污染物的时间演变特征类似,主要受到气象条件的影响。
由图3可知,观测期间不同大气污染物的季节分布特征不同。O3、CO、EC和POC在夏季的平均质量浓度要大于春季,在春季平均质量浓度分别为82.3、0.69、2.2 、1.6 μg·m−3,在夏季平均质量浓度分别为109.5、0.74、3.1 、2.1 μg·m−3,夏季比春季分别高出32.1%、4.8%、38.0%和30.0%。而SO2、NO2、PM2.5、PM10、OC和SOC的平均质量浓度在春季较高,在春季平均质量浓度分别为12.0、37.2、31.4、65.4 、6.2、4.6 μg·m−3,在夏季平均质量浓度分别为10.4、30.4、30.7、55.2、4.9 、3.0 μg·m−3,春季比夏季分别高出23.3%、24.7%、7.1%、22.8%、26.5%和56.5%。
O3作为二次污染物,主要受光化学的影响。夏季光照充足,温度较高,平均温度为25.8 ℃,因此有利于光化学过程的发生,使得O3浓度比春季高了4.8 μg·m−3。此外,观测期间夏季降水量41.2 mm,共发生5次降水,而春季共发生18次降水,降水量为99.2 mm,春季的降水次数和降水量要比夏季高。因此观测期间夏季湿清除作用较小。
PM2.5的来源和形成机制更加复杂。虽然由图2可知观测期间PM2.5存在较大波动,但是春、夏季的质量浓度差异较小。观测期间,春季和夏季平均风速分别为1.67 m·s−1和1.69 m·s−1,RH分别为62.2%和65.4%没有明显差异,受气象条件中风速和RH的影响较小。NO2是O3重要的前体气体,因此季节变化与O3相反。而SOC在春季的质量浓度高于夏季,同时通过计算春季和夏季在SOC在OC中的占比分别为74.5%和60.1%,可以看出春季占比较高,与许多学者研究一致[21],通常情况下SOC通过与有机化合物的氧化反应和水汽的冷凝和成核两种过程形成。光化学反应和温度对SOC的形成起着重要作用,研究表明温度每升高10 ℃,SOC的浓度降低18%,低温有利于挥发性有机物(VOCs)在颗粒物上进行吸收和凝结[22-23]。由图4(c)可发现春季温度比夏季较低,挥发性有机物更容易吸附在气溶胶上,从而导致春季OC中的二次源较多,SOC含量较大。
由图5可发现,春夏季O3、CO、SO2、PM2.5和PM10的质量浓度日变化均为显著的单峰型分布。春夏季O3峰值均出现在15:00—17:00,夏季日变化更加剧烈,由图4(c)可发现这与夏季更高的温度从而导致更强烈的太阳辐射和更大速率的光化学反应有关。
CO、SO2、PM2.5和PM10的峰值均出现在6:00—10:00,与上班高峰时间一致,其中夏季PM2.5和PM10质量浓度峰值出现的时间相对于春季均要提前1—2 h左右,受夏季更早的人为排放源排放影响。由图5(d)可知,春夏季NO2日变化均为双峰型分布,峰值均分别位于6:00—7:00和21:00—24:00,白天质量浓度较低,由图4(a)可知,白天风速较大,有利于污染物扩散。
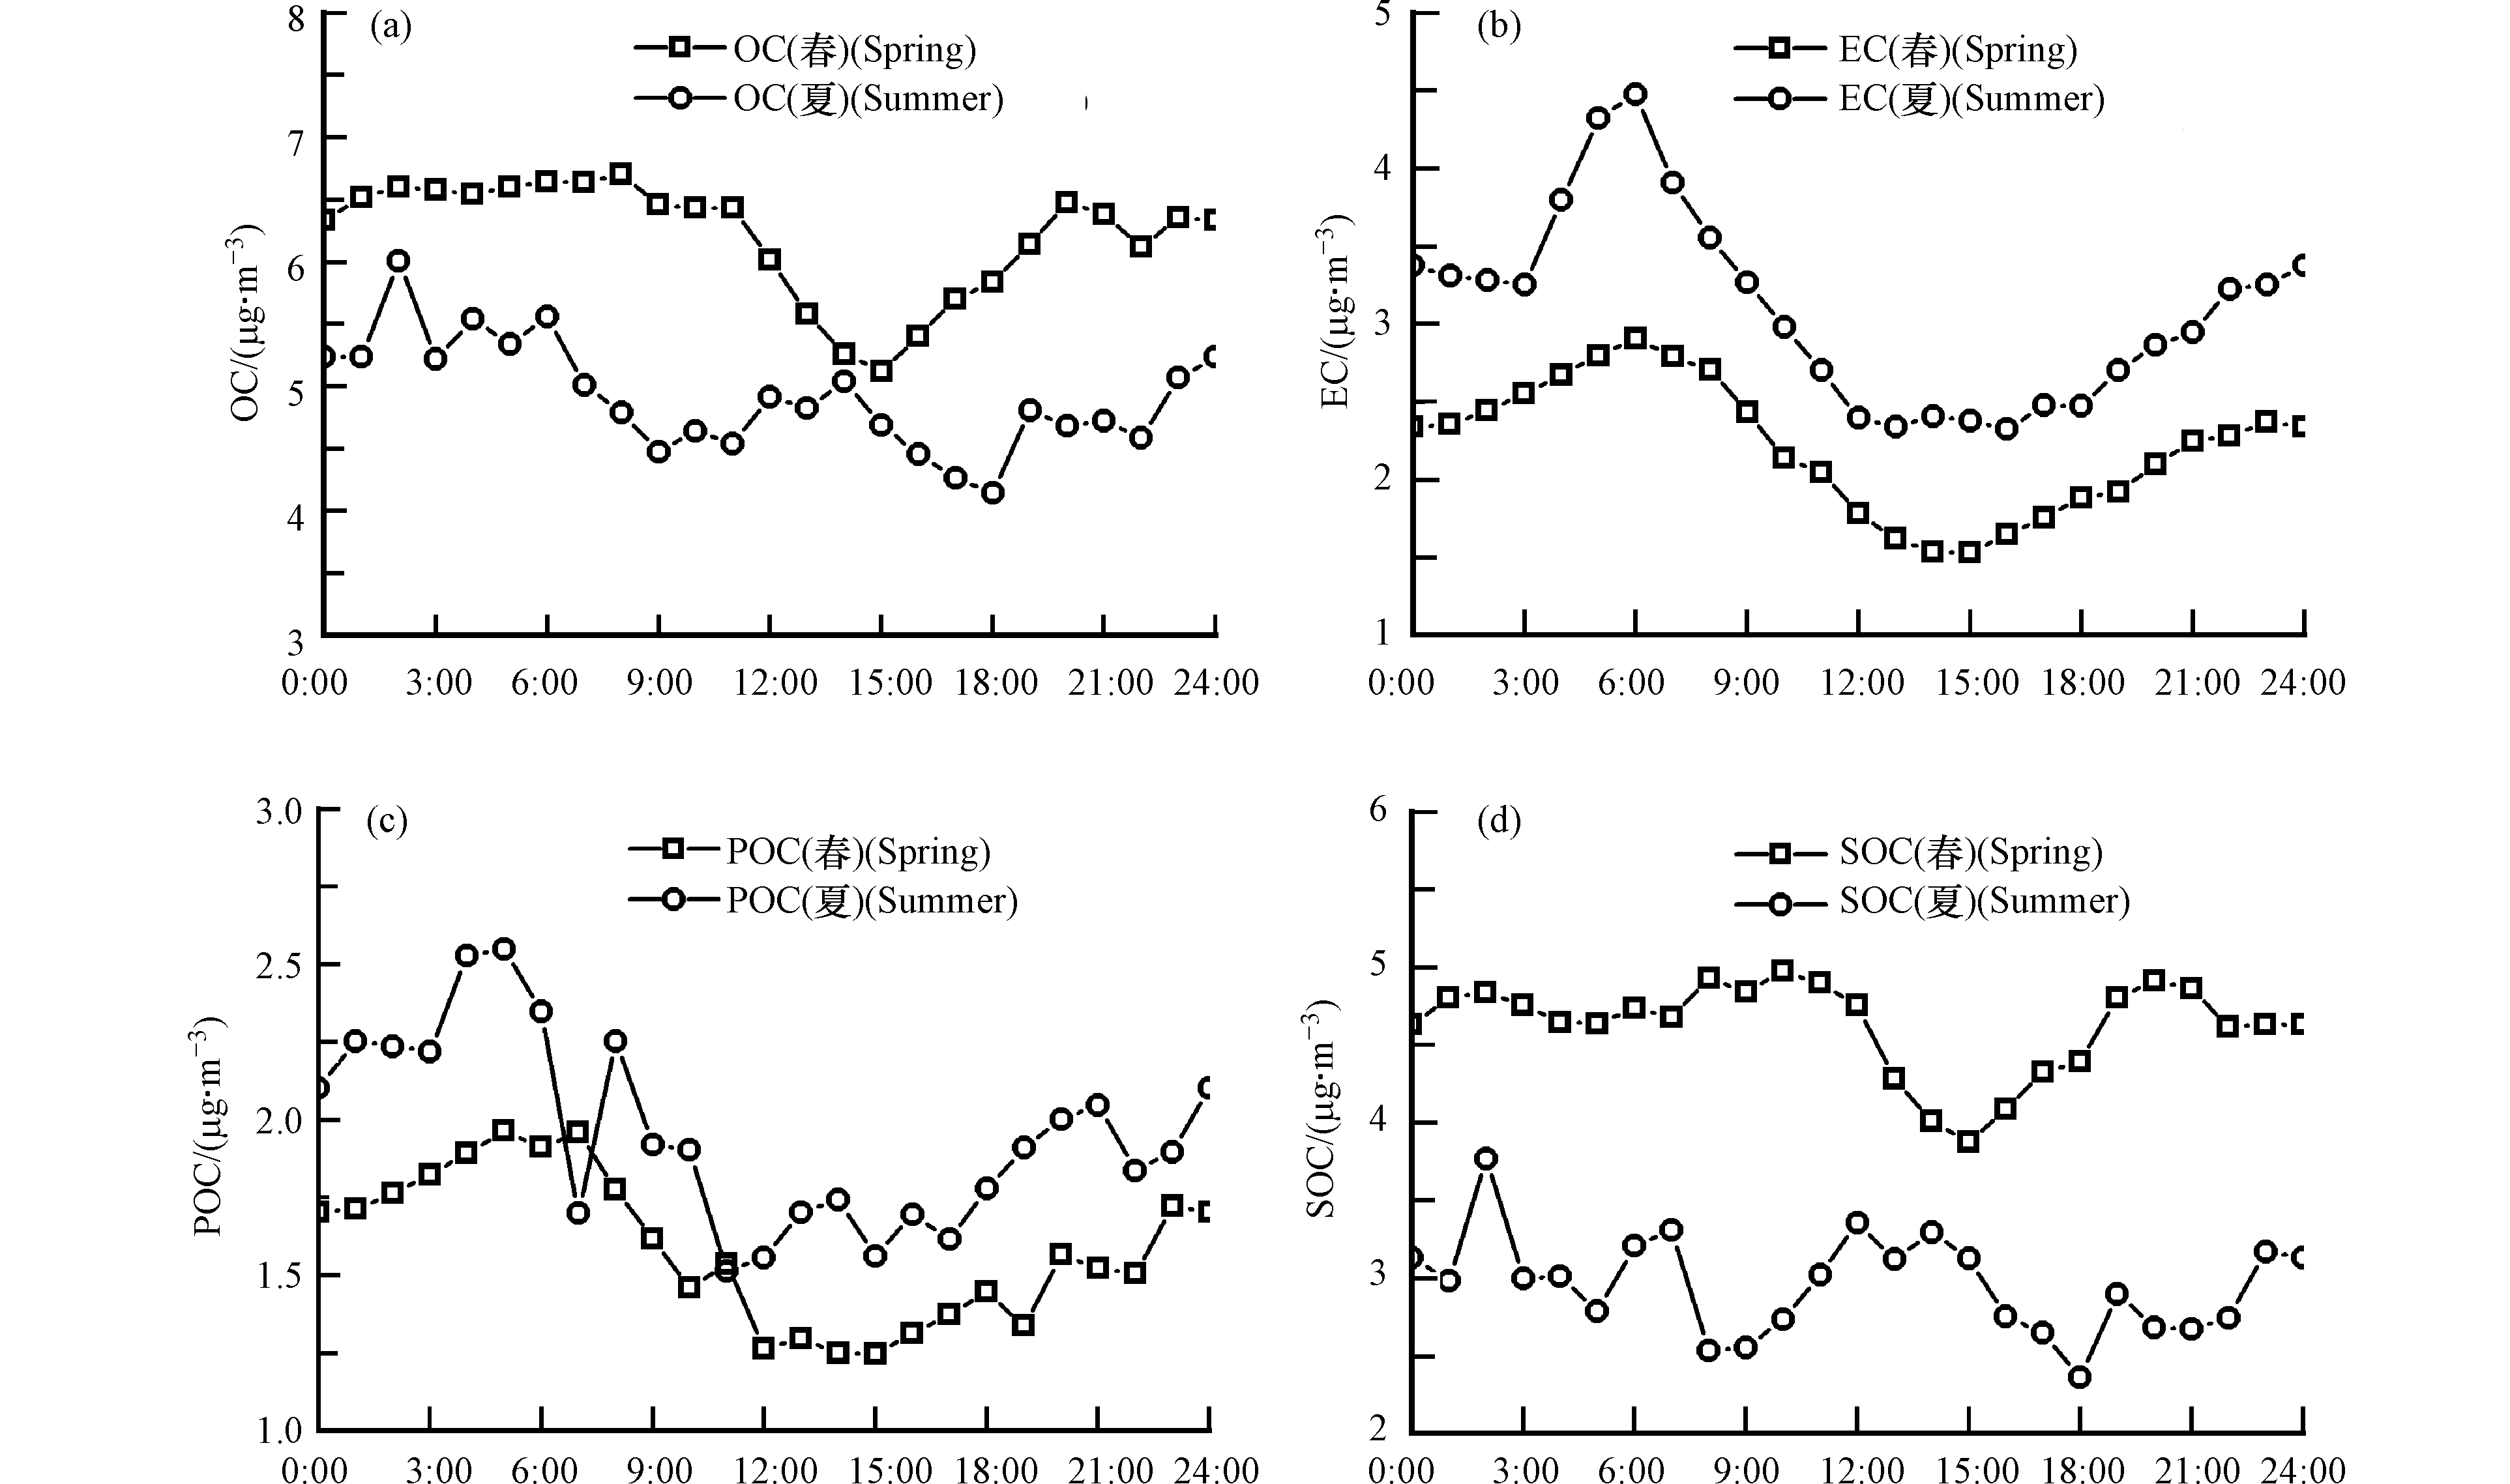
图6给出了春夏季含碳气溶胶平均质量浓度日变化特征。由图6可发现,春季OC、POC和SOC均在11:00后质量浓度出现明显下降,并在13:00—16:00出现明显低值,由图4(a)可知春季午后风速较大,伴随着午后边界层抬升,对流发展旺盛,对气溶胶的扩散作用明显。夏季OC、POC和SOC均呈复杂的多峰型分布,说明夏季OC和SOC来源更为复杂,可能与太阳辐射,气象要素和其他大气条件共同作用有关。春夏季EC质量浓度日变化均呈单峰型分布,峰值均出现在6:00左右,峰值浓度分别为2.9 μg·m−3和4.5 μg·m−3,夏季峰值浓度比春季高出54.0%,夏季峰值浓度明显大于春季且夏季EC在早上变化更加剧烈,例如3:00时EC质量浓度为3.3 μg·m−3,但是在6:00时EC质量浓度却达到4.5 μg·m−3,短短3 h内就上升了36.3%,说明夏季受交通早高峰机动车尾气排放影响更加显著。
-
由于不同的气象条件和源排放特征会导致污染与清洁天含碳气溶胶的各碳组分组成具有一定差异,因此根据采样期间空气质量指数AQI值,将观测期按照空气质量等级分为优、良和轻度污染,从而探讨不同污染背景条件下各碳组分的分布特征。
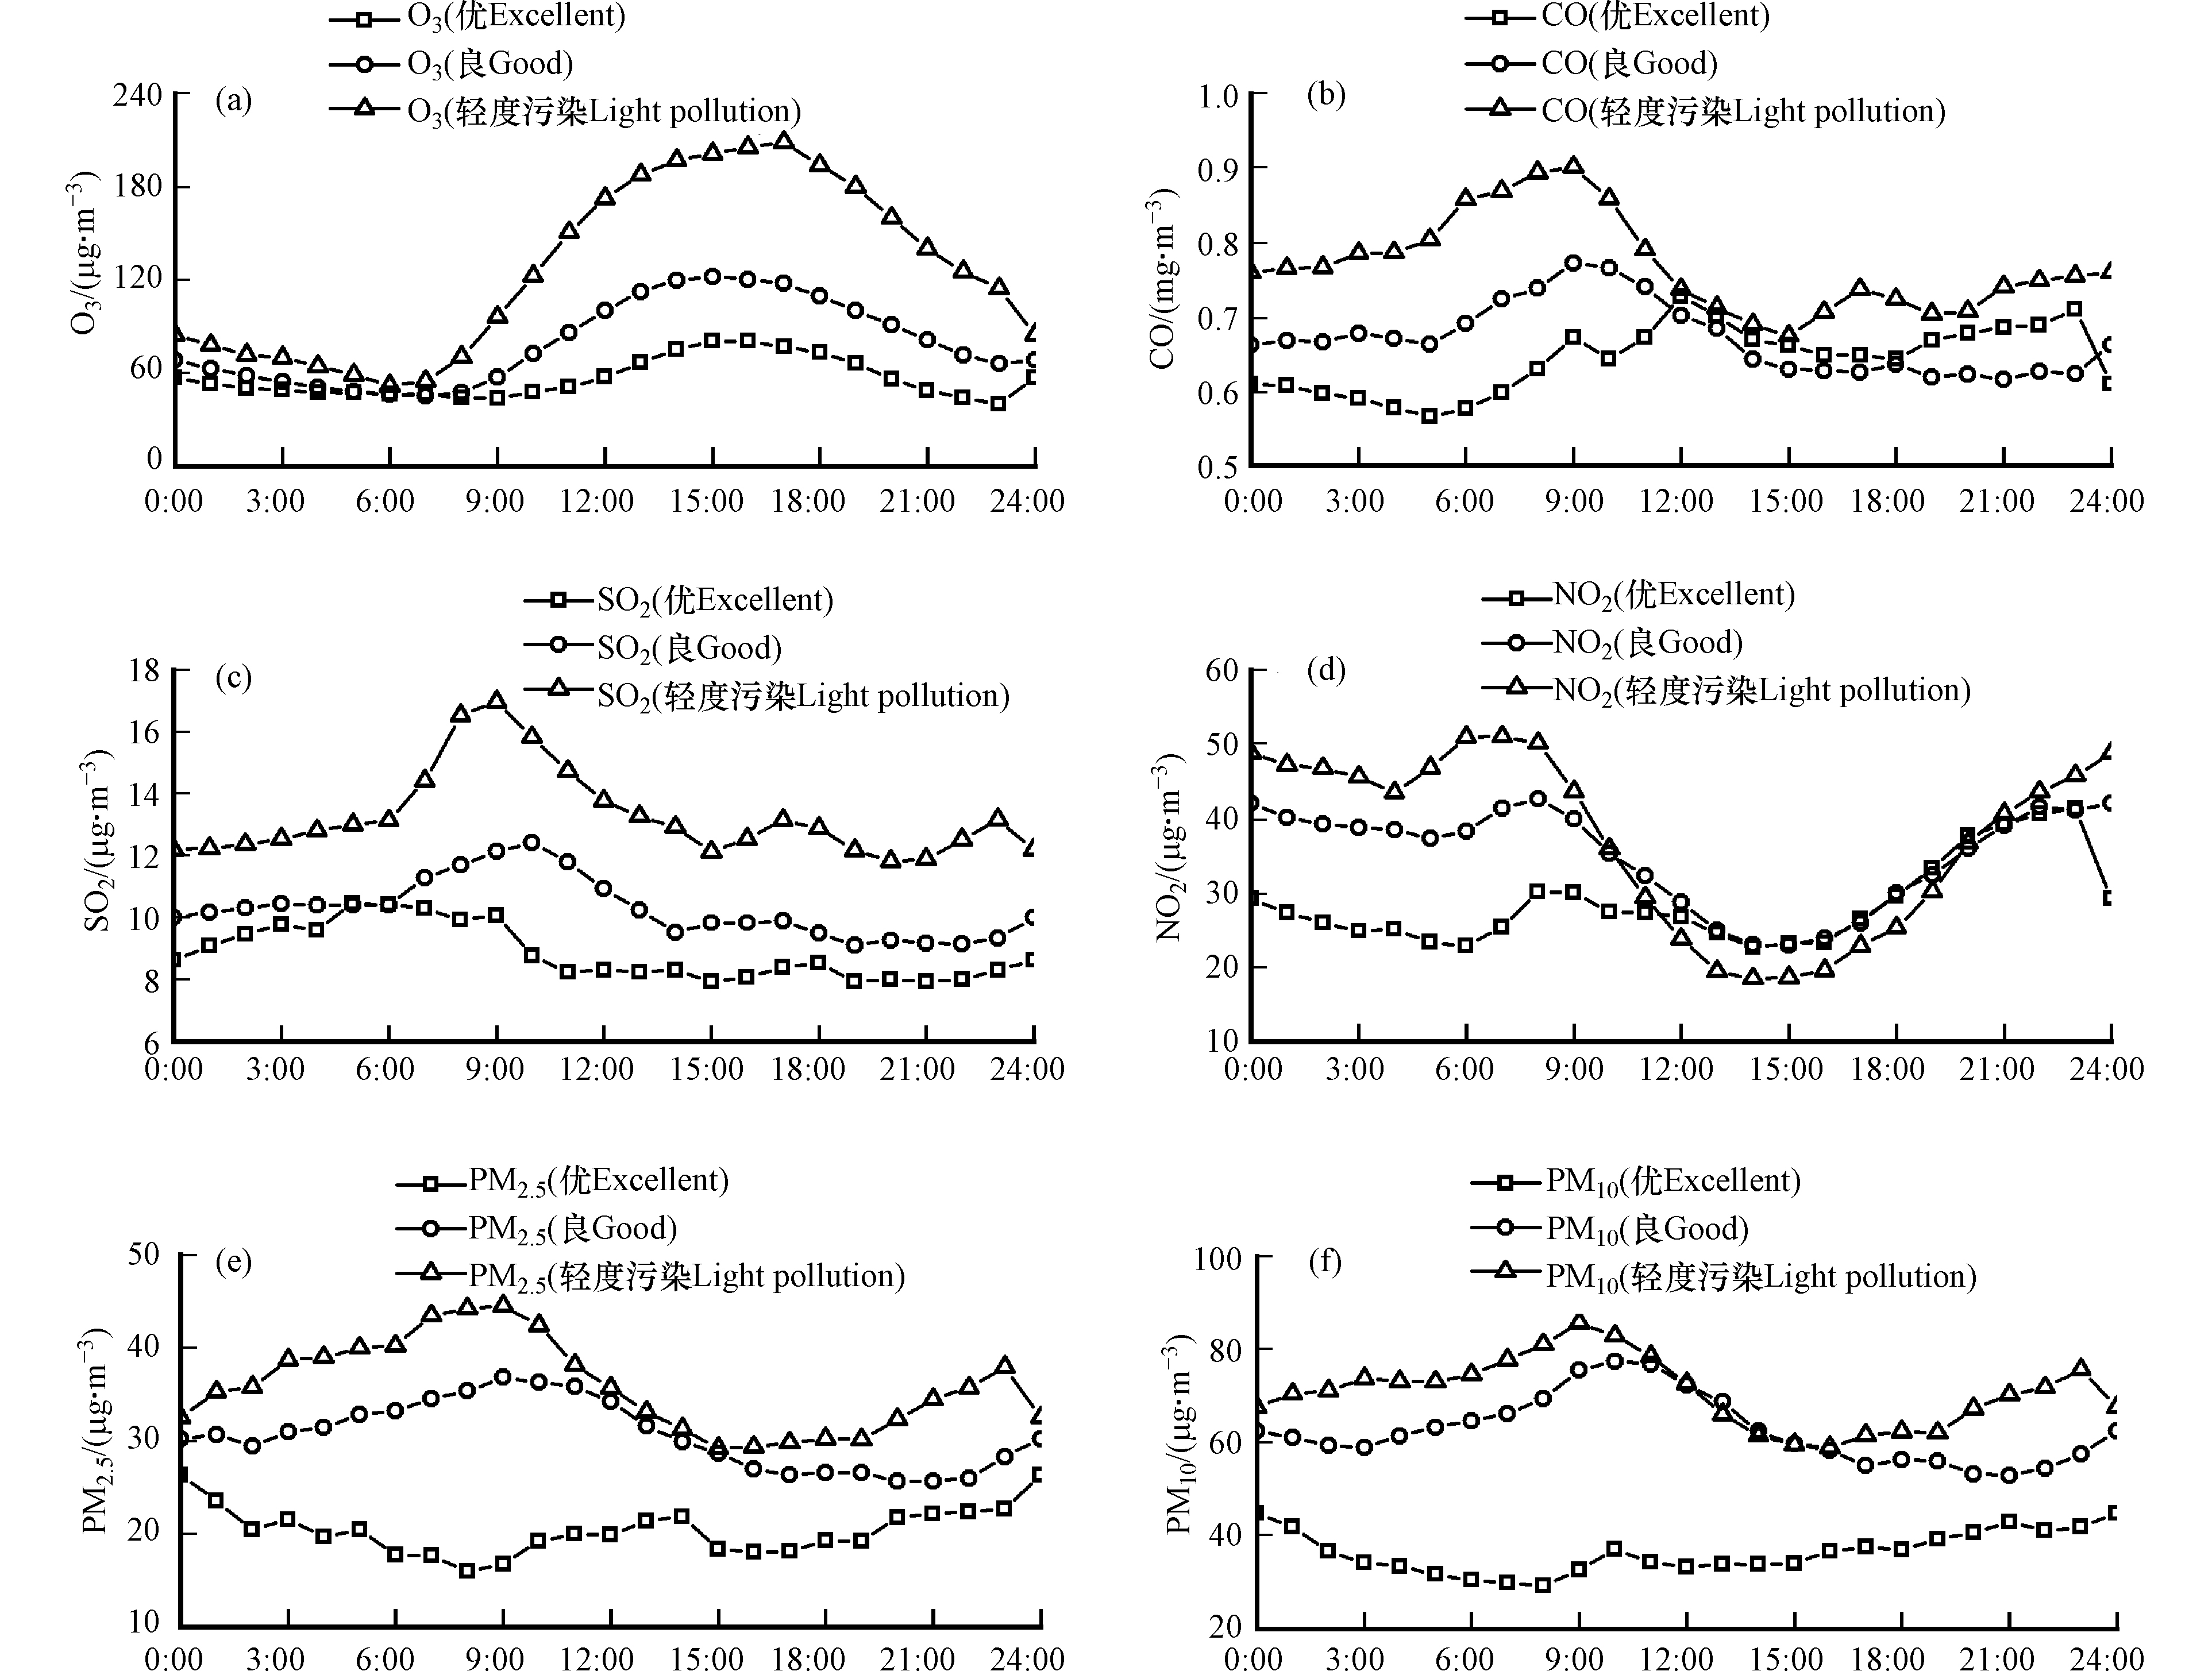
由图7可以看出,不同空气质量等级下污染物变化特征相同,各污染物平均质量浓度轻度污染>良>优。由图5(a)可以看出轻度污染下SO2、NO2和CO质量浓度增长缓慢,而轻度污染下PM2.5和PM10相比于空气质量为优时质量浓度增长却十分显著,轻度污染中PM2.5和PM10平均质量浓度分别为36.1 μg·m−3和71.1 μg·m−3,分别比空气质量为优时高出78.7%和96.0%,比为良时高出18.1 %%和13.4%。
由图7(a)可以看出,轻度污染下O3平均质量浓度相比其他气态污染物在优和良下增长最为显著,O3在优、良和轻度污染中的平均质量浓度分别为56.3 μg·m−3、79.7 μg·m−3和126.7 μg·m−3,轻度污染分别比优和良高出125.2%和59.0%,成为影响空气质量的首要因子。
由图7(b)可以看出,在轻度污染中OC、EC、POC和SOC的平均质量浓度分别为7.8 μg·m−3、3.0 μg·m−3、2.1 μg·m−3和5.8 μg·m−3,分别比优中高出150.9%、73.2%、55.0%和215.8%,分别比良中高出48.6%、26.9%、20.5%和60.0%。可以看出轻度污染下EC和POC质量浓度增长缓慢,而轻度污染下SOC质量浓度的显著增加是导致污染下OC质量浓度增加的主要原因。
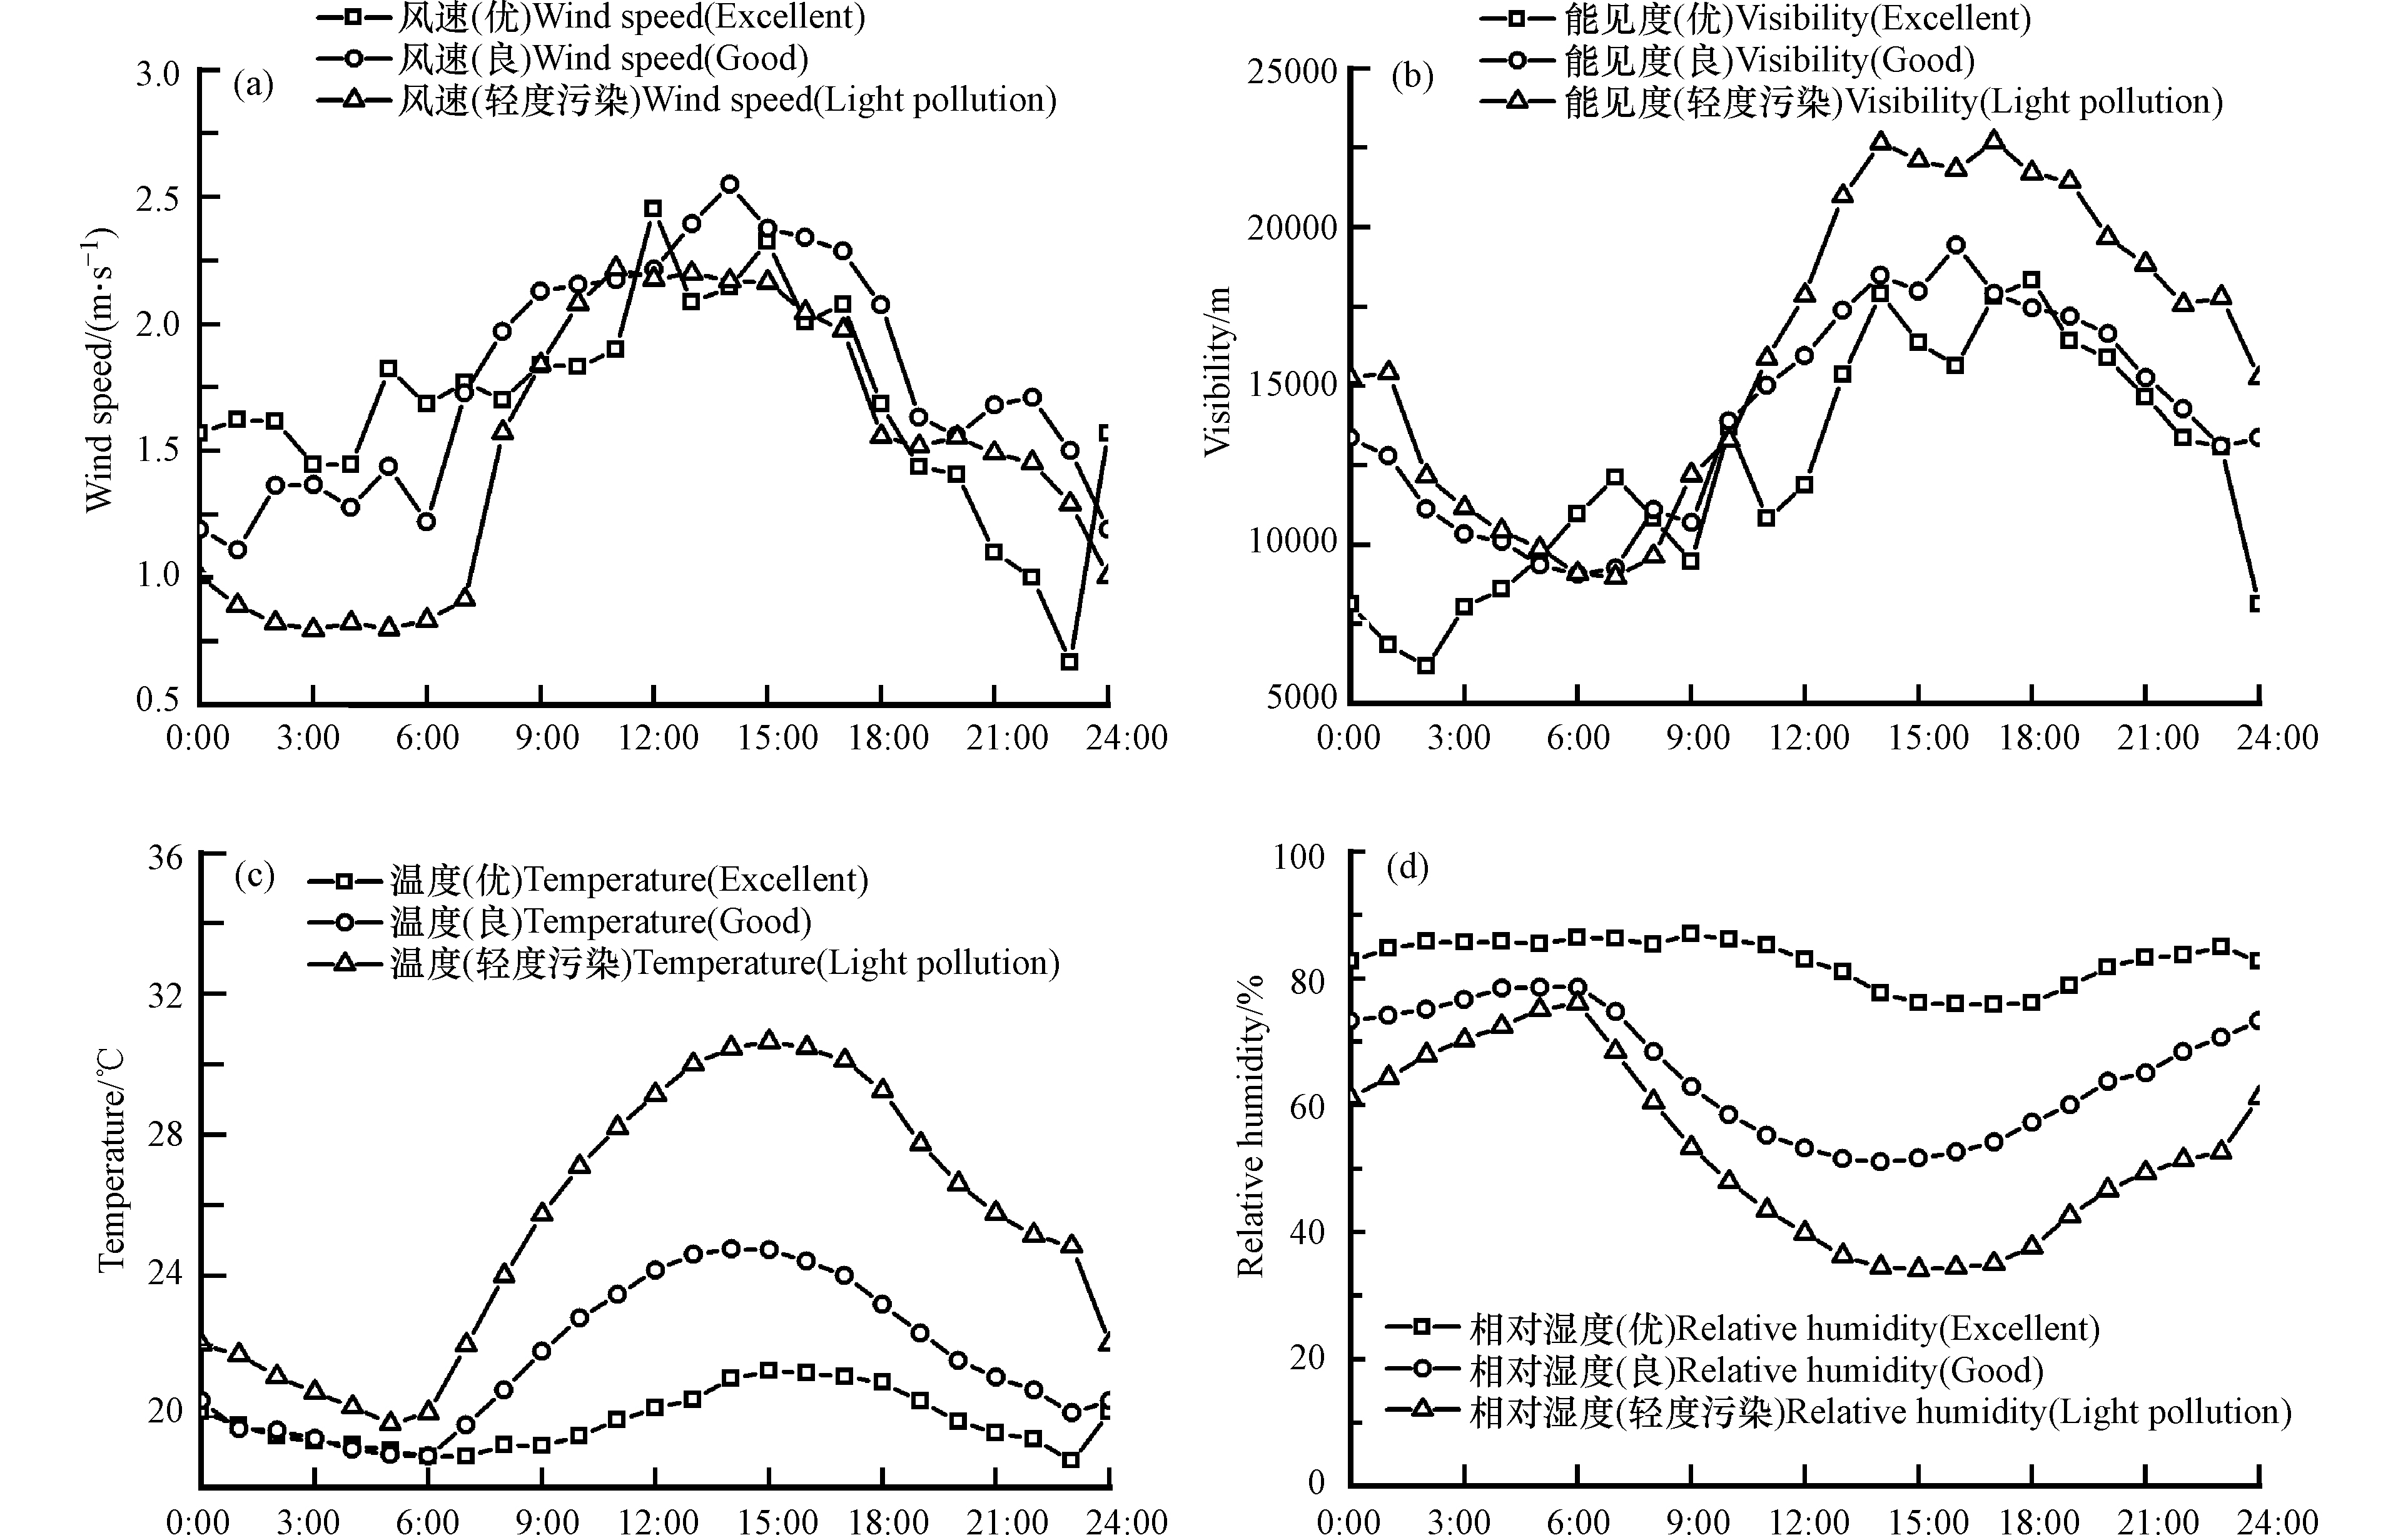
由图8(a)、(c)可知,优、良和轻度污染下的O3和SO2日变化均呈显著的单峰型分布,O3峰值均出现在14:00—18:00,其中轻度污染天下O3变化更加剧烈。由图9(c)可以发现,轻度污染下更高的温度加快了光化学反应的作用下O3的生成。SO2峰值均出现在5:00—10:00,与早高峰时间一致。由图8(b)可发现,良和轻度污染下CO均为单峰型分布,在8:00—10:00出现明显峰值,而空气质量为优时CO日变化为显著的双峰型分布,峰值分别出现11:00—13:00和22:00—24:00。
由图8(d)、(e)、(f)可知,空气质量优、良和轻度污染下NO2、PM2.5和PM10日变化均为典型的双峰型分布,优、良和轻度污染下NO2均在6:00—9:00和23:00—24:00出现峰值,与上下班高峰时间一致,轻度污染下NO2白天质量浓度较低且变化更加剧烈,例如在8:00时质量浓度为50.1 μg·m−3,但在14:00时为18.5 μg·m−3,在短短6 h内下降了63.1%,由图9(c)可知,这是由于轻度污染下更高的温度加剧了NO2在光化学反应中的消耗。PM2.5峰值在空气质量为优时分别位于13:00—15:00和23:00—次日1:00,良和轻度污染下PM2.5峰值分别位于8:00—11:00和22:00—次日2:00,主要是由于上下班高峰期人为排放和边界层日变化造成。其中轻度污染下PM2.5和PM10峰值出现的时间都要比良提前1 h左右。
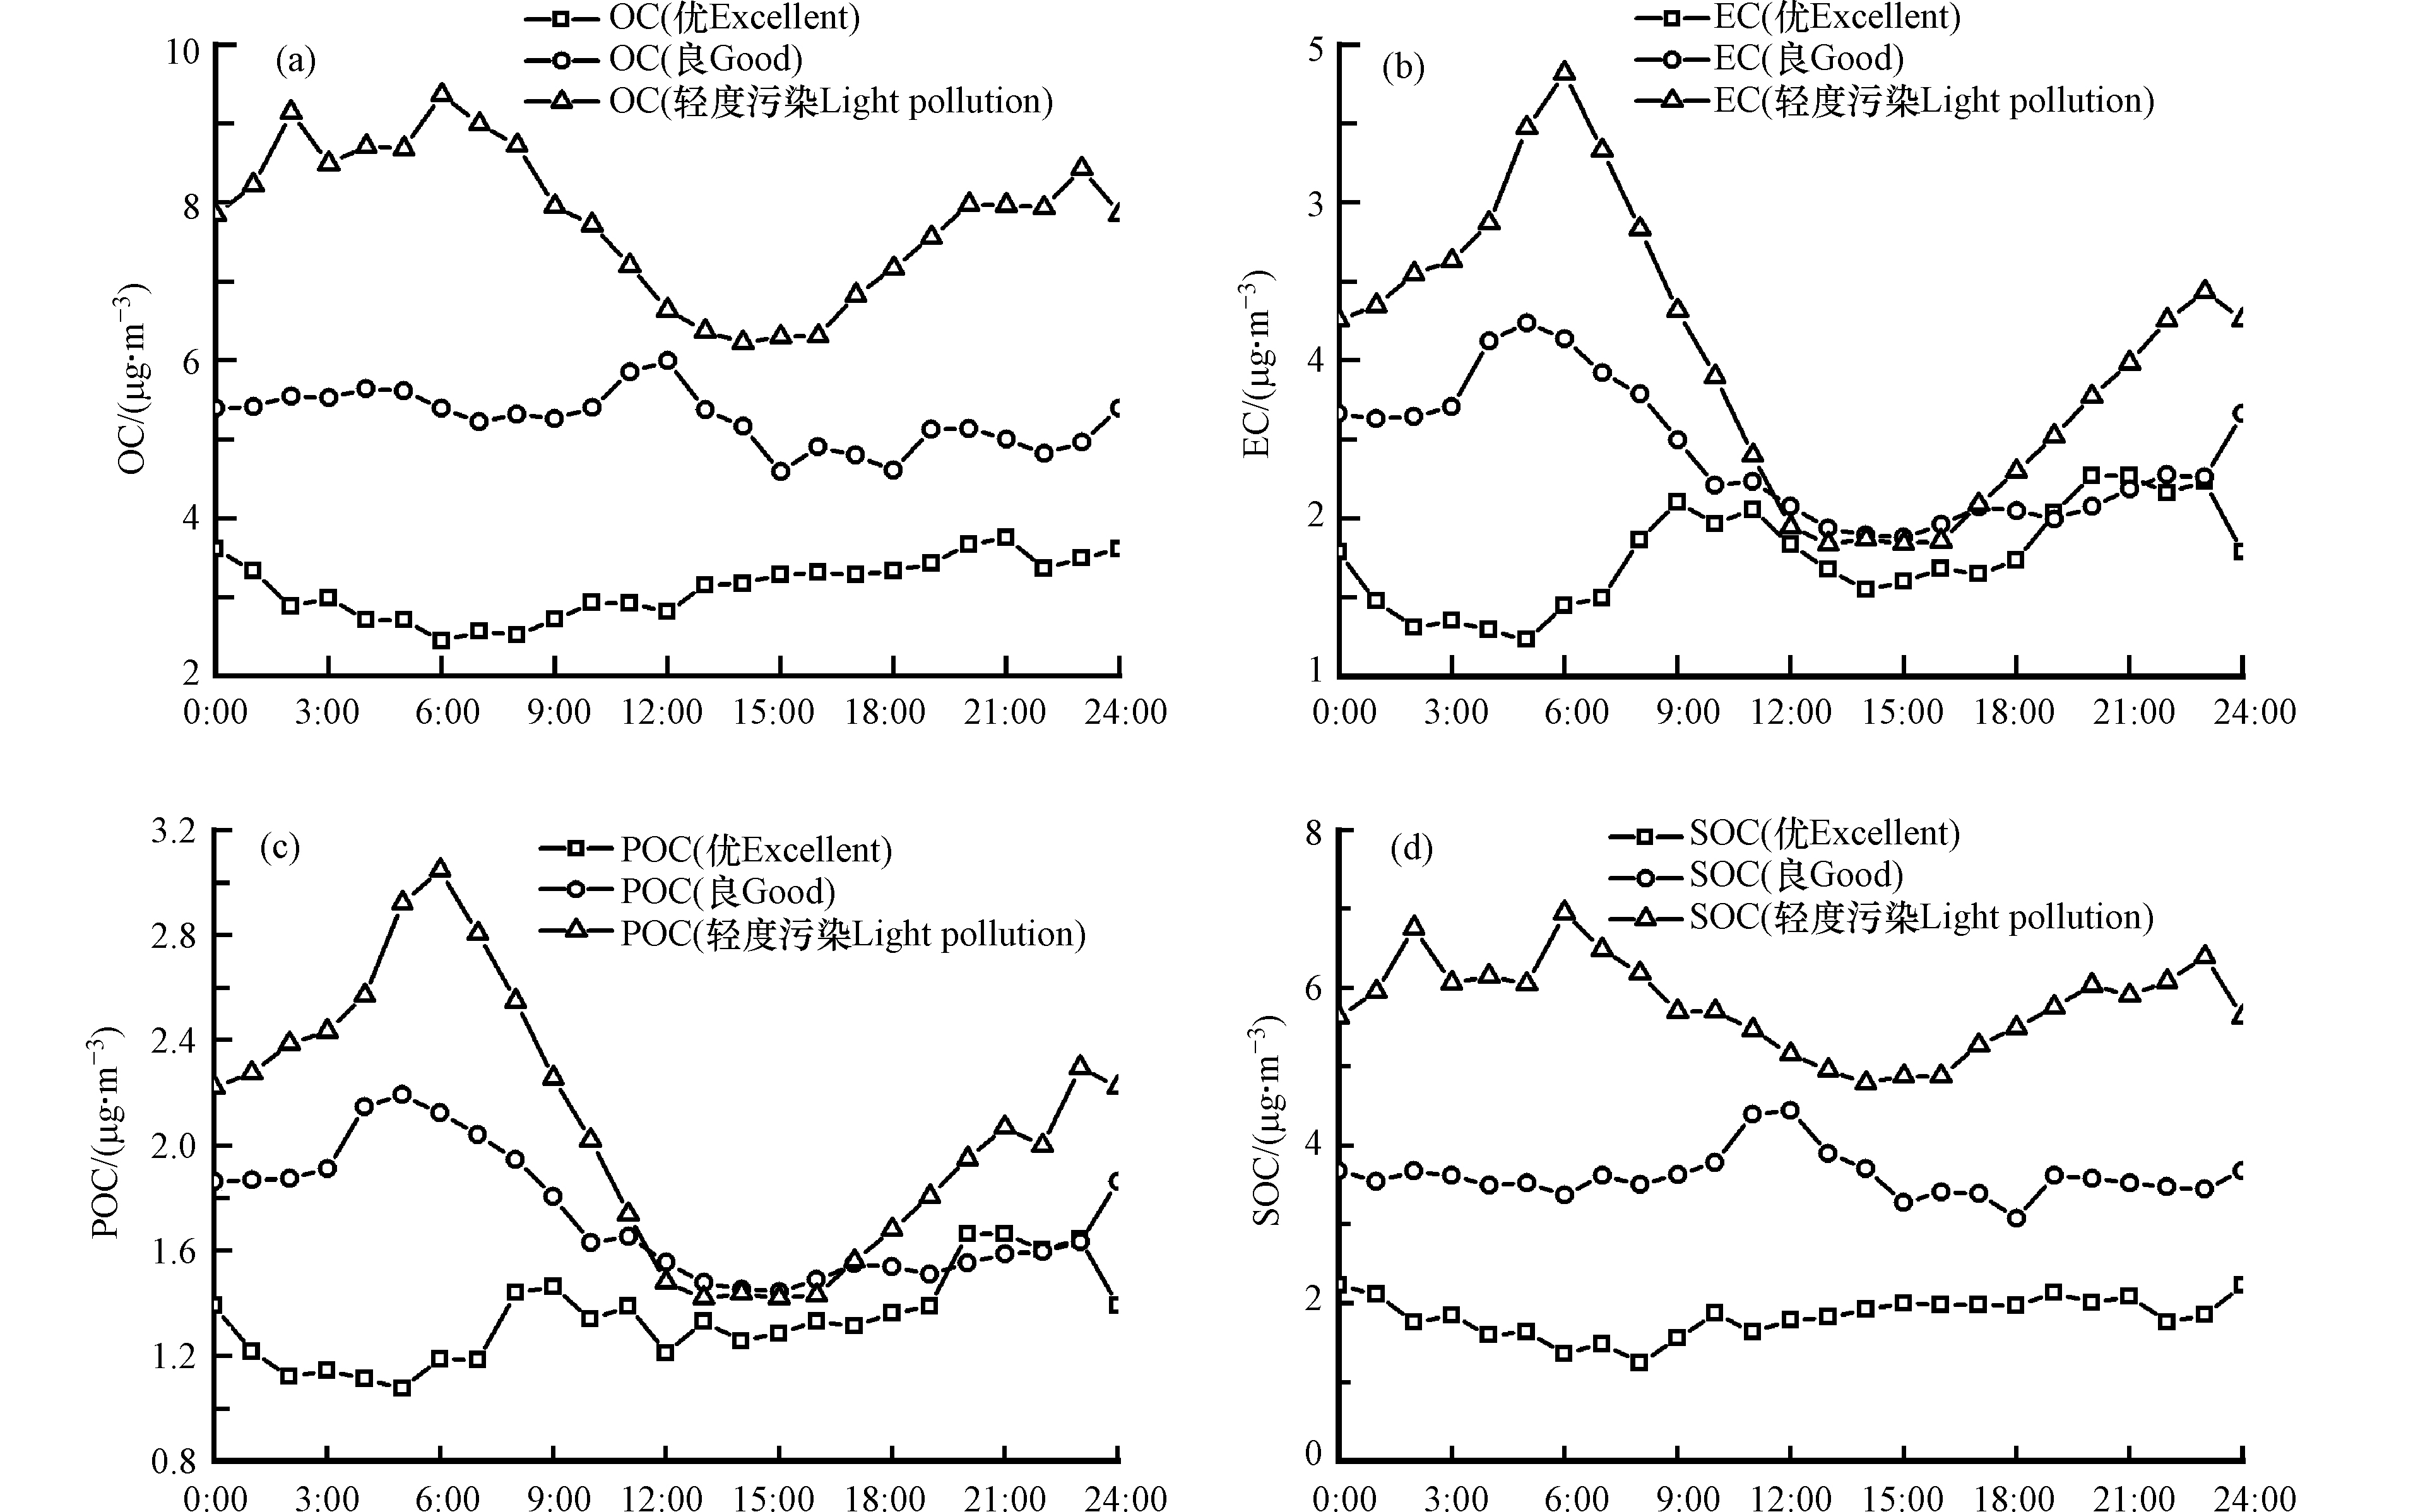
由图10可知,不同空气质量等级下含碳气溶胶平均质量浓度日变化差异较大。由图10(a)、(d)可以看出,在空气质量为优时OC和SOC日变化特征基本一致,日变化相对较平缓。由图9(c)、(d)可知,这与全天处于相对湿度较高和温度日变化波动较小的稳定的气象条件有关。空气质量为良时OC和SOC日变化均呈单峰型分布,峰值均出现在11:00—13:00,这与高温时段中大气中光化学反应比较强烈,生成SOC较多,从而也导致了OC质量浓度的增加有关。轻度污染下OC和SOC日变化均呈三峰型分布,峰值分别出现在1:00—3:00、6:00—8:00和22:00—24:00,6:00—8:00的峰值可能是由于交通高峰导致机动车源排放的增加,23:00出现的峰值可能与餐饮源的增加以及混合层的降低有关。白天质量浓度较低,夜间质量浓度较高,由图9(a)、(c)可发现,轻度污染下风速和温度的日变化与OC均呈现明显的负相关,通过计算可知,相关系数分别为−0.86和−0.92,但由图9(d)可发现,OC与RH却呈现明显的正相关,相关系数为0.92,说明较低的温度和风速不利于OC和SOC扩散,而较高的相对湿度对OC与SOC的质量浓度增加有显著影响。
由图10(b)、(c)可知,空气质量优、良和轻度污染下EC和POC日变化特征基本一致,空气质量优时EC日变化为典型的双峰型分布,峰值分别位于8:00—10:00和20:00—22:00,主要由于上下班高峰期人为排放和边界层日变化造成。空气质量良和轻度污染下EC均为单峰型分布,峰值均出现在4:00—7:00,主要受汽车尾气的影响,之后质量浓度开始显著下降,由图9(a)、(d)可知,这与7:00之后RH快速降低,风速迅速增加,大气的扩散条件迅速加强,使大气污染物扩散有关,在13:00—16:00达到低值,此后受人为活动影响,质量浓度开始增加。此外由图9可发现在5:00—7:00中,空气质量优、良和轻度污染下温度和RH的差异较小,远小于不同空气质量等级下EC质量浓度的差异,而污染下风速明显低于优和良,因此RH和温度,并不是影响轻度污染下EC早上峰值与优和良差异的主要因素,而更低的风速抑制污染物的扩散,造成污染物近地层堆积质量浓度升高是造成轻度污染中EC早上5:00—7:00出现峰值的主要原因。
-
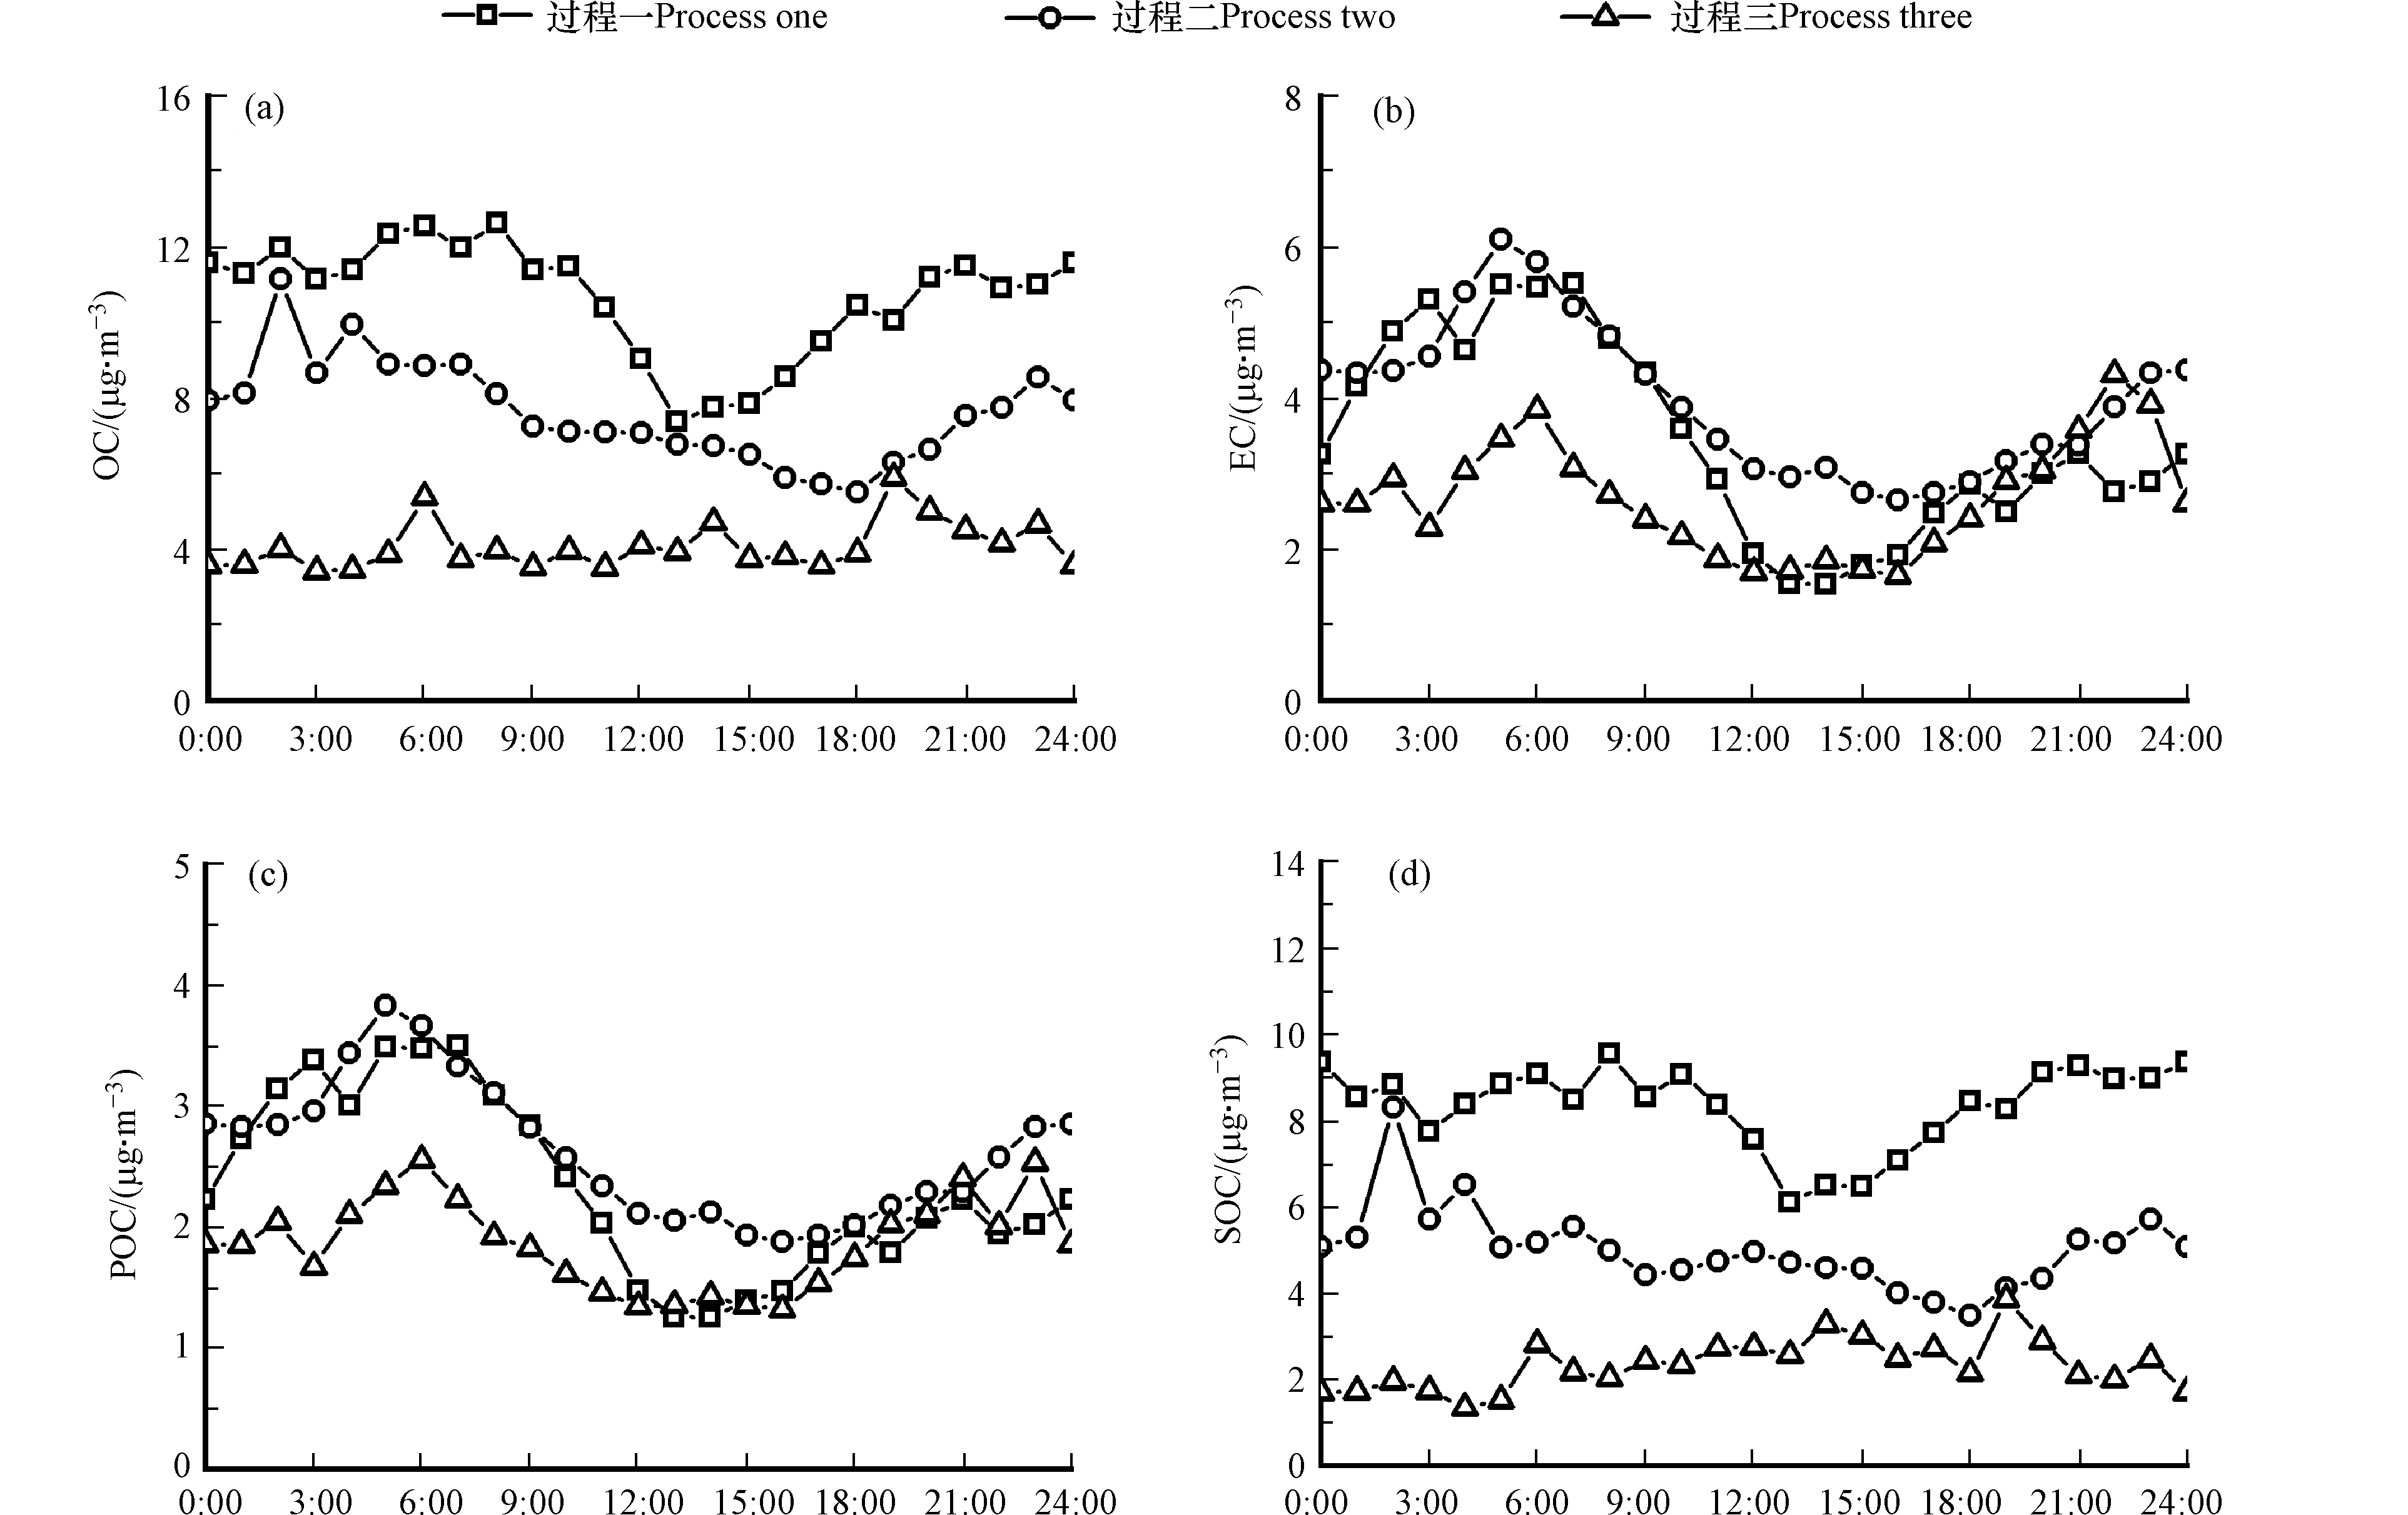
由图2可知,5月9日—12日、6月2日—5日和6月11—16日分别出现了以O3为首要污染物的污染事件。由图11和图12可以发现,这3次过程中O3、CO、SO2、EC和POC平均质量浓度相差不大,3次过程中O3平均质量浓度分别为135.3、133.0、122.7 μg·m−3。但NO2、PM2.5、PM10、OC和SOC平均质量浓度却差异显著,NO2、PM2.5、PM10、OC和SOC在过程一中平均质量浓度均显著大于过程二和过程三,例如3次过程中OC平均质量浓度分别为10.7、7.6和4.1,过程一分别比过程二和过程三高出40.8%和161.0%,较高浓度的OC和SOC可能是因为过程一发生在春季相比过程二和过程三发生在夏季,春季气温较低,在低温和低边界层厚度的气象条件下,大气气溶胶不易扩散。而夏季降雨频繁,雨水充沛,对气溶胶具有冲刷作用,并且夏季天气系统不稳定,多雷暴台风等天气过程,大气活动加强,有利于污染物的扩散和稀释,使污染物得以清除。由图11(a)和图12(d)还可以看出,前两次过程中O3与SOC呈一定程度的负相关,但第三次过程中O3与SOC却表现出一定程度的正相关性。为此探讨3次不同污染过程中各污染气体和含碳气溶胶的日变化特征。
图11给出了3次不同污染过程中气态污染物和PM质量浓度日变化特征。由图11(a)、(d)可知,3次过程中O3和NO2日变化特征类似,O3均为单峰型分布,峰值均出现在14:00—17:00之间。NO2日变化均呈双峰型分布,峰值均分别位于0:00—3:00和5:00—9:00,但过程一日变化更加剧烈,如8:00质量浓度为76.8 μg·m−3,12:00时质量浓度为31.8 μg·m−3,短短4 h就下降了58.6%。
由图11(b)、(c)可知,过程一和过程三中CO和SO2均呈单峰型分布,峰值均出现在8:00—11:00,与交通早高峰和附近化工厂排放有关。过程二中SO2和CO均呈双峰型分布,峰值分别出现在8:00—10:00和16:00—18:00,质量浓度变化剧烈,峰值持续时间较短,主要受汽车尾气影响。由图11(e)、(f)可发现,3次过程中PM2.5和PM10平均质量浓度日变化均为双峰型分布,其中PM2.5峰值均分别位于8:00—11:00和21:00—24:00,主要是由于上下班高峰期人为排放和边界层日变化造成,过程三中PM2.5和PM10平均质量浓度日变化均为三峰型分布,除了在6:00—9:00和21:00—24:00出现峰值外在下班高峰期16:00—18:00也存在峰值。
由上文可知,前两次过程中O3与SOC均呈负相关,但第三次过程中O3与SOC却呈正相关性,于是通过计算可知,3次污染过程中O3与SOC的相关系数分别为−0.64、−0.66和0.63,这可能与过程三处在6月中旬,气温相比5月和6月初较髙、太阳福射较强的气象条件有关,有利于O3的生成,使大气的氧化作用相于比前两次污染过程更加明显,有利于气态前体物的二次转化,促进SOC的生成。由图12可以看出,3次O3污染过程下含碳气溶胶污染特征不同。由图12(a)可以发现,前两次过程中OC质量浓度日变化均表现出夜间高白天低的日变化特征,但第三次过程中昼夜浓度差异不显著。过程一中OC在10:00后迅速下降,在13:00出现明显低值,随后逐渐上升。过程二中OC日变化为单峰型分布,在2:00出现明显峰值后波动下降至9:00,随后在9:00—18:00中质量浓度持续下降且变化十分平缓,之后在18:00达到低值之后快速上升与交通晚高峰的增加以及混合层的降低有关。过程三中OC日变化呈复杂的多峰型分布,在5:00—7:00和18:00—20:00中均出现明显峰值,与上下班高峰时间一致。由图12(a)、(d)可知,SOC和OC日变化特征基本类似。由图12(b)、(c)可知,过程一和过程二中EC和POC均呈单峰型分布,峰值均出现在4:00—6:00,与早高峰人为排放有关。但过程三却呈显著的双峰型分布,峰值均分别出现在5:00—7:00和21:00—24:00,出现第二个峰值主要与大气边界层高度下降另外叠加晚高峰机动车排放有关。
Turpin等[1]认为,通过研究OC和EC的相关性,可以区分含碳气溶胶的来源。如果EC和OC的相关性较好,表明其存在相似或者一致的污染源。通过计算可知,3次污染过程中的OC和EC的相关系数分别为0.87、0.80和0.40,前两次过程相关性较好,这表明前两次过程中OC和EC具有相似的来源,而在第三次污染过程中OC与EC的相关性变差,可能受到外来输送与本地源排放的影响,使得含碳气溶胶来源变得相对复杂。
-
(1)南京市不同污染物和含碳气溶胶质量浓度春夏季节性差异明显。O3、CO、EC和POC平均质量浓度在夏季高于春季,其中EC和POC分别比春季高出38.0%和30.0%。而SO2、NO2、PM2.5、PM10、OC和SOC的平均质量浓度在春季却高于夏季,其中OC和SOC的平均质量浓度分别比夏季高了26.5%和56.5%。春夏季含碳气溶胶日变化特征不同,春季OC、POC和SOC在13:00—16:00出现低值,与春季午后较大风速和边界层抬升有关。夏季OC、POC和SOC均呈复杂的多峰型分布,与太阳辐射,气象要素和其他大气条件共同作用有关。春夏季EC质量浓度日变化均呈单峰型分布,其中夏季EC浓度受交通早高峰影响更加显著。
(2)不同空气质量等级下不同含碳气溶胶的日变化特征不同。OC和SOC日变化在空气质量为优时日变化平缓,在良时均为单峰型分布,而在轻度污染均时却均为三峰型分布,峰值均分别出现在1:00—3:00、6:00—8:00和22:00—24:00,其中较低的温度和风速不利于OC和SOC扩散,而较高的相对湿度对OC与SOC的质量浓度增加有显著影响。EC和POC在优中日变化均为双峰型分布,而在良和轻度污染下日变化均为单峰型分布,峰值均出现在4:00—7:00,主要受汽车尾气的影响,而更低的风速抑制污染物的扩散,是造成轻度污染中EC早上5:00—7:00出现峰值的主要原因。
(3)3次污染过程中O3与SOC的相关性不同,前两次过程中O3与SOC均呈负相关,相关系数分别为−0.64、−0.66,而第三次过程中O3与SOC则呈正相关,相关系数为0.63。3次O3污染过程中含碳气溶胶日变化特征不同。OC和SOC在过程一和过程二中日变化均表现出夜间高白天低的特征;而过程三中昼夜浓度差异不显著。过程一和过程二中EC和POC均呈单峰型分布,峰值均出现在4:00—6:00,但过程三中却均呈显著的双峰型分布,峰值均分别出现在5:00—7:00和21:00—24:00,21:00—24:00峰值的出现主要与大气边界层高度下降另外叠加晚高峰机动车排放有关。
南京春夏季大气PM2.5中含碳气溶胶污染特征
Study on the pollution characteristics of carbon-containing aerosols in atmospheric PM2.5 in Nanjing in spring and summer
-
摘要: 使用TCA08型总碳分析仪观测了南京市2019年4月19日—6月27日大气气溶胶中有机碳(OC)与元素碳(EC)的含量,结合空气质量数据(PM2.5、PM10、SO2、NO2、CO和O3)和气象数据,分析了春夏季含碳气溶胶的污染特征及其影响因素。结果表明,观测期间南京市不同污染物和含碳气溶胶质量浓度春夏季节性差异明显。O3、CO、EC和POC在夏季平均质量浓度分别为109.5、0.74、3.1 、2.1 μg·m−3,分别比春季高了32.1%、4.8%、38.0%和30.0%;而SO2、NO2、PM2.5、PM10、OC和SOC的质量浓度在春季的平均质量浓度分别为12.0、37.2、31.4、65.4、6.2 、4.6 μg·m-3,分别比夏季高了23.3%、24.7%、7.1%、22.8%、26.5%和56.5%。不同空气质量等级下不同碳气溶胶的日变化特征不同。OC和SOC日变化在空气质量为优时日变化平缓,空气质量为良时均为单峰型分布,在轻度污染时均为三峰型分布。EC和POC在空气质量为优时日变化均为双峰型分布,在良和轻度污染下日变化均为单峰型分布。3次污染过程中O3与SOC的相关性不同,相关系数分别为﹣0.64、﹣0.66和0.63。3次O3污染过程中含碳气溶胶日变化特征不同。OC和SOC在过程一和过程二中日变化均表现出夜间高白天低的特征;而过程三中昼夜浓度差异不显著。过程一和过程二中EC和POC均呈单峰型分布,峰值均出现在4:00—6:00,但过程三中却均呈显著的双峰型分布,峰值均分别出现在5:00—7:00和21:00—24:00。Abstract: The TCA08 total carbon analyzer was used to observe the content of organic carbon (OC) and elemental carbon (EC) in atmospheric aerosols in Nanjing from April 19 to June 27, 2019, combined with air quality data (PM2.5, PM10, SO2, NO2, CO and O3) and meteorological data, and analyzed the pollution characteristics and influencing factors of carbon-containing aerosols in spring and summer. The results show that the different pollutants and carbon aerosol mass concentrations in Nanjing during the observation period have obvious seasonal differences in spring and summer. The average mass concentrations of O3, CO, EC and POC in summer are 109.5, 0.74, 3.1, 2.1 μg·m−3, respectively, which are 32.1%, 4.8%, 38.0% and 30.0% higher in summer than in spring; while the average mass concentrations of SO2, NO2, PM2.5, PM10, OC and SOC in spring are 12.0, 37.2, 31.4, 65.4, 6.2 , 4.6 μg·m-3 are respectively 23.3%, 24.7%, 7.1%, 22.8%, 26.5% and 56.5% higher than summer. The diurnal variations characteristics of different carbon aerosols under different air quality levels are different.The diurnal changes of OC and SOC change smoothly when the air quality is excellent. When the air quality is good, they all have a unimodal distribution, and when the air quality is light pollution, they all have a trimodal distribution. The daily changes of EC and POC are both bimodal distributions when the air quality is excellent, and the daily changes are all unimodal distributions when the air quality is good and light pollution.The correlation between O3 and SOC during the three pollution processes was different, and the correlation coefficients were -0.64, -0.66 and 0.63, respectively. The daily variation characteristics of carbon-containing aerosols during the three O3 pollution processes were different. The diurnal changes of OC and SOC in process one and process two showed the characteristics of high at night and low during the day; while the difference in concentration between day and night in process three was not significant. Both EC and POC in process one and process two showed a unimodal distribution, with peaks appearing at 4:00—6:00, but in process three ,they showed significant double peak distribution, and the peaks appeared in 5:00—7:00 and 21:00—24:00, respectively.
-
Key words:
- Nanjing /
- organic carbon( OC) /
- elemental carbon( EC) /
- O3 /
- diurnal variation of mass concentration
-

-
-
[1] TURPIN B J, HUNTZICKER J J. Identification of secondary organic aerosol episodes and quantitation of primary and secondary organic aerosol concentrations during SCAQS [J]. Atmospheric Environment, 1995, 29(23): 3527-3544. doi: 10.1016/1352-2310(94)00276-Q [2] CHOW J C, WATSON J G, CHEN L W A, et al. Equivalence of elemental carbon by thermal/optical reflectance and transmittance with different temperature protocols [J]. Environmental Science & Technology, 2004, 38(16): 4414-4422. [3] ANDREAE M O, SCHMID O, YANG H, et al. Optical properties and chemical composition of the atmospheric aerosol in urban Guangzhou, China [J]. Atmospheric Environment, 2008, 42(25): 6335-6350. doi: 10.1016/j.atmosenv.2008.01.030 [4] BOND T C, BHARDWAJ E, DONG R, et al. Historical emissions of black and organic carbon aerosol from energy-related combustion, 1850-2000 [J]. Global Biogeochemical Cycles, 2007, 21(2): 2840. doi: 10.1029/2006gb002840 [5] MKOMA S L, CHI X G, MAENHAUT W. Characterization of carbonaceous materials in PM2.5 and PM10 size fractions in Morogoro, Tanzania, during 2006 wet season campaign [J]. Nuclear Instruments and Methods in Physics Research Section B:Beam Interactions With Materials and Atoms, 2010, 268(10): 1665-1670. doi: 10.1016/j.nimb.2010.03.001 [6] BALACHANDRAN S, PACHON J E, LEE S, et al. Particulate and gas sampling of prescribed fires in South Georgia, USA [J]. Atmospheric Environment, 2013, 81: 125-135. doi: 10.1016/j.atmosenv.2013.08.014 [7] 段卿, 安俊琳, 王红磊, 等. 南京北郊夏季大气颗粒物中有机碳和元素碳的污染特征 [J]. 环境科学, 2014, 35(7): 2460-2467. doi: 10.13227/j.hjkx.2014.07.004 DUAN Q, AN J L, WANG H L, et al. Pollution characteristics of organic and elemental carbon in atmospheric particles in Nanjing northern suburb in summer [J]. Environmental Science, 2014, 35(7): 2460-2467(in Chinese). doi: 10.13227/j.hjkx.2014.07.004
[8] OFFENBERG J H, BAKER J E. Aerosol size distributions of elemental and organic carbon in urban and over-water atmospheres [J]. Atmospheric Environment, 2000, 34(10): 1509-1517. doi: 10.1016/S1352-2310(99)00412-4 [9] DOCKERY D W, POPE C A, XU X, et al. An association between air pollution and mortality in six US cities [J]. The New England Journal of Medicine, 1993, 329(24): 1753-1759. doi: 10.1056/NEJM199312093292401 [10] BISHT D S, DUMKA U C, KASKAOUTIS D G, et al. Carbonaceous aerosols and pollutants over Delhi urban environment: Temporal evolution, source apportionment and radiative forcing [J]. Science of the Total Environment, 2015, 521/522: 431-445. doi: 10.1016/j.scitotenv.2015.03.083 [11] 王广华, 位楠楠, 刘卫, 等. 上海市大气颗粒物中有机碳(OC)与元素碳(EC)的粒径分布 [J]. 环境科学, 2010, 31(9): 1993-2001. doi: 10.13227/j.hjkx.2010.09.006 WANG G H, WEI N N, LIU W, et al. Size distributions of organic carbon (OC) and elemental carbon (EC) in Shanghai atmospheric particles [J]. Environmental Science, 2010, 31(9): 1993-2001(in Chinese). doi: 10.13227/j.hjkx.2010.09.006
[12] VALAVANIDIS A, FIOTAKIS K, VLAHOGIANNI T, et al. Characterization of atmospheric particulates, particle-bound transition metals and polycyclic aromatic hydrocarbons of urban air in the centre of Athens (Greece) [J]. Chemosphere, 2006, 65(5): 760-768. doi: 10.1016/j.chemosphere.2006.03.052 [13] WATSON J G, ZHU T, CHOW J C, et al. Receptor modeling application framework for particle source apportionment [J]. Chemosphere, 2002, 49(9): 1093-1136. doi: 10.1016/S0045-6535(02)00243-6 [14] 吴梦龙, 郭照冰, 刘凤玲, 等. 南京市PM2.1中有机碳和元素碳污染特征及影响因素 [J]. 中国环境科学, 2013, 33(7): 1160-1166. WU M L, GUO Z B, LIU F L, et al. Pollution characteristics and influencing factors of organic and elemental carbon in PM2.1 in Nanjing [J]. China Environmental Science, 2013, 33(7): 1160-1166(in Chinese).
[15] WANG F W, GUO Z G, LIN T, et al. Characterization of carbonaceous aerosols over the East China Sea: The impact of the East Asian continental outflow [J]. Atmospheric Environment, 2015, 110: 163-173. doi: 10.1016/j.atmosenv.2015.03.059 [16] 张懿华, 王东方, 赵倩彪, 等. 上海城区PM2.5中有机碳和元素碳变化特征及来源分析 [J]. 环境科学, 2014, 35(9): 3263-3270. ZHANG Y H, WANG D F, ZHAO Q B, et al. Characteristics and sources of organic carbon and elemental carbon in PM2.5 in Shanghai urban area [J]. Environmental Science, 2014, 35(9): 3263-3270(in Chinese).
[17] WANG Y Q, ZHANG X Y, SUN J Y, et al. Spatial and temporal variations of the concentrations of PM10, PM2.5 and PM1 in China [J]. Atmospheric Chemistry and Physics, 2015, 15(23): 13585-13598. doi: 10.5194/acp-15-13585-2015 [18] FENG T, BEI N F, HUANG R J, et al. Summertime ozone formation in Xi'an and surrounding areas, China [J]. Atmospheric Chemistry and Physics, 2016, 16(7): 4323-4342. doi: 10.5194/acp-16-4323-2016 [19] 蔡彦枫, 王体健, 谢旻, 等. 南京地区大气颗粒物影响近地面臭氧的个例研究 [J]. 气候与环境研究, 2013, 18(2): 251-260. doi: 10.3878/j.issn.1006-9585.2012.11111 CAI Y F, WANG T J, XIE M, et al. Impacts of atmospheric particles on surface ozone in Nanjing [J]. Climatic and Environmental Research, 2013, 18(2): 251-260(in Chinese). doi: 10.3878/j.issn.1006-9585.2012.11111
[20] LIM H J, TURPIN B J. Origins of primary and secondary organic aerosol in Atlanta: Results of time-resolved measurements during the Atlanta Supersite Experiment [J]. Environmental Science & Technology, 2002, 36(21): 4489-4496. [21] 沙丹丹. 长三角地区含碳气溶胶的时空分布特征及来源解析[D]. 南京: 南京信息工程大学, 2018. SHA D D. Seasonal and spatial variations and potential sources of carbonaceous aerosols in the Yangtze River Delta[D]. Nanjing: Nanjing University of Information Science & Technology, 2018(in Chinese).
[22] PANDIS S N, HARLEY R A, CASS G R, et al. Secondary organic aerosol formation and transport [J]. Atmospheric Environment. Part A. General Topics, 1992, 26(13): 2269-2282. doi: 10.1016/0960-1686(92)90358-R [23] ODUM J R, HOFFMANN T, BOWMAN F, et al. Gas/particle partitioning and secondary organic aerosol yields [J]. Environmental Science & Technology, 1996, 30(8): 2580-2585. doi: 10.1021/es950943+https://doi.org/10.1021/es950943+ -


 下载:
下载:


