-
随着工业园区承接的企业逐渐增多,工业园区内的水质成分变得复杂,污染物浓度高,可生化性较差,水质不稳定[1]。工业园区的污水中含有大量溶解性有机物(dissolved organic matter, DOM),其来源和结构影响了水中污染物的生物降解性及重金属迁移转化规律[2]。为实现工业园区污水的高效处理与资源化利用,有必要采用快速、低成本的污染物溯源方法,研究其中DOM的主要来源与归趋。
污染物溯源的方法主要包括13C固态核磁共振波谱技术(13C-NMR)[3]、傅里叶变换红外光谱法(FTIR)[4]、高效液相色谱法(HPLC)[5]、紫外-可见吸收光谱法(UV-Vis)[6]以及三维荧光光谱法(3D-EEMs)[7]等。这些溯源方法各有特点,13C-NMR 具有很高的特异性,但13C的自然存在浓度很低,样品需要扫描较长时间才能累出足够强度的13C-NMR图谱供判读;HPLC可以通过选用特征填料柱与流动相实现对有机组分进行定性分离与分析,但必须用已知物的色谱峰进行对比或与质谱、光谱联用才能获得直接肯定的结果。UV-Vis利用污染物对紫外或者可见光的吸收特性来表征DOM的浓度和来源[8],3D-EEMs则是采用三维激发/发射矩阵实现对有机物进行特异性识别[4],这2种方法具有灵敏度高、操作简单、成本低等特点,因此也被广泛应用于DOM的溯源研究。
由于3D-EEMs获得的荧光图谱中多种荧光组分相互重叠使得荧光数据难以处理,导致对相应的荧光组分溯源造成困难,因此对三维荧光数据的分析尤为重要。为了更清晰地识别DOM的各组分特征,平行因子(parallel factor, PARAFAC)分析方法被应用于解析DOM的荧光光谱。利用PARAFAC分析方法,可以从三维荧光光谱图中提取出不同荧光组分,进而识别DOM中各组分的来源与特征,从而极大程度避免了主观因素对实验分析结果的影响,具有较高的识别效率[9]。LIU[6]采用三维荧光光谱和13C核磁共振波谱,紫外-可见光谱等方法,对滇池3种优势植物的全部有机质(OM)和溶解有机质(DOM)的化学性质进行了研究和比较,讨论了其对湖泊的影响;CHEN等[10]为了评价垃圾有机质和DOM之间的化学成分关系,收集了凋落叶,使用紫外可见分光光度法和荧光分光光度法进行组分提取。尽管国内外很多研究工作将3D-EEMs与PARAFAC分析方法结合,应用于分析湖泊、河流以及土壤中DOM的来源和组成,但鲜有报道利用该方法对工业园区污水处理厂的进水及各处理工艺段的DOM进行溯源研究。
本研究选取某工业园区内的污水处理厂为研究对象,采用紫外-可见光谱以及三维荧光光谱对11个进水管道和处理各工艺段的水样进行了检测,结合PARAFAC探究了污水厂水体中主要污染物的来源和类别,最后对水质参数和各组分的荧光强度进行了相关性分析,评价了污水厂的处理措施对DOM的降解效果,以期为污水厂中特征污染物的处理效果评价提供参考。
-
在所选定工业园区中,各化工厂排放的污水首先经过企业内部污水处理系统进行预处理,当出水水质达到园区污水处理厂的纳管标准后,再排入园区污水处理厂进一步处理。由于该工业园区化工厂生产的产品种类较多,所以污水处理厂进水水质比较复杂。该园区污水处理厂采取的是物化处理结合生物处理工艺,其工艺流程如图1所示。本研究在园区污水处理厂所有进水管道及各处理工艺段取样,每个取样点取3个平行样,使用0.45 μm滤膜抽滤后进行样品检测和分析,主要检测水样的化学需氧量(COD)、氨氮(NH3-N)、电导率、pH、溶解性有机碳(dissolved organic carbon,DOC),紫外-可见吸收光谱(UV-Vis)和三维荧光光谱(3D-EEM)[11]。
-
水质参数检测参照《水和废水监测分析方法》[12]进行,COD值采用快速消解分光光度法(DR 6000,哈希,美国) 测定,NH3-N采用纳氏试剂光度法(L011,上海菁华科技仪器有限公司,中国) 测定,电导率采用电导率计法(DDS-307A,雷磁-上海仪电科学仪器有限公司,中国) 测定,pH采用pH计法(PHS-3C,上海仪电科学仪器股份有限公司,中国) 测定,DOC采用TOC分析仪法(Multi N/C 3100,耶拿分析仪器股份公司,德国) 测定[13]。
-
预过滤样品使用紫外-可见光检测器(SPD-20A,岛津,日本)测定紫外-可见光谱。扫描波长为200~800 nm,水样置于1 cm×1 cm的石英比色皿中,以超纯水为参比,对水样进行连续扫描,每1 nm读数1次,以此得到各水样的光吸收曲线。其中,吸光系数按式(1)计算,为消除杂质引起的光散射,需校正散射效应,矫正方法见式(2)。
式中:α'(λ)为未经过校正的波长λ处的吸收系数,m−1;A(λ)为波长λ处经过校正的吸光度;L为光程路径,m;a(λ)为经过校正的波长λ处的吸收系数,m−1;α(800)为800 nm的吸收系数,m−1。
选用α(280)代表类蛋白物质组分相对浓度,α(355)代表类腐殖质组分相对浓度[14]。DOM的分子质量特征参数(M值)指250 nm和365 nm处吸收系数的比值,可用于估算DOM的分子质量,M值越大,分子质量越小。同时,UVA254是指DOM在254 nm波长下的吸收系数与DOC质量浓度的比值,常用来表示DOM的芳香性。
-
使用荧光分光光度计(F-4600,日立,日本)检测水样的三维荧光光谱。测定前,样品需适当稀释,以减少内滤效应对荧光强度的影响[9],以超纯水为空白样本。仪器光源采用150 W氙灯,光电倍增管电压为700 V,扫描速度为2 400 nm·min−1, 激发波长(Ex)为200~500 nm,发射波长(Em)为200~600 nm, 扫描带宽均为5 nm。使用1 cm×1 cm四面透光石英比色皿[15]。所得三维荧光数据扣除空白样本的光谱信号以去除拉曼散射,再乘以各自稀释倍数,处理后的数据组成三维矩阵数列。
-
在进行PARAFAC分析时,首先创建样品的数据集,其次去除所有样品的拉曼散射和瑞利散射。为了便于建模以及模型验证,需要去除样品中的异常值,异常样品是指杠杆率与其他样品明显不同的样品(杠杆率通过在MATLAB中安装DOM fluor工具箱来计算)。在MATLAB R2018b软件(美国Mathworks公司)中利用PARAFAC对三维荧光数据集进行建模。它使用交替最小二乘法来最小化立方矩阵模型的残差平方和,将三维荧光数据集简化为一个立方矩阵和一个残差矩阵,如式(3)所示[16]。
式中:Xijk是组分数为N的立方阵X(I×J×K)的1个元素,表示样品k在激发波长i处和发射波长j处的荧光强度;N为组分数;ain、bjn和ckn是X的3个基础剖面矩阵A (I×N)、B (J×N)和C (K×N)的元素;eijk表示模型未拟合的三向残差矩阵E的一个元素[17]。
-
采用皮尔逊相关分析考察样品的COD值、NH3-N、pH、电导率、SUVA254与组分最大荧光强度(maximum fluorescence, Fmax)之间的关系,并使用SPSS软件进行统计分析[18]。
-
各化工厂的污染物各不相同,因此,各进水管道的水质参数也不同。在污水处理厂中,各管道进水经调节池混合后,依次进入气浮池、水解酸化池、混凝沉淀池、A2O生物处理、二沉池、催化氧化反应池及斜板沉淀池等工艺段进行处理,分别在各工艺段采样,研究水处理过程中水质参数的变化特征。污水厂各进水管道和处理各工艺段的水质参数如图2所示。在污水处理厂的各工艺段,所有采样点的pH在6.15~7.85,未出现异常值;随着处理工艺的进行,COD值、NH3-N、DOC,SUVA254均呈逐渐下降趋势,电导率整体呈下降趋势,在水解酸化池中略高。由此可以看出,经过水处理工艺,污水中的有机物、氨氮、离子、溶解性有机碳的含量和物质的芳香性均逐渐降低,表明污水厂处理工艺运行效果较好[19]。
-
图3为从完整的荧光数据集中识别出5种大分子组分的三维荧光光谱。表1为5种组分主峰的激发波长和发射波长、种类和文献来源。由表1可见,水样中主要含有类腐殖质荧光团和类蛋白质荧光团。根据之前的研究,其中C1、C2、C3组分为类腐殖酸荧光团[20];C4根据之前的研究分析是类蛋白质荧光团,近似于类色氨酸荧光团,这可能与污水中的沉积物或者内生产物的扩散有关;C5在以前的研究中鲜少出现,属于新组分,可能与工业园区特定污染物组分相关[15]。
-
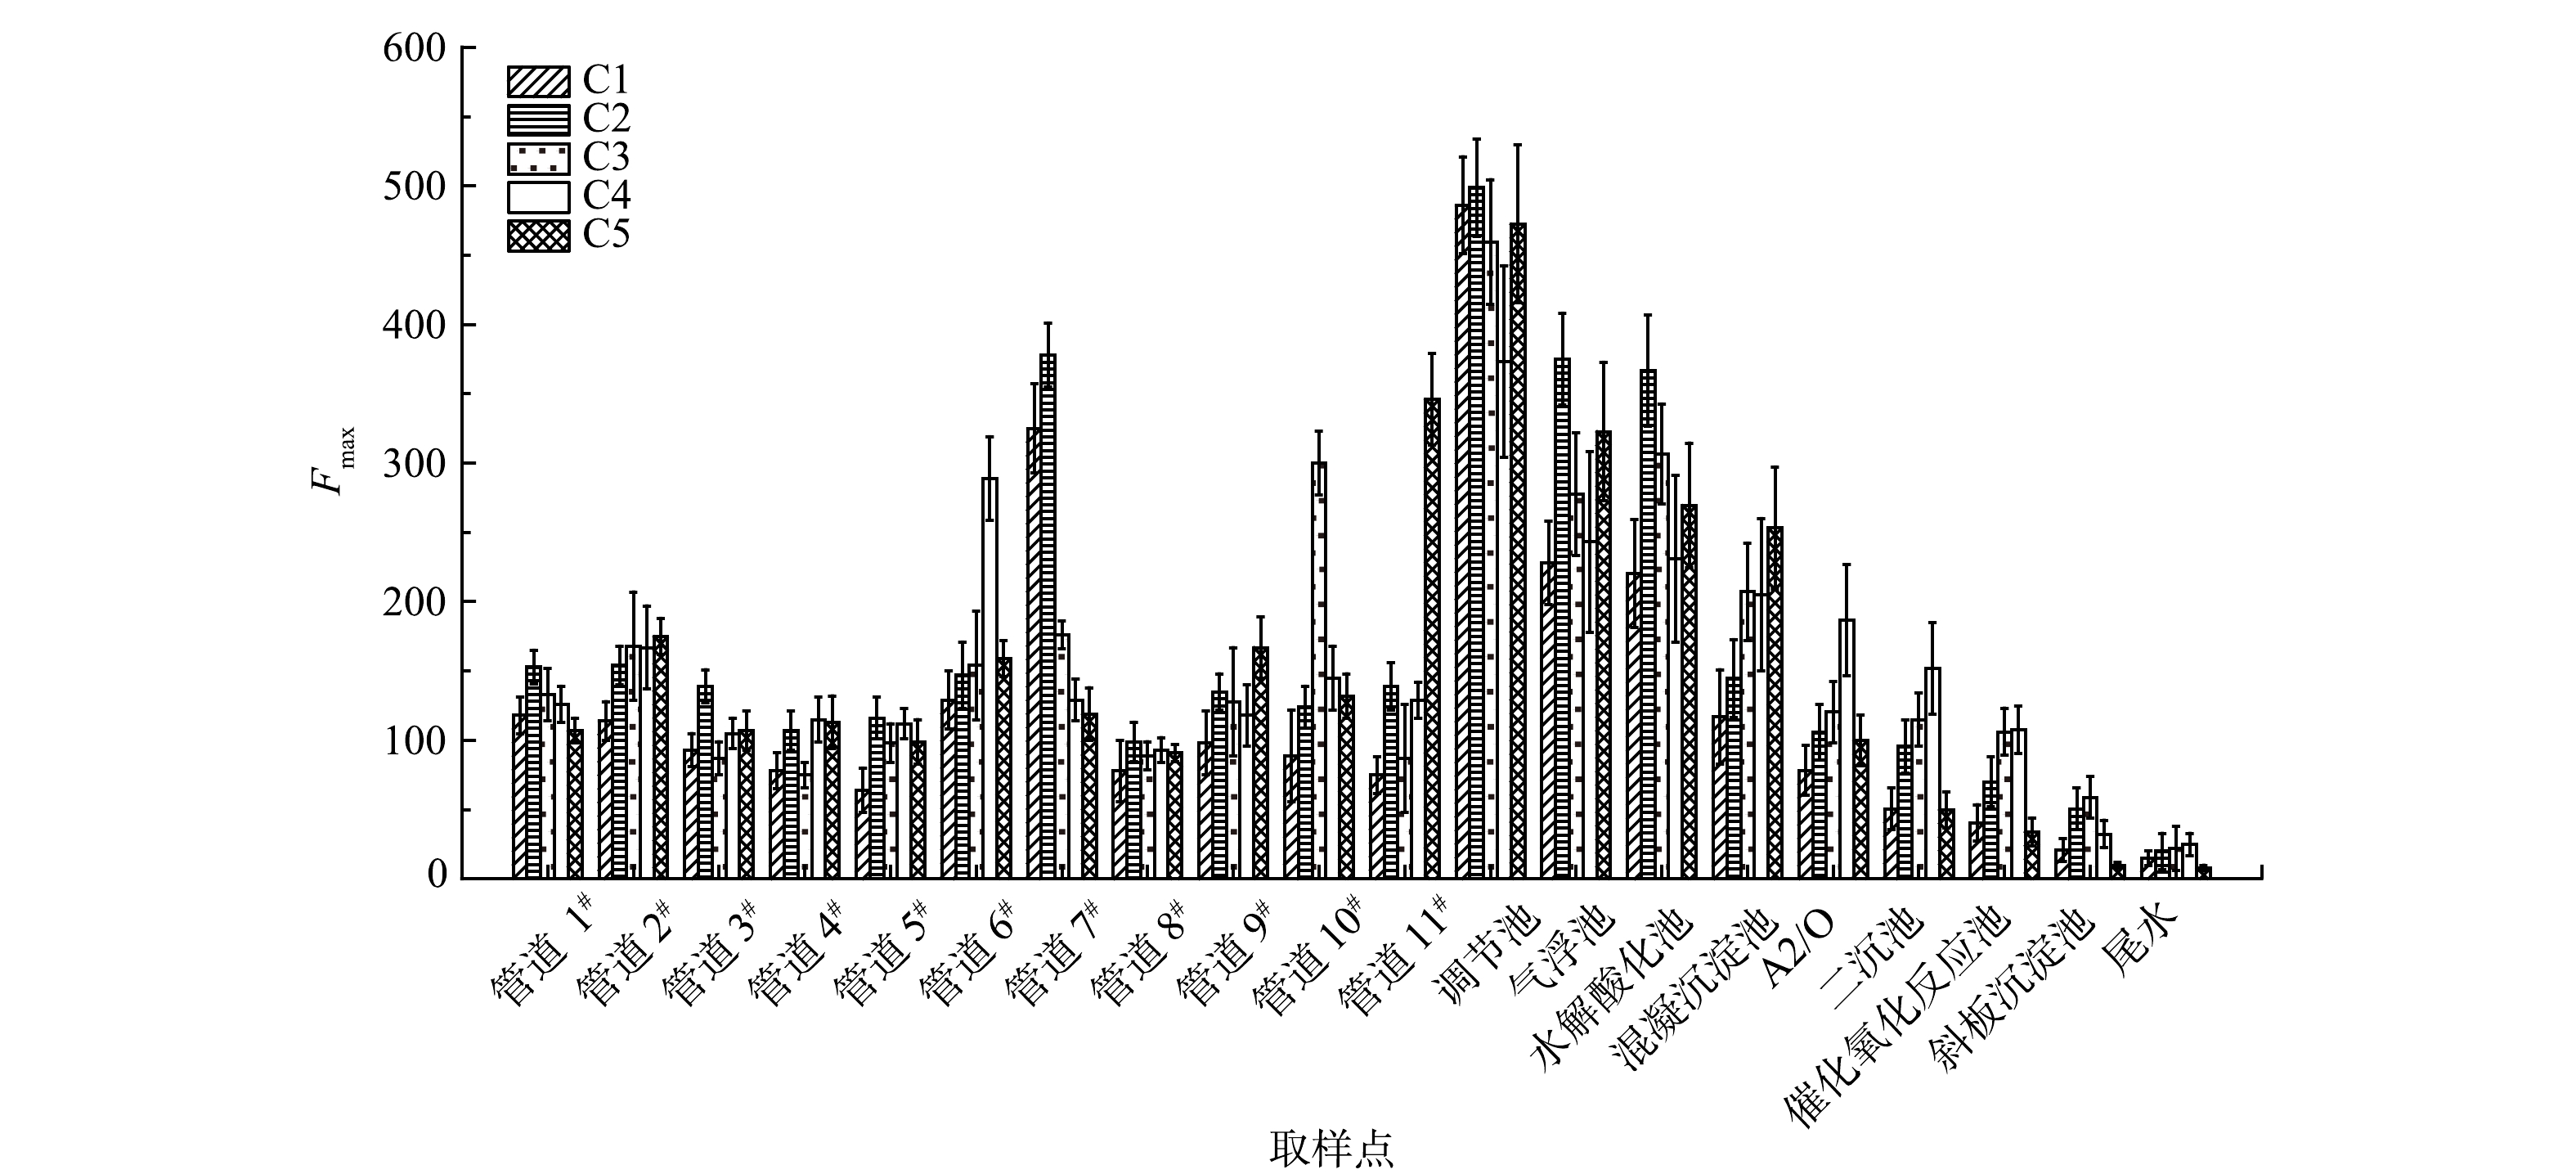
图4反映了各组分在进水管道以及不同工艺段的平均Fmax,表2为5种组分含量在水处理各阶段的变化情况(以调节池为1)。由图4可知,调节池中,C1和C2的含量高于C3,C5与C1含量相当,C4含量最低。经过处理后,尤其是经过A2/O处理以后,所有组分浓度均迅速下降,去除率均达到75%及以上,处理效果较好。污水由气浮池进入水解酸化池后,组分C3的含量增多。这可能是因为在水解酸化池中产生了新物质,而该种物质恰恰类属于C3,因此,C3的Fmax上升。以上结果表明样品主要为类腐殖质荧光物质。
污水处理厂中C1和C2主要来源于7#管道, 7#管道承接的化工厂主要是生产染料的化工厂,生产废水主要含有氰化物和溴化物,且生产染料的原料中含有大量芳香族物质。因此可推测,来源于7#管道的C1和C2分别为氯苯类和溴苯类物质。C3主要来源于10#管道,10#管道承接的化工厂主要是制药类化工厂,生产废水均为高浓度废水,经过厂区现有装置处理后,废水中主要污染物为甲苯类物质。因此可推断,C3可能是大分子的甲苯类物质。C4主要来源于6#管道,通过之前的分析推测C4是色氨酸类物质且较难去除。C5主要来源于11#管道,目前对该组分的研究较少,这可能与该管道中的特征污染物相关。
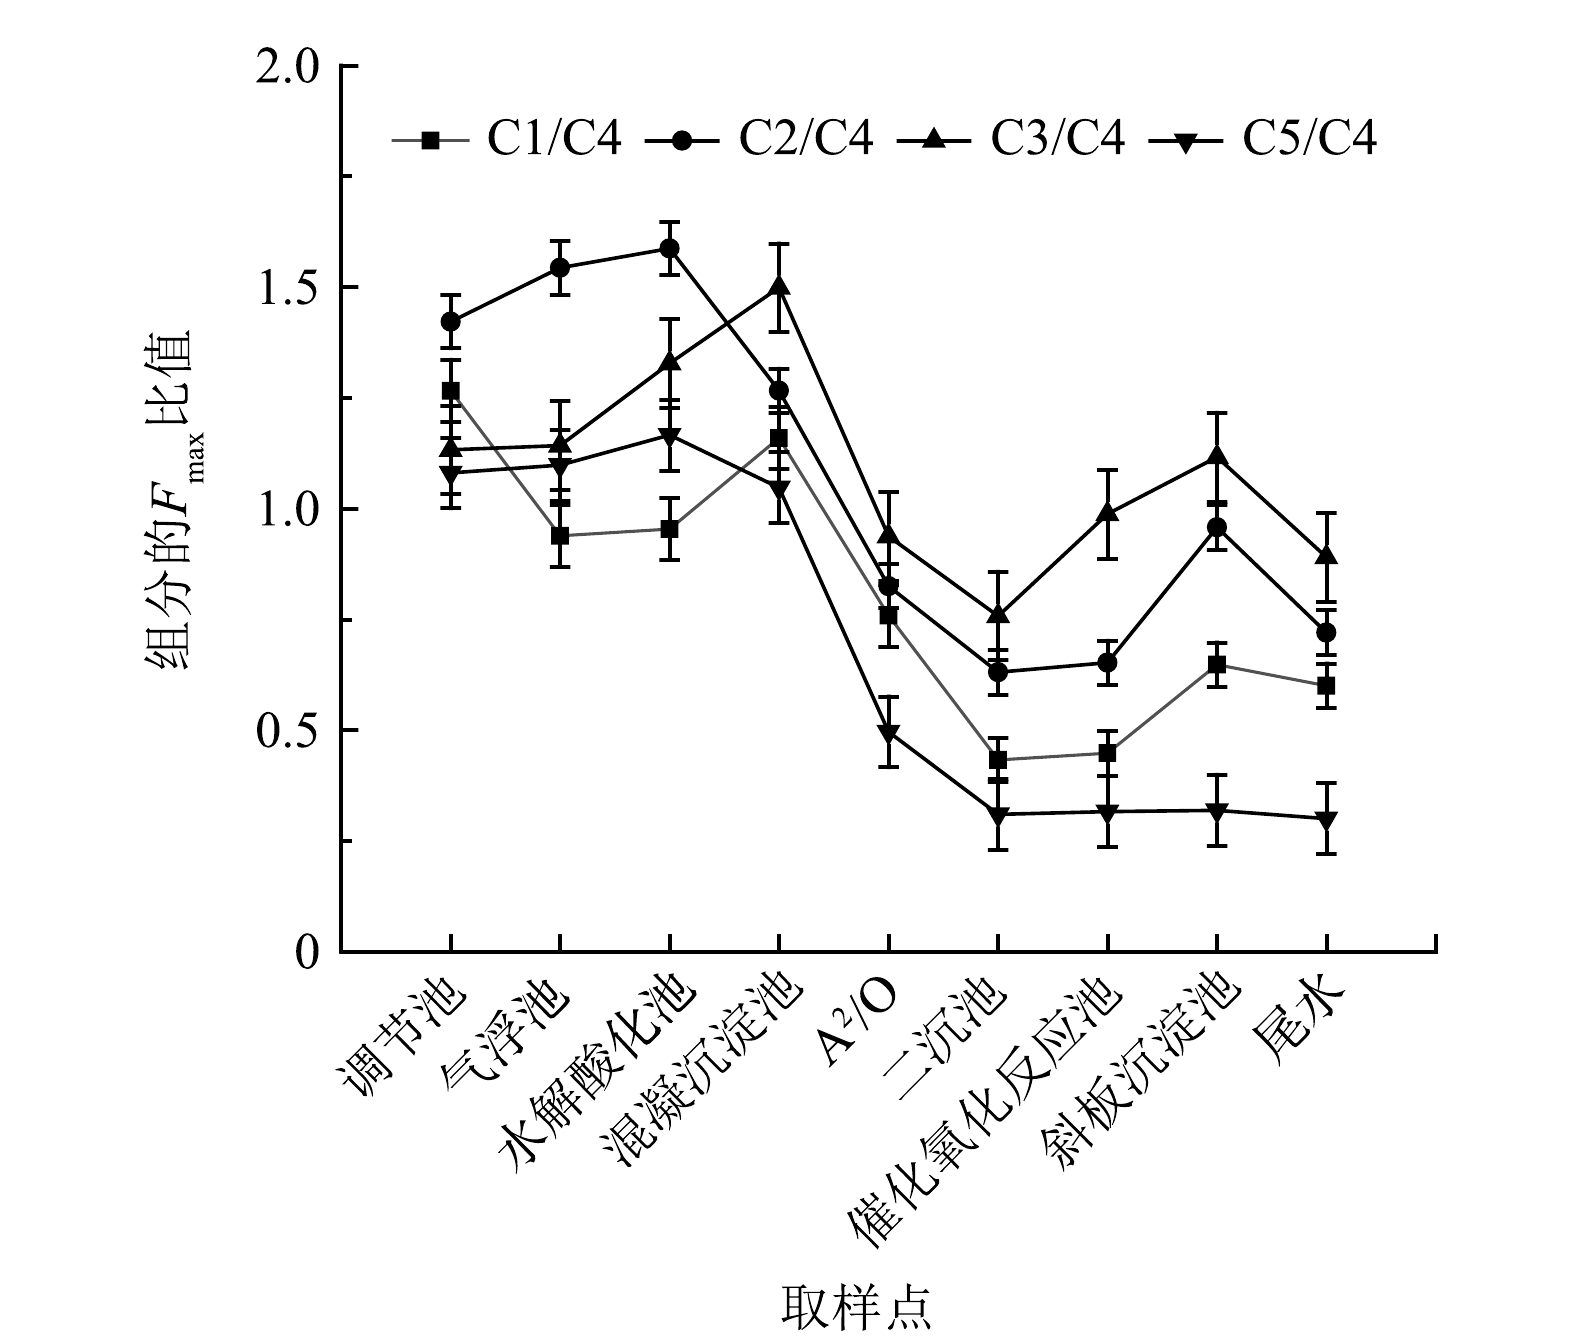
各组分的Fmax比值,特别是类腐殖质和类蛋白质的Fmax比值,可用于比较不同处理过程中DOM组分的优先去除情况[1]。腐殖质组分与类蛋白组分处理过程中Fmax比值的变化如图5所示。气浮池主要去除污水中的悬浮颗粒,在该处理过程中,只有C1/C4的值下降,表明在气浮池中C1优先大量去除,也代表着相比C2和C3,C1类物质疏水性较强而悬浮在污水中;经过混凝沉淀处理工艺后,C2/C4、C5/C4比值均有所下降,表明C2和C5类物质容易与混凝剂络合聚集而被优先除去;经A2/O生物处理和二沉池沉淀分离,4种类腐殖酸组分与类蛋白质组分的Fmax比值均显著下降,此过程中主要有机组分均可被高效去除。
-
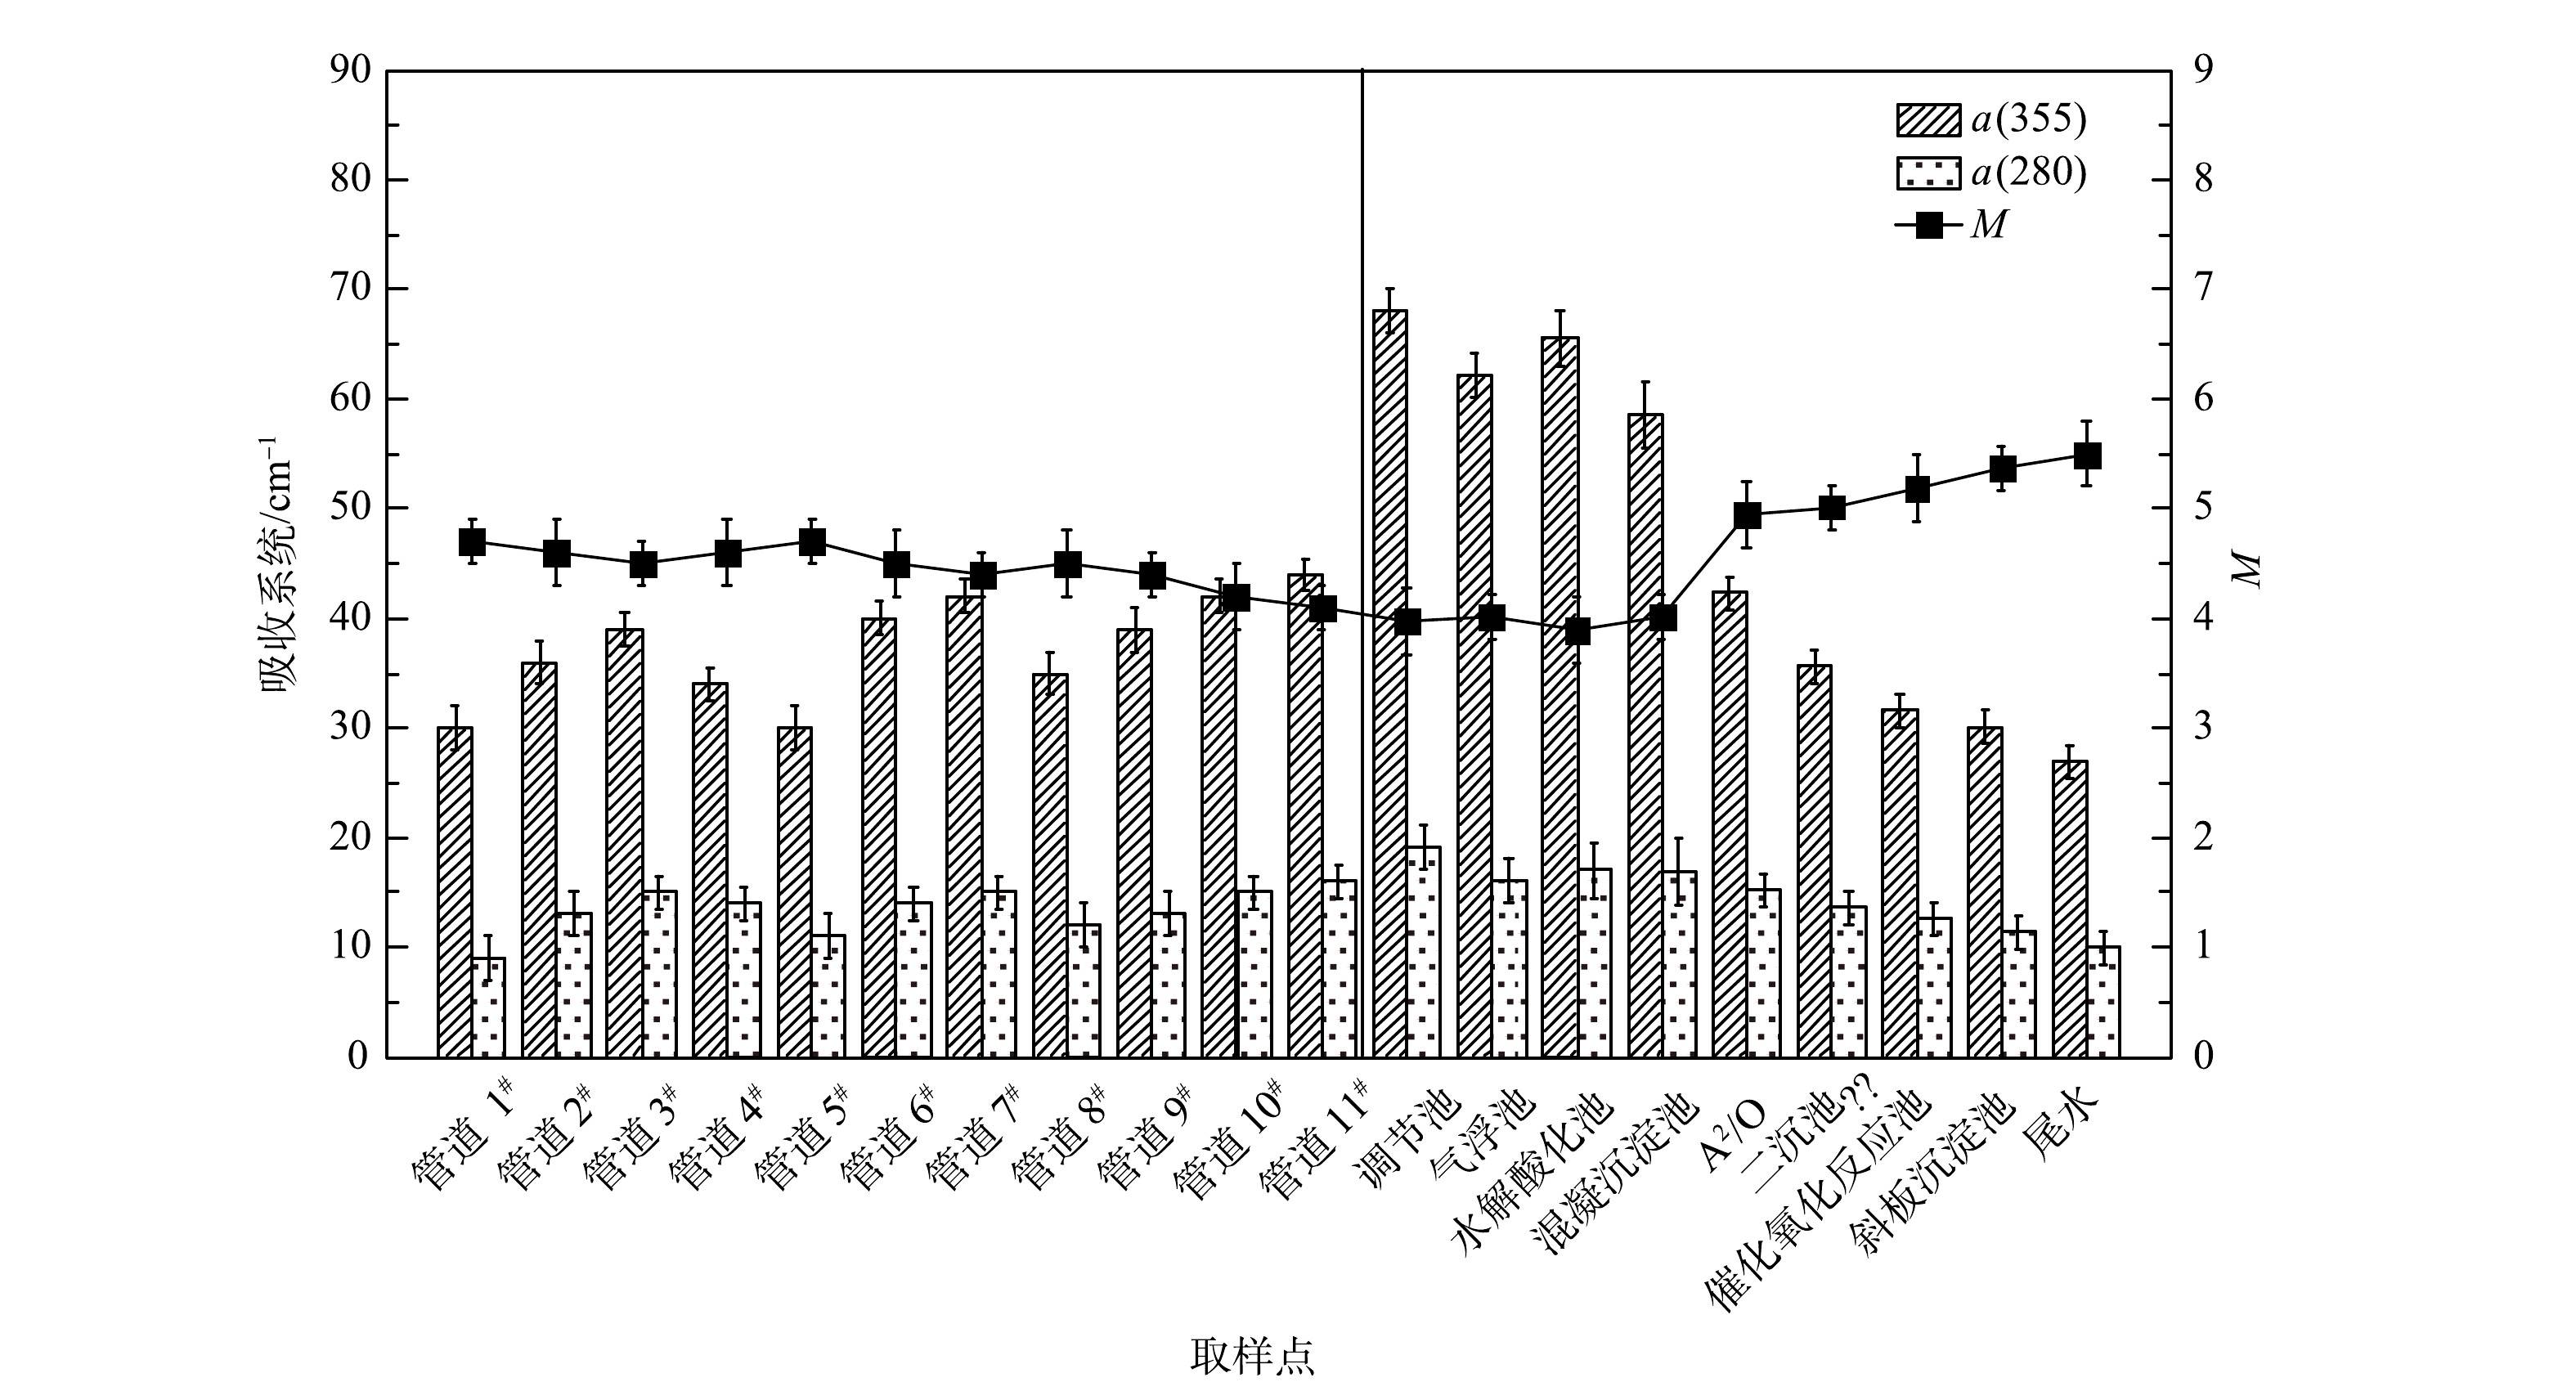
紫外-可见光谱分析方法可以用于有机组分种类及其分子量的定性分析。其中,吸收系数α(280)和α(355)分别代表类蛋白质和类腐殖质的含量;DOM的M值可以表征其相对分子量的大小:M值越大,DOM的分子量越小。由于类腐殖酸的分子量较大,所以其M值较小。如图6所示,在各进水管道以及水处理各工艺段,类腐殖质组分的含量均高于类蛋白质组分的含量。同时,随着水处理的进行,M值逐渐增加,表明DOM分子质量逐渐减小,类腐殖酸含量也逐渐降低。这与图4中荧光分析结果一致。
-
本研究分析了样品的COD值、NH3-N、pH、电导率、SUVA254与5种组分的Fmax之间的相关性,各组分的Fmax与各水质参数的相关性及其对应的P值如表3所示。 C3的Fmax与SUVA254(r=0.960, P<0.01)和电导率 (r=0.935, P<0.01)呈显著正相关;C2的Fmax与NH3-N(r=0.974, P<0.01)之间也呈显著相关; pH与各组分的Fmax之间的相关不显著,且所有荧光组分与COD值之间均存在良好的相关性;相对而言,C1与C2 (r=0.952, P<0.01)也呈显著相关。
由于三维荧光技术具有操作简单、快速等特点,通过建立特征荧光强度与水质参数之间的关联性,使三维荧光技术作为水质评价方法的补充,从而有效提高水环境监测效率。对于本研究来说,可通过C3的荧光强度大致判断污水的芳香度,也可以利用C2的荧光强度推断污水中的NH3-N浓度,而当组分的荧光强度较大时,污水中的COD值较大,但是各组分的荧光强度难以判断污水的pH。C1与C2呈现显著的相关性,据此可推断C1与C2具有高度的同源性,即他们可能来自一个共同的来源。此外,也可以结合污染物的荧光光谱数据,分析主要污染组分的结构特征,筛选高效、低成本的污水处理厂尾水处理工艺。
-
1)该污水处理厂各处理工艺段的水样pH稳定在6.15~7.85,经物化和生物处理后,污水中的COD值、NH3-N、DOC和污染物的芳香性均显著降低,表明该污水厂的处理工艺运行效果良好。
2)三维荧光光谱-平行因子分析结果表明,污水中含有5种荧光组分,其中,C1、C2、C3均属于腐殖酸类物质;C4属于蛋白质类,近似于色氨酸类物质;C5属于新发现的组分,与该工业园区特定污染物组分相关。
3)随着处理工艺的运行,DOM的M值逐渐升高,表明DOM的相对分子质量逐渐降低
4)水样的三维荧光光谱技术可以对水质评价进行有效补充,提高水环境监测效率。
基于三维荧光光谱-平行因子分析法的工业园区污水溶解性有机物溯源与归趋
Tracing and regression of dissolved organic matter in wastewater from the industrial park based on 3D-fluorescence spectrum-parallel factor analysis
-
摘要: 本研究以某工业园区内的污水处理厂为研究对象,使用紫外-可见光谱和三维荧光光谱对11个进水管道和水处理各工艺段的水样进行检测,结合平行因子分析法探究了污水厂水体中主要污染物的来源和类别,最后对水质参数和各组分进行了相关性分析。紫外-可见光谱、三维荧光光谱结合平行因子分析结果表明,污水主要有5种荧光组分,其中C1,C2,C3均属于腐殖酸类物质;C4属于蛋白质类,近似于色氨酸类物质;C5属于新发现的组分。相关性分析结果表明, C3的荧光强度可以大致判断污水的芳香度, C2的荧光强度推断污水中的NH3-N浓度,三维荧光光谱数据可以对水质参数评价进行补充。本研究可为发展高效低成本的污水厂尾水深度处理技术提供参考。Abstract: In this study, a sewage plant in an industrial park was taken as the research object. Both the ultraviolet-visible spectroscopy and three-dimensional fluorescence spectroscopy were used to analyze the water samples from 11 influent pipelines and various stages of wastewater treatment process. Combined with parallel factor analysis, sources and categories of major pollutants in the wastewater were systematically explored. Finally, the correlation between the water quality parameters and its components in water samples was analyzed. The results of UV-Vis spectroscopy, three-dimensional fluorescence spectroscopy combined with parallel factor analysis showed that there were mainly five fluorescent components in the sewage, C1, C2, and C3 belonged to humic acid, C4 belonged to protein, and was similar to tryptophan, C5 belonged to a newly discovered component. The correlation analysis results showed that the fluorescence intensity of C3 was a roughly judge of the aromaticity of sewage, the fluorescence intensity of C2 was an inference of the NH3-N concentration in the sewage, and the three-dimensional fluorescence spectra data could supplement the evaluation of water quality parameters. This research can also provide an important reference for the development of high-efficiently and low-cost advanced treatment processes in industrial sewage plants.
-

-
表 1 5种组分的激发/发射波长、种类以及参考文献
Table 1. Spectral characteristics of the five components identified in this study
表 2 5种组分在水处理各工艺段相对含量变化情况
Table 2. Relative content changes of 5 components at each stage of the water treatment process
水处理工艺段 各组分相对含量a C1 C2 C3 C4 C5 调节池 1.00 1.00 1.00 1.00 1.00 气浮池 0.46 0.75 0.60 0.65 0.68 水解酸化池 0.45 0.73 0.66 0.61 0.57 混凝沉淀池 0.24 0.29 0.45 0.54 0.53 A2/O 0.16 0.21 0.25 0.50 0.21 二沉池 0.10 0.19 0.25 0.40 0.10 催化氧化反应池 0.08 0.14 0.23 0.28 0.07 斜板沉淀池 0.04 0.10 0.13 0.08 0.02 尾水 0.03 0.04 0.04 0.06 0.01 注:a表示设定调节池中各组分相对含量为1。 表 3 各组分的Fmax与各水质参数的相关性以及每个相关性对应的P值
Table 3. Correlation analysis between Fmax of each component and the corresponding P values
Fmax-C1 Fmax-C2 Fmax-C3 Fmax-C4 Fmax-C5 COD值 NH3-N 电导率 pH SUVA254 Fmax-C1 1.000 0.952** 0.771** 0.615** 0.747** 0.868** 0.860** 0.844** 0.772* 0.918** Fmax-C2 — 1.000 0.771** 0.600** 0.747** 0.941** 0.919** 0.932** 0.781* 0.922** Fmax-C3 — — 1.000 0.652** 0.773** 0.929** 0.928** 0.935** 0.780* 0.960** Fmax-C4 — — — 1.000 0.538** 0.881** 0.889** 0.930** 0.763* 0.789** Fmax-C5 — — — — 1.000 0.969** 0.974** 0.914** 0.842** 0.948** COD值 — — — — — 1.000 0.994** 0.940** 0.750** 0.906** NH3-N — — — — — — 1.000 0.935** 0.813** 0.913** 电导率 — — — — — — — 1.000 0.840** 0.949** pH — — — — — — — — 1.000 0.759* SUVA254 — — — — — — — — — 1.000 注:**表示在P<0.01 级别的相关性显著;*表示在P<0.05 级别的相关性显著。 -
[1] BAGHOTH S A, SHARMA S K, AMY G L. Tracking natural organic matter (NOM) in a drinking water treatment plant using fluorescence excitation-emission matrices and PARAFAC[J]. Water Research, 2011, 45(2): 797-809. doi: 10.1016/j.watres.2010.09.005 [2] 陈慧敏, 俞晓琴, 朱俊羽, 等. 太湖有色可溶性有机物(CDOM)对COD及BOD5的指示意义[J]. 湖泊科学, 2021, 33(5): 1376-1388. doi: 10.18307/2021.0507 [3] DING Q, YAMAMURA H, YONEKAWA H, et al. Differences in behaviour of three biopolymer constituents in coagulation with polyaluminium chloride: Implications for the optimisation of a coagulation-membrane filtration process[J]. Water Research, 2018, 133(6): 255-263. [4] ZHENG L, SONG Z, MENG P, et al. Seasonal characterization and identification of dissolved organic matter (DOM) in the Pearl River, China[J]. Environmental Science and Pollution Research, 2016, 23(8): 7462-7469. doi: 10.1007/s11356-015-5999-9 [5] FERGUSON T, BERNICKY A, KOZIN I, et al. HPLC-detector based on hadamard-transform fluorescence excitation-emission-matrix spectroscopy[J]. Analytical Chemistry, 2021, 93(23): 8116-8121. doi: 10.1021/acs.analchem.1c01037 [6] LIU S, HE Z, TANG Z, et al. Linking the molecular composition of autochthonous dissolved organic matter to source identification for freshwater lake ecosystems by combination of optical spectroscopy and FT-ICR-MS analysis[J]. Science of the Total Environment, 2020, 703(3): 764-770. [7] DEPALMA S G S, ARNOLD W R, MCGEER J C, et al. Variability in dissolved organic matter fluorescence and reduced sulfur concentration in coastal marine and estuarine environments[J]. Applied Geochemistry, 2011, 26(3): 394-404. doi: 10.1016/j.apgeochem.2011.01.022 [8] HELMS J R, STUBBINS A, RITCHIE J D, et al. Absorption spectral slopes and slope ratios as indicators of molecular weight, source, and photobleaching of chromophoric dissolved organic matter[J]. Limnology and Oceanography, 2008, 53(3): 955-969. doi: 10.4319/lo.2008.53.3.0955 [9] 张欢. 派河和南淝河溶解性有机质(DOM)光谱分析及污染源解析 [D]. 合肥: 合肥工业大学, 2019. [10] CHEN H, LIU X, BLOSSER G D, et al. Molecular dynamics of foliar litter and dissolved organic matter during the decomposition process[J]. Biogeochemistry, 2020, 150(1): 17-30. doi: 10.1007/s10533-020-00684-5 [11] LIN H, GUO L. Variations in colloidal DOM composition with molecular weight within Individual water samples as characterized by flow field-flow fractionation and EEM-PARAFAC analysis[J]. Environmental Science & Technology, 2020, 54(3): 1657-1667. [12] 国家环境保护总局《水和废水监测分析方法》编委会. 水和废水监测分析方法[M]. (第4版), 北京: 中国环境科学出版社, 2002. [13] 顾乾恒. EEMs-PARAFAC法分析环境中DOM常见组分简述[J]. 广东化工, 2021, 48(16): 87-88. doi: 10.3969/j.issn.1007-1865.2021.16.034 [14] ZHANG Y, LIU M, QIN B, et al. Photochemical degradation of chromophoric-dissolved organic matter exposed to simulated UV-B and natural solar radiation[J]. Hydrobiologia, 2009, 627(1): 159-168. doi: 10.1007/s10750-009-9722-z [15] LARSSON T, WEDBORG M, TURNER D. Correction of inner-filter effect in fluorescence excitation-emission matrix spectrometry using Raman scatter[J]. Analytica Chimica Acta, 2007, 583(2): 357-363. doi: 10.1016/j.aca.2006.09.067 [16] 蒲淑娟, 贺培翔, 张悦, 等. Matlab-三维荧光法对龙头水质的分析研究[J]. 石油化工应用, 2021, 40(5): 102-106. doi: 10.3969/j.issn.1673-5285.2021.05.023 [17] KAMSTRUP-NIELSEN M H, JOHNSEN L G, BRO R. Core consistency diagnostic in PARAFAC2[J]. Journal of Chemometrics, 2013, 27(5): 99-105. doi: 10.1002/cem.2497 [18] YU G H, WU M J, LUO Y H, et al. Fluorescence excitation-emission spectroscopy with regional integration analysis for assessment of compost maturity[J]. Waste Management, 2011, 31(8): 1729-1736. doi: 10.1016/j.wasman.2010.10.031 [19] MIELNIK L, KOWALCZUK P. Optical characteristic of humic acids from lake sediments by excitation-emission matrix fluorescence with PARAFAC model[J]. Journal of Soils and Sediments, 2018, 18(8): 2851-2862. doi: 10.1007/s11368-018-1947-x [20] ZITO P, PODGORSKI D C, JOHNSON J, et al. Molecular-level composition and acute toxicity of photosolubilized petrogenic carbon[J]. Environmental Science & Technology, 2019, 53(14): 8235-8243. [21] DING R, ZHANG D, GAO Y, et al. Characteristics of refractory organics in industrial wastewater treated using a Fenton-coagulation process[J]. Environmental Technology, 2021, 42(22): 3432-3440. doi: 10.1080/09593330.2020.1732476 [22] ZHANG J, YIN H, SAMUEL B, et al. A novel method of three-dimensional hetero-spectral correlation analysis for the fingerprint identification of humic acid functional groups for hexavalent chromium retention[J]. RSC Advances, 2018, 8(7): 3522-3529. doi: 10.1039/C7RA12146F -


 下载:
下载:


