-
工业污染源是大气环境污染的主要因素。工业污染物具有排放总量大、排放占比高等特点,并在气象因素作用下会形成跨域传输现象。精准的大气环境评价可为控制环境污染、制定环境规划、促进资源开发利用提供科学依据。近年来,学者们主要通过质量评价、承载力评价及脆弱性评价等方法对大气环境进行定量研究。如LV等[1]提出了一种新的基于层次分析法和模糊综合评价模型的大气环境质量评价方法;GUO等[2]建立模拟退火-投影寻踪耦合模型,用于区域大气环境承载力评价;傅莉媛等[3]采取改进模糊综合评价法对辽宁省大气环境进行脆弱性分析,可有效预防和规避潜在生态问题。然而,传统的评价方法不能描述大气系统如何应对扰动状况,以及揭示长期适应风险的能力。为契合现代城市大气环境系统扰动因素众多的现状,本课题组引入系统韧性评价方法对城市大气环境系统进行定量模拟,以描述系统在面对扰动因素的冲击下所具备的吸收扰动、减少损失、适应变化、不断学习的能力。
目前,现有研究在韧性评价的指标选取与评价方法层面都取得了丰富成果。在指标选取层面,现有评价指标体系大致分为基于子系统和基于韧性定义角度两类。如NASIRI等[4]指出城市韧性由物质、生态和社会经济等因素决定;夏楚瑜等[5]从抵抗力、适应力和恢复力3个方面构建了城市生态韧性评估模型。然而,现有研究多从静态角度出发,缺乏动态视角下的韧性评价指标选择。在评价方法层面,普遍采用层次分析法、熵值法、GIS空间分析法等方法来评价系统韧性水平。如张明斗等[6]采用层次分析法对我国30个省市区地级及以上城市的韧性度进行综合测算;白立敏等[7]应用熵值法实现对我国地级以上城市韧性的定量评估;修春亮等[8]根据系统韧性构成要素研究的GIS空间分析法对2000—2016年大连市各县市区的城市韧性进行评估。这表明现有研究多注重单一研究方法在韧性评价中的应用,综合应用不同方法分析系统韧性的研究尚不多见。
基于此,本研究将韧性理念应用于城市大气环境系统评价。为了与城市大气环境系统受扰动过程相契合,并从各个层面动态选取韧性评价指标,提出基于PSR (pressure-state-response,PSR) 的韧性评价模型;再综合运用博弈论、熵值法和变异系数法确定不同维度、不同指标的权重;最后基于风险矩阵 (risk matrix,RMA) 理论及PSR模型构造RMA-PSR模型,并结合时空分析手段,对关中城市群2018—2020年各城市大气环境系统韧性水平进行评价。本研究结果可为同类城市群的大气污染跨域传输评估提供参考。
-
在建立城市大气环境系统韧性评价模型前,需明确关中城市群各市工业污染源的分布特征及排放特征,以实现韧性指标的选取;需明确工业污染物的时空排放特征,以实现指标数据的获取,并为下文分析城市大气环境系统韧性时空特征提供数据支撑。
关中城市群以西安为中心,横跨陕西、甘肃、山西三省,地处中国内陆中心。该地区煤炭资源丰富,产业结构以第二产业为主,多为高耗能、高污染行业,在推动关中城市群经济发展的同时也给大气环境带来巨大压力。另外,关中城市群北临黄土高原,南依秦岭山脉,形成了西窄东宽、南北高中间低的喇叭状地形。因此,面对成规模的空气污染时,城市群大气系统内的污染物难以向外扩散,故该区域内大气污染呈现污染范围广、程度深、时间长。根据中国城市统计年鉴,关中城市群各市规模以上工业企业 (年主营业务收入在2 000万元以上的工业企业) 总数及其占比情况,如表1所示。
统计结果表明,关中城市群2018—2020年规模以上工业企业总数分别为5 209、5 540、5 748个。其中,以西安市为首,分别占工业企业总数的26.59%、29.44%、29.00%;宝鸡市、咸阳市、渭南市和运城市次之,约占工业企业总数的10%~20%;临汾市、商洛市、铜川市、天水市、庆阳市和平凉市相对其他城市占比较少,均在工业企业总数的10%以下。
-
为了研究工业污染源排放对城市大气环境系统的影响,需要明确其排放特征。由于各市工业企业数量繁多,无法对每个污染源进行模拟,故参考陕西省污染源环境监测信息发布平台 (http://113.140.66.227:9777/envinfo_ps/zdypublicity/list) 、甘肃省重点排污单位监测数据管理与信息公开系统 (http://61.178.81.9:8080/publish.action) 、运城市排污单位自行监测信息实时发布平台 (http://111.53.77.68/) 、临汾市及运城市排污单位自行监测信息实时发布平台 (http://60.221.251.115:8081/) 公布的相关数据,从各市选取2个主要工业污染源,研究其排放特征。选取依据为地区典型企业、企业规模、污染物排放规模等。如对于关中中部地区,代表城市有西安、咸阳、渭南和宝鸡,该区域内分布着大量重工业企业,如煤炭等能源相关行业及水泥制造业。因此,对该区域的模拟着重选择发电厂、煤电、水泥厂等企业,也有部分企业因企业规模、污染物排放规模较大也被列入选择。例如,选取位于西安市内的三星(中国)半导体有限公司,选取位于宝鸡市内的陕西中烟工业有限责任公司宝鸡卷烟厂。陕南地区的代表城市为商洛。尽管该市资源较丰富,但由于南水北调陕西段全在陕南,故其境内资源无法进行有效开发,大多为中小型企业,因此主要选取该市的重污染企业。甘肃省的天水、平凉和庆阳,以煤炭、石油及水泥制造业为主;山西省的临汾和运城,以钢铁、焦化、火电、水泥制造业为主。因此,在选择以上城市的工业企业时,以典型企业类型为主导,选取污染规模较大的污染源。基于以上分析,选取各工业企业及排放的主要污染物如表2所示。
从排放种类看,各工业企业所排放的大气污染物有10种,分别是二氧化硫、二氧化氮、PM10、PM2.5、非甲烷总烃、氨、硫化氢、汞、甲醇和氟化物。从行业排放看,火力发电厂和化工厂是二氧化硫、二氧化氮、PM10和PM2.5的主要排放源;钢铁厂、化工厂是非甲烷总烃、氨、汞、甲醇和氟化物的主要排放源;炼焦厂、石油开采加工业是硫化氢的主要污染源。从治理措施看,二氧化硫、二氧化氮、PM10和PM2.5具有排放量大、分布广、排放高度低等特点,在十多年前,就已引起多方关注,国家已先后出台《大气污染防治行动计划》、《打赢蓝天保卫战三年行动计划》等污染控制计划治理相关复合大气污染,相关防控措施较为复杂,并结合区域经济和产业布局进行协同治理。而非甲烷总烃、氨、汞、甲醇、氟化物和硫化氢具有毒性大、危害性强的特点,主要采取原辅材料替代、高效治理设施、传统产业升级等手段进行治理。
-
工业企业排放的污染物在气象因素的作用下会扩散至污染源以外的地方。为找出多污染源排放过程中污染负荷的时空分布特征,采集来源于开放平台 Global Data Assimilation System (GDAS) 的气象数据,基于 HYSPLIT 模式,运用欧拉方法模拟日浓度扩散和污染物沉积,以计算出多个污染源每年 (2018—2020年) 对应的污染累积沉降量 (表3) ,并通过ArcGis分别进行栅格化。这里假设各工业企业排放标准符合国家规范,本研究选取的各污染物指标模拟比例根据各污染物浓度限值比例确定,如表4所示。由于篇幅问题,仅呈现能体现污染物时空特征的PM10 2018—2020年的累计污染负荷图 (图1) 。
表3表明,2019年沉降的污染物浓度水平普遍相对较低。而图1表明,污染沉降均以污染源为中心,随气团方向进行扩散,总体呈现出污染中心严重,沿污染方向逐级递减的规律。其中,2018、2020年 (图1 (a) 、 (c) ) 污染范围较为集中,污染沉降较为严重,在西安、铜川、渭南和商洛形成集聚现象;2019年 (图1 (b) ) 则污染范围较广,污染沉降较为分散,但在西安、咸阳、铜川和渭南仍形成集聚现象。分析其原因可能有如下几点:1) 从限制污染排放层面来看,陕西省及甘肃省在2019年出台了一些政策文件引导企业减少污染物排放,如陕西省实行青山保卫战行动方案,甘肃省制定了《企业环境信用评价办法(试行)》;2) 从气象因素层面来看,污染物浓度还受温度、风速、风向、降水量等因素的影响,在冬季会因地表温度较低,极易形成逆温层,不利于大气运动,从而引起污染物的积累,这与WANG等[9]对西安一次重霾事件的形成过程、原因的分析结果一致;3) 风速增大可为污染物扩散过程创造有利条件[10],但在独特的地理条件和风向下,风速的增加反而会导致污染物积累,而关中地区呈喇叭状地形,且常年风速较小,对污染物的吹离效应较低;4) 风向对污染物扩散的影响普遍较弱且不一致[11],但由于关中地区在地形上位于东西方向,偏东风会使位于上风区的污染物扩散至下风区,偏北风则会更容易使位于关中地区的污染物扩散至外部地区,但都容易形成污染物集聚现象;5) 降水由于对污染物具有冲刷效应而成为去除大气污染物的主要机制,但降水对污染物的冲刷作用在污染物浓度相对较高的时候作用较小,如GUO等[12]基于分布式滞后非线性模型(DLNM)揭示了降水对PM2.5的冲刷作用,但该作用在PM2.5浓度相对较高的内陆城市西安远弱于PM2.5浓度较低的沿海城市广州;6) 从区域传输层面来看,关中地区的低风速和静态天气,以及特殊地形使得污染物扩散困难,如关中地区2018年和2020年主导风向为偏东风,2019年主导风向为偏北风,使得导致2019年该市污染物外部输送的广度和浓度明显高于2018年和2020年。
-
1) 基本原理。以现有文献成果为基础,将城市大气环境系统韧性定义为在面对自身污染源和外来污染源造成的扰动压力下系统的状态变化及做出的一系列响应,使其从风险中快速恢复、重构和发展的能力。
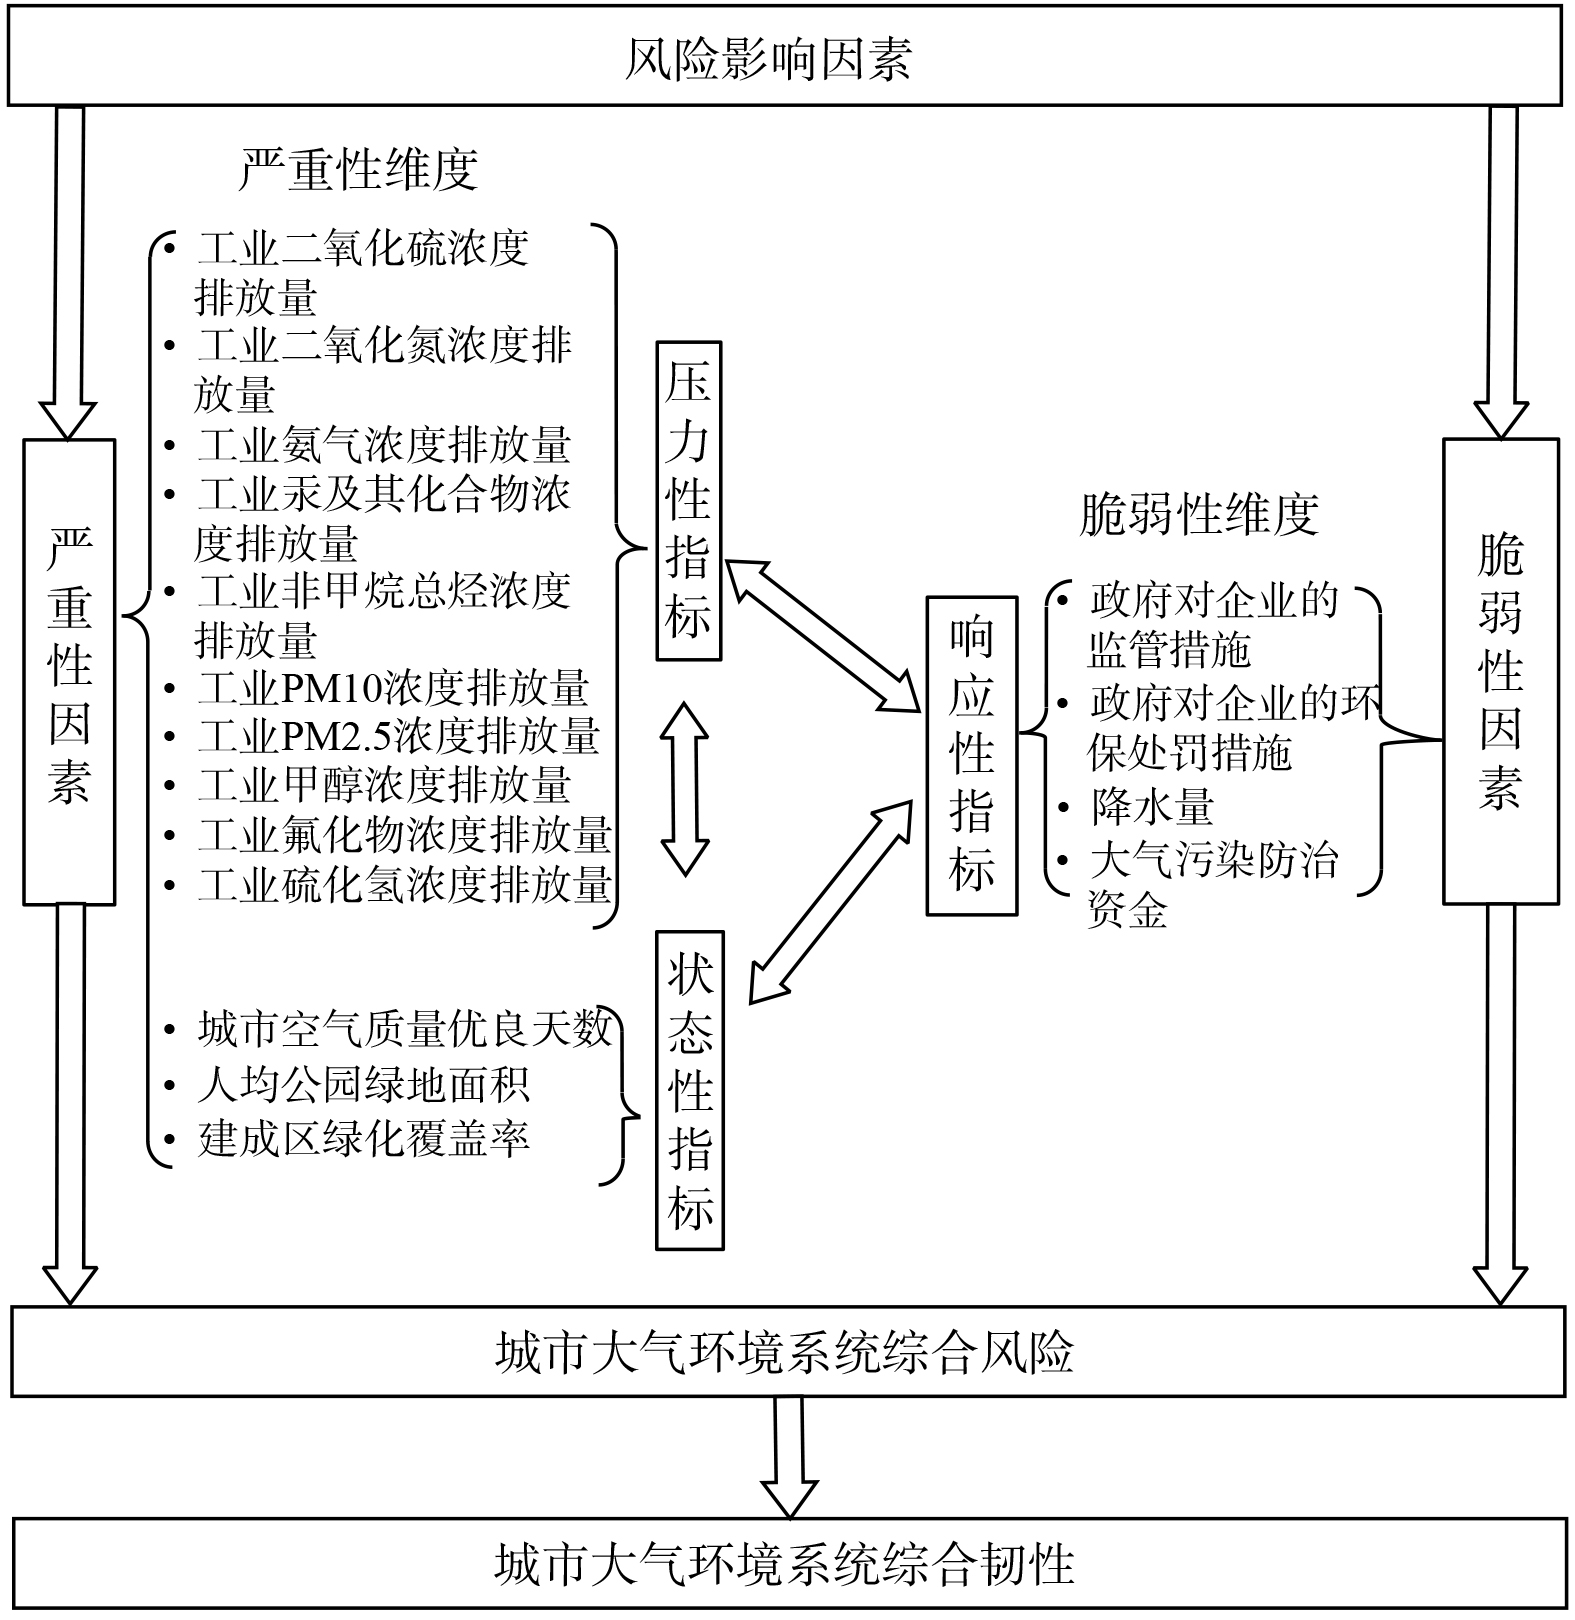
2) 基本方法。压力(pressure)—状态(state)—响应(response)模型常用于环境问题研究[13],风险矩阵法 (RMA) 通常作为进行半定量风险评估的经典工具[14]。本研究结合PSR模型与RMA机制进行城市大气环境系统综合韧性评价,相关机理如图2所示。
风险矩阵 (RMA) 的结构和功能关系定义见式 (1) 。
式中:R代表风险,S代表严重性,V代表脆弱性。其中,风险的严重性或影响可由压力性及状态性指标数据进行描述;城市大气环境系统面对风险的脆弱性则更多受响应性指标数据影响。
考虑各指标的补偿性,研究对传统风险矩阵模型进行扩展,得出城市大气环境系统综合风险评价模型公式 (2) 。由于城市大气环境系统综合风险提升是其综合韧性降低的重要体现,研究进一步将城市大气环境系统综合韧性定义为公式 (3) 。
式中:l表示有
$ l $ 个压力性指标,有$ (m-l) $ 个状态性指标,有$ (n-m) $ 个响应性指标式中,$ {R}_{i} $ 表示城市大气环境系统综合风险;$ {r}_{k} $ 表示第k个指标数据的标准值;$ {w}_{k} $ 表示第$ k $ 个指标所占的权重。公式 (3) 中$ {T}_{i} $ 表示城市大气环境系统综合韧性。 -
根据文献[15-17]的相关研究确定影响城市大气环境系统韧性的内部因素主要有自然禀赋、污染物排放等,外部因素主要有气象因素、人为因素等。本研究在构建城市大气环境系统韧性评价指标体系时,将在文献[4,9,15,18]的基础上,根据工业污染物的排放特征,考虑数据的科学性、代表性、可获取性原则,从影响城市大气环境系统稳定性的扰动压力层面,在遭受扰动压力下城市大气环境系统的状态层面,以及对城市大气环境系统遭受压力和状态发生改变的响应层面分别选取指标,具体如表5所示。
首先,为了消除指标的差异性,使其对评价目标的作用方向同趋化,同时为尽量反映原始数据的比例特征,选用min-max标准化方法对指标体系中的原始数据进行标准化处理,设处理后的数据为
$ {r}_{k} $ ;其次,依靠熵值法和变异系数法两种客观赋权法强大的数学理论,通过博弈论思想得出评价指标的最优权重[19];最后,根据公式 (2) 和 (3) 计算关中城市群2018—2020年各城市大气环境系统的韧性水平。 -
Sobol方法[20]由Sobol于1993年提出,该方法不仅可以定性地分析不同模型参数敏感性程度, 也可以定量地分析各参数的敏感性大小。其核心是将模型输出的总方差可分解为每个参数的方差和参数相互作用的方差之和, 然后通过参数对输出方差的贡献比例进行敏感性分级,帮助模型选择、数据收集、模型校正和不确定性分析[21]。目前已被广泛应用于经济、环境等多个领域。具体方法在此不赘述,可参考文献[20,22,23]。
-
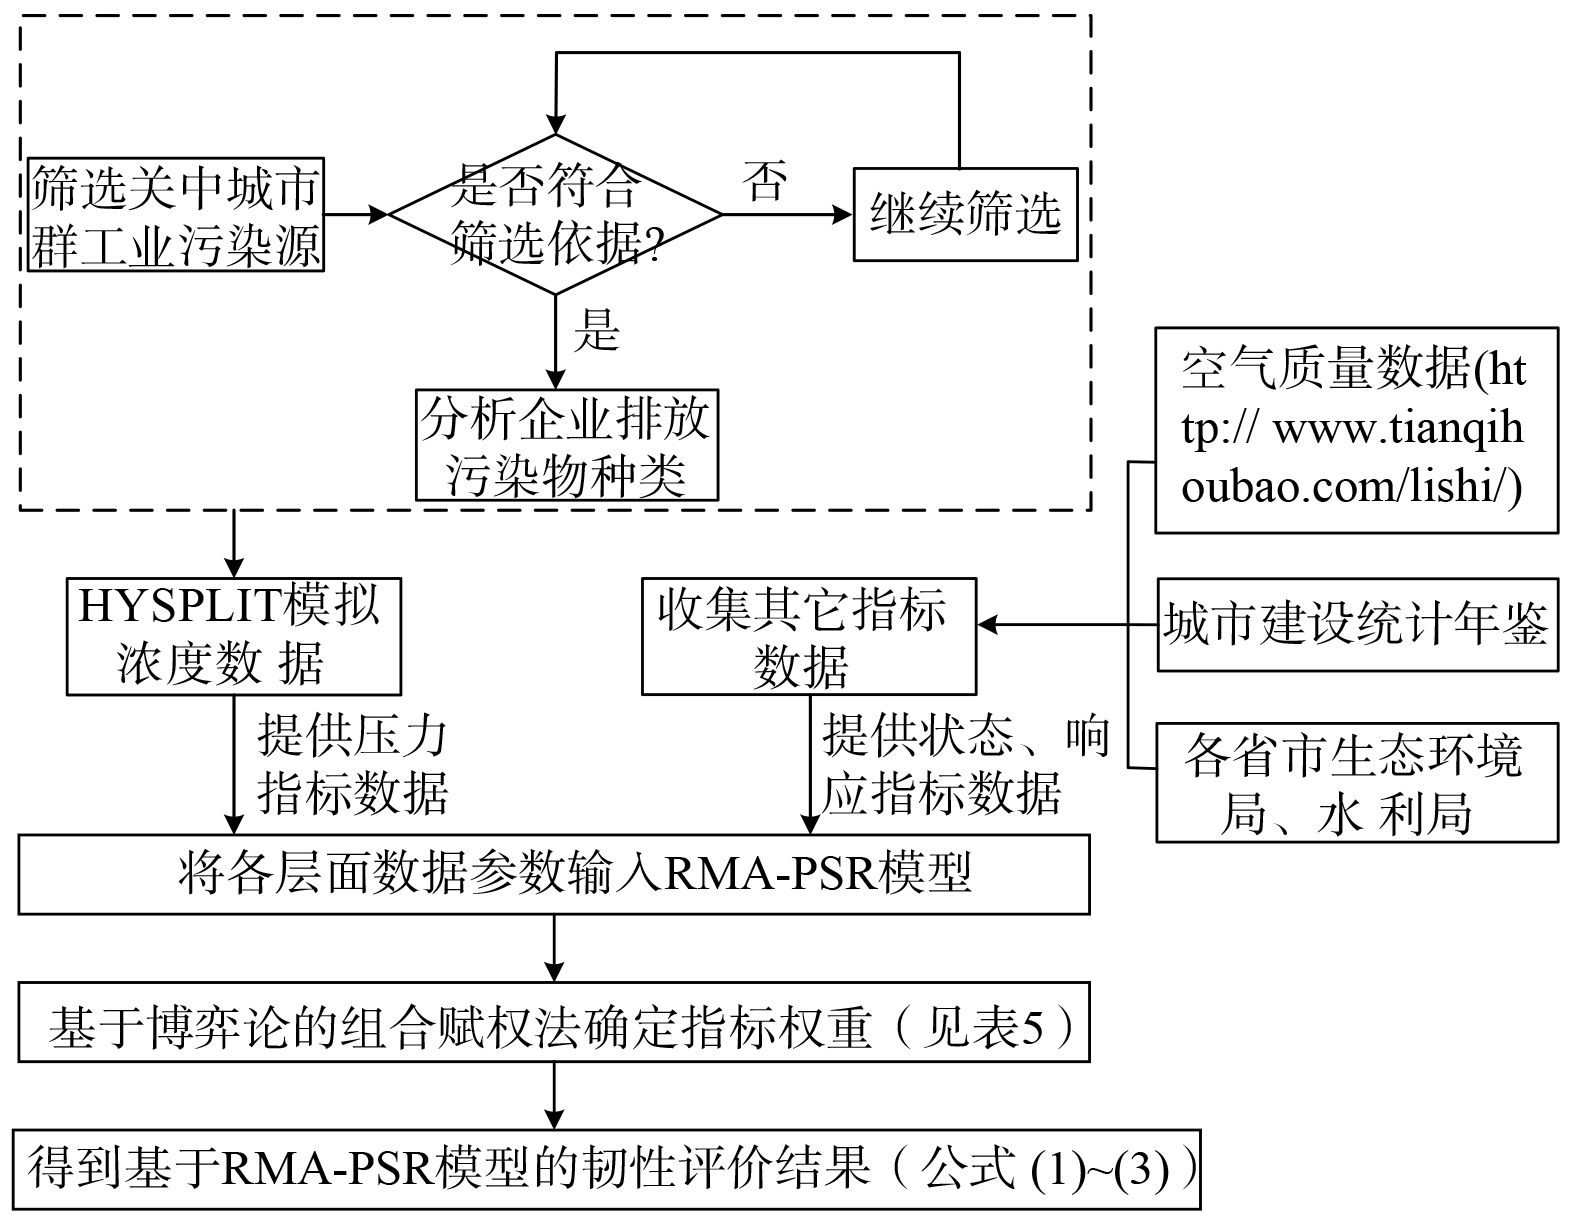
基于RMA-PSR模型的韧性评价流程图 (图3) ,测算得出2018—2020年关中城市群各城市大气环境系统韧性水平的综合评价值,如表6所示。
-
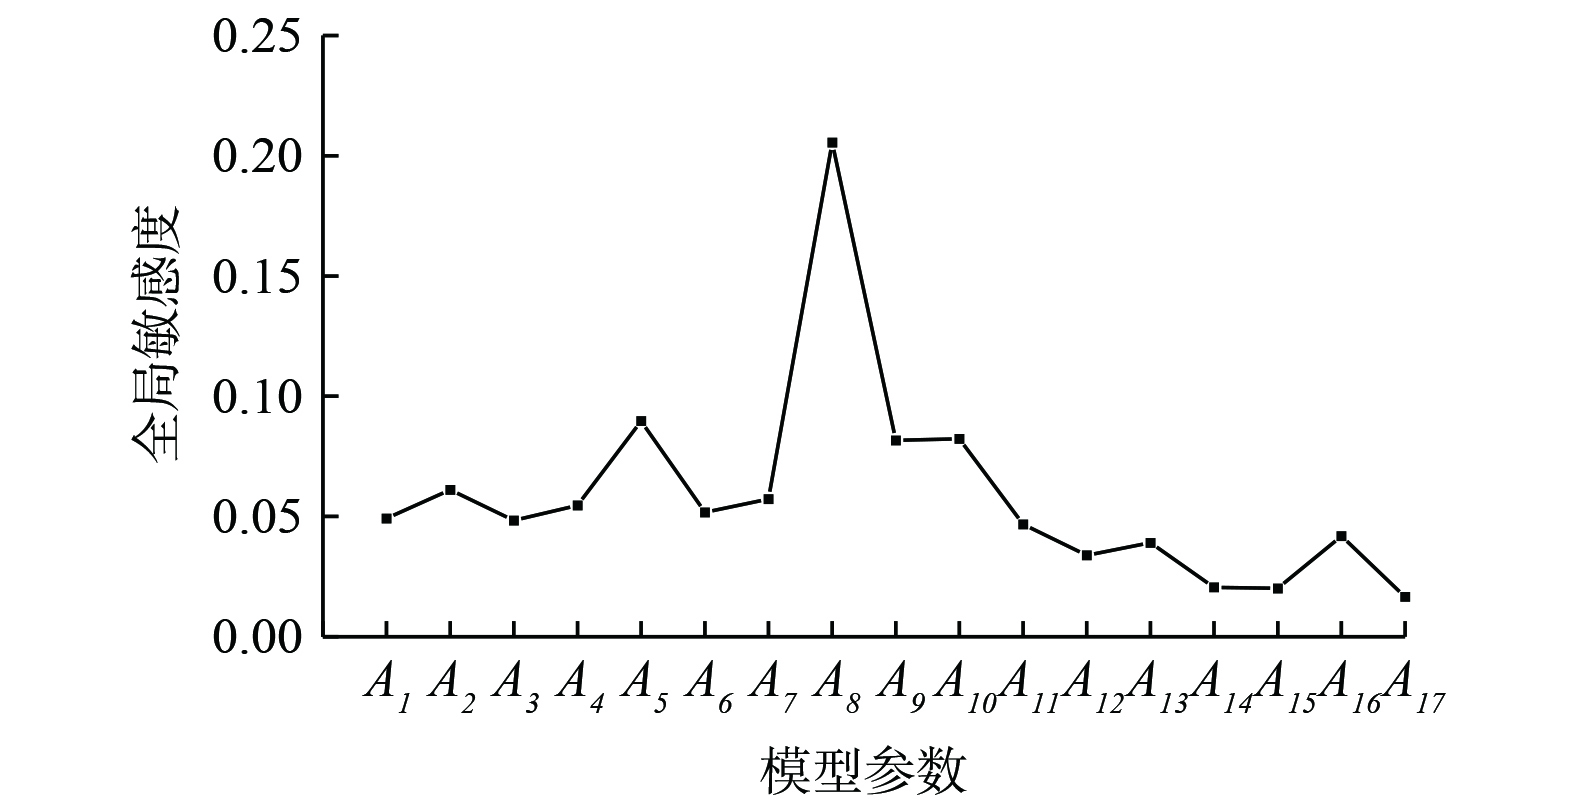
运用Sobol方法对RMA-PSR模型参数进行定量敏感性分析,参与敏感性分析的模型参数为17个,敏感性定量指标选用全局敏感度,采用Sobol Sequence抽样方法[24]生成1000个参数样本,计算结果如图4所示。
根据Sobol方法的敏感性分析结果,最终确定A5、A8、A9和A10为RMA-PSR模型的敏感参数,并认为参数A8为高敏感参数。出现这种情况的原因是这几个参数数据间差异性较大,使参数权重较高,而敏感性分析所采用的目标函数与各参数权重有关,导致这几个参数的敏感性较高。因此,确定导致关中城市群城市大气环境系统韧性差异的主要因素有非甲烷总烃、甲醇、氟化物及硫化氢。
-
为对比不同年份不同城市大气环境系统韧性水平,根据表5数据用Origin表示模拟结果,如图5所示。
首先,2019年关中城市群各城市大气环境系统韧性水平普遍高于2018年和2020年。分析其原因:从状态指标和响应指标风险得分情况来看,整体波动型不大,从压力指标风险得分情况来看,其波动明显,且2019年由压力性指标特别是4个敏感性指标带来的风险普遍低于2018年和2020年;通过时间上的横向对比,2020年各城市大气环境系统整体韧性标准差最大,这说明2020年城市间韧性差异化明显,且根据图5 (c) ,咸阳市是导致差异化显著的主要原因;通过城市间的纵向对比,存在1个城市即咸阳的大气环境系统韧性标准差超过0.100 0,这表明其韧性水平离散程度稍大,城市自身发展不够稳定。这与咸阳市对工业企业污染等一些影响大气质量的“老大难”问题整治力度有关。中央第三生态环境保护督察组督察陕西省时发现,2020年咸阳市区及周边一些企业对大气污染防治要求不落实、治污设施不完善、环境管理粗放,且布局不合理,治污设施水平不高,导致大气污染问题时有发生,给城市大气环境系统带来了更多风险,使得城市大气环境系统韧性较低[25]。
从准则层指标角度分析,这3年里响应性指标带来的风险最为显著,压力性指标次之,状态性指标最小。在响应性指标层面,除西安外的其他城市风险较高,这说明各城市对于工业企业的监管力度不足,大气环境投入建设较少。另外,可在时间尺度上将城市分为响应力度逐渐增加的城市、响应力度基本不变的城市、响应力度逐渐减小的城市3类。其代表城市分别为西安、运城、庆阳,铜川、宝鸡、渭南、商洛、天水、平凉,以及咸阳、临汾。在压力性指标层面,除临汾风险逐渐减小外,其他城市在时间尺度上均表现出先下降后升高的趋势,这说明《临汾市打赢蓝天保卫战三年行动计划》 (临政发〔2018〕16号) 取得一定成果,优化产业结构,推动重污染企业搬迁、制定焦化行业升级改造或淘汰计划、强化工业企业整治管控等措施对于减少污染物排放成效显著。在状态性指标层面,除西安市风险逐渐减小外,其他城市在时间尺度上均表现出先下降后升高的趋势,这说明西安市在“绿水青山就是金山银山”的发展理念下所采取的一系列行动成效显著,如“五路”两侧增绿美化三年行动、品质西安补短板植树增绿提升行动、花园之城建设及2020年为第十四届全运会达到良好的绿化效果所启动的今冬明春大型绿化提升项目等。2018—2019年,西安市区内共建设鲜花大道104条、花 (绿) 墙0.392 km2,建设花田花海4.601km2,全市绿道总长度超过了500 km[26]。
-
根据Arcgis自然断裂法将城市大气环境系统韧性测度结果与分级情况进行空间可视化,如图6所示。2018年,低度韧性区域约占9.09%,较低韧性区域约占36.36%,中度韧性区域约占18.18%,较高韧性区域约占27.27%,高度韧性区域约占9.09%;2019年,低度韧性区域约占9.09%,较低韧性区域约占36.36%,中度韧性区域约占18.18%,较高韧性区域约占18.18%,高度韧性区域约占18.18%;2020年,低度韧性区域约占9.09%,较低度韧性区域约占18.18%,中度韧性区域约占27.27%,较高韧性区域约占27.27%,高度韧性区域约占18.18% 。这表明关中城市群11个城市间的大气环境系统韧性区间划分呈现波动状态。这是由于城市大气环境系统韧性本身是一个动态概念,随着资源禀赋和城市经济发展速度的变化而变化,而关中城市群2018—2020 年城市大气环境系统韧性在空间上呈现“非均衡不稳定性”。这3年里,仅有西安、渭南及平凉达到高度韧性水平,中低韧性区域占绝大部分。“非均衡不稳定性”是指在整个研究区内,城市大气环境系统韧性空间分布不均,具体表现为以西安为代表的韧性较高城市与其他城市呈现一定的空间差异,且城市间大气环境系统韧性在研究期内表现出不稳定态势。
对于城市大气环境系统韧性建设的研究还处于探索阶段,现有研究尚存在局限性。如在污染源选取方面,由于模拟数据以污染源为单位,且需对每个污染源365 d的浓度数据分别进行模拟,需要大量时间,因此,仅选取个别污染源进行研究,使得结果可能存在一定误差。可考虑选取更多污染源或采取其他更加快速准确的方法实现指标数据的获取,使结果更加全面且清晰。
-
1) 推进城市经济发展,完善城市间联防联控机制。关中城市群各市的资源环境要素配置、发展水平、城市大气环境系统韧性水平差异较大,因此,各市应根据其自身优势,发展特色产业,构筑“关中城市群”的产业集群,全面提升关中城市群经济水平,增加大气污染防治投入。另外,大气污染物还具有跨域传输现象,且关中城市群独特的西窄东宽、南北高中间低的喇叭状地形,导致系统内的污染难以向外扩散,因此要加强城市间的经验交流和分工协作,发挥西安的辐射带动作用,完善大气环境共保联治机制。
2) 加强分类管理,促进城市大气环境系统韧性建设。对于西安、铜川、宝鸡、咸阳、渭南、商洛、临汾等区域,应通过对当地高污染企业进行管理,控制工业污染物特别是非甲烷总烃、甲醇、氟化物及硫化氢的排放以减少系统压力;加速当地产业结构升级,鼓励环保领域技术引进和创新,增强城市大气环境系统响应能力。对于运城、天水、平凉、庆阳等区域,应加强基础设施建设,促进绿色产业发展以提高系统的承灾能力;加大政府监管力度,增强系统的响应学习能力。
3) 改善区域间城市大气环境系统韧性的非均衡空间格局。着力提升城市整体大气环境系统韧性水平,保证西安、商洛、平凉、运城、临汾等城市大气环境系统韧性水平稳步增长的同时,不断加大对铜川、宝鸡、咸阳、渭南、天水、庆阳等韧性波动下降地区的扶持与协助。
-
1) 利用Sobol敏感性分析方法对参数进行敏感性分析,核算出非甲烷总烃、甲醇、氟化物及硫化氢属于敏感参数,且甲醇为高敏感参数。
2) 从时间尺度来说,2019年关中城市群各城市大气环境系统韧性水平普遍高于2018年和2020年。另外,通过时间上的横向对比,2020年城市间韧性差异化最为明显;通过城市间的纵向对比,咸阳市大气环境系统韧性水平离散程度最大,城市自身发展最不稳定。
3) 从空间尺度来说,关中城市群2018—2020 年城市大气环境系统韧性呈现“非均衡不稳定性”, 具体表现为以西安市为代表的韧性较高城市与其他城市呈现一定的空间差异,且城市间大气环境系统韧性在研究期内表现出不稳定态势。
面向工业污染源排放的城市大气环境系统韧性评价及其时空演化
Evaluation of the resilience of urban atmospheric system and its spatial and temporal evolution for industrial pollution source emissions
-
摘要: 关中城市群是西部地区两大城市群之一。在该区域内有较多重污染企业。为探索关中城市群各市大气环境系统的韧性水平,将韧性理念应用于城市大气环境系统,并以工业污染源排放为视角,建立基于风险矩阵理论 (RMA) 与PSR的韧性评价模型,利用基于博弈论的组合赋权法确定PSR权重,并采用Sobol方法对模型进行敏感性分析,实现对关中城市群2018—2020年城市大气环境系统韧性时序演化及空间分布的实证分析。结果表明:非甲烷总烃、甲醇、氟化物及硫化氢属于敏感参数,其中甲醇为高敏感参数;从时间维度看,2019年关中城市群各城市大气环境系统韧性水平普遍高于2018年和2020年;从空间维度看,关中城市群各城市大气环境系统韧性水平呈现出“非均衡不稳定性”,3年中仅有西安、渭南及平凉3市达到高度韧性水平,中低韧性区域占绝大部分。提出相应的区域大气污染控制策略,如加强城市间的经验交流和分工协作、发挥西安的辐射带动作用、实施韧性区分类管理等。本研究可为关中城市群城市大气环境系统韧性建设提供参考。
-
关键词:
- 工业污染源 /
- RMA-PSR模型 /
- 敏感性分析 /
- 城市大气环境系统韧性 /
- 时空分析
Abstract: As one of the two major urban agglomerations in the western region, the Guanzhong Urban Agglomeration has a large number of heavy polluting enterprises, and faces huge environmental pressure along with economic growth. In order to explore the level of resilience of the air environment system of each city in the Guanzhong Urban Agglomeration, the concept of resilience was applied to the urban air environment system for the first time, and a resilience evaluation model based on risk matrix theory (RMA) and PSR was established from the perspective of industrial pollution source emissions, the PSR weights were determined by using a combination assignment method based on game theory, and the Sobol method was used for sensitivity analysis of the model to realize an empirical analysis, so as to achieve the empirical analysis of the temporal evolution and spatial distribution of the resilience of the urban atmospheric system in Guanzhong Urban Agglomeration from 2018 to 2020. The results showed that total non-methane hydrocarbons, methanol, fluoride and hydrogen sulfide were sensitive parameters, among which methanol was a highly sensitive parameter; from the time dimension, the resilience level of the air environment system of cities in Guanzhong Urban Agglomeration in 2019 was generally higher than that in 2018 and 2020; from the spatial dimension, the resilience level of the air environment system of cities in Guanzhong Urban Agglomeration showed a "non-equilibrium In the past three years, only Xi'an, Weinan and Pingliang had reached a high level of resilience, and most of the areas with low to medium resilience. In the end, corresponding strategies were proposed, such as strengthening the exchange of experiences and the division of labor among cities, giving play to the role of Xi'an's radiation drive, and implementing the classification and management of resilient areas, to provide ideas and basis for the construction of resilient urban air environment systems in the Guanzhong Urban Agglomeration. -

-
表 1 关中城市群各城市规模以上工业企业总数及占比
Table 1. Total number and propotion of industrial enterprises above designated size in each city of Guanzhong Urban Agglomeration
城市 2018年 2019年 2020年 个数 占比 个数 占比 个数 占比 西安 1 385 26.59% 1 631 29.44% 1 667 29.00% 铜川 235 4.51% 218 3.94% 196 3.41% 商洛 282 5.41% 299 5.40% 291 5.06% 宝鸡 767 14.73% 782 14.12% 844 14.68% 渭南 591 11.35% 601 10.85% 575 10.00% 咸阳 720 13.82% 698 12.60% 725 12.61% 天水 177 3.40% 154 2.78% 163 2.84% 平凉 57 1.09% 69 1.25% 84 1.46% 庆阳 109 2.09% 102 1.84% 96 1.67% 临汾 388 7.45% 435 7.85% 500 8.70% 运城 498 9.56% 551 9.95% 607 10.56% 总计 5 209 100% 5 540 100% 5 748 100% 表 2 关中城市群各城市工业企业总数及主要排放污染物
Table 2. Total number of industrial enterprises and main pollutants emitted in each city of Guanzhong Urban Agglomeration
城市 工业企业 排放主要污染物 西安 大唐陕西发电有限公司西安热电厂 二氧化硫、二氧化氮、PM10、PM2.5、非甲烷总烃 三星(中国)半导体有限公司 二氧化硫、二氧化氮、PM10、PM2.5、非甲烷总烃、氟化物、氨、硫化氢 铜川 陕西铜川声威特种水泥有限公司 二氧化硫、二氧化氮、PM10、PM2.5、氟化物、氨、汞 华能铜川照金煤电有限公司 二氧化硫、二氧化氮、PM10、PM2.5、非甲烷总烃、汞 商洛 陕西商洛发电有限公司 二氧化硫、二氧化氮、PM10、PM2.5、汞 商洛尧柏秀山水泥有限公司 二氧化硫、二氧化氮、PM10、PM2.5、氟化物、氨、汞 宝鸡 陕西中烟工业有限责任公司宝鸡卷烟厂 二氧化硫、二氧化氮、PM10、PM2.5、氨、硫化氢 大唐宝鸡发电有限责任公司 二氧化硫、二氧化氮、PM10、PM2.5、汞 渭南 陕西富平水泥有限公司 二氧化硫、二氧化氮、PM10、PM2.5、氟化物、氨、汞 华能陕西秦岭发电有限公司 二氧化硫、二氧化氮、PM10、PM2.5、汞 咸阳 冀东海德堡 (泾阳) 水泥有限公司 二氧化硫、二氧化氮、PM10、PM2.5 陕西咸阳化学工业有限公司 二氧化硫、PM10、PM2.5、非甲烷总烃、甲醇、氨、硫化氢、汞 天水 天水中材水泥有限责任公司 二氧化硫、二氧化氮、PM10、PM2.5 甘谷祁连山水泥有限公司 二氧化硫、二氧化氮、PM10、PM2.5 平凉 华能平凉发电有限责任公司 二氧化硫、二氧化氮、PM10、PM2.5、氨、汞 平凉海螺水泥有限责任公司 二氧化硫、二氧化氮、PM10、PM2.5、氟化物、氨、汞 庆阳 中国石油化工股份有限公司华北油气分公司镇
原蒲河项目部二氧化硫、二氧化氮、PM10、PM2.5 中国石油天然气股份有限公司庆阳石化分公司 二氧化硫、二氧化氮、PM10、PM2.5、氨、硫化氢 临汾 山西兆光发电有限责任公司 二氧化硫、二氧化氮、PM10、PM2.5、氨、汞 山西焦化股份有限公司 二氧化硫、二氧化氮、PM10、PM2.5 运城 山西丰喜华瑞煤化工有限公司 二氧化硫、二氧化氮、PM10、PM2.5、非甲烷总烃、氨、硫化氢、汞 山西大唐国际运城发电有限责任公司 二氧化硫、二氧化氮、PM10、PM2.5、非甲烷总烃、氨、汞 表 3 关中城市群2018—2020年不同污染物累积沉降量范围
Table 3. Range of cumulative deposition of different pollutants in the Guanzhong Urban Agglomeration from 2018 to 2020
µg∙m−3 年份 PM10 PM2.5 二氧化硫 二氧化氮 氨 甲醇 汞 硫化氢 非甲烷总烃 氟化物 2018 0.006~
368.260.006~
185.970.008~
318.110.006~
208.460.04~
1005.410.85~
8873.650.000 2~
0.250.001~
52.220.05~
612.340.004~
99.512019 0.006~
192.290.004~
97.530.005~
176.050.005~
105.240.05~
537.520.80~
4500.950.000 007~
0.090.002~
26.180.05~
544.380.003~
53.962020 0.008~
429.250.004~
214.790.008~
357.210.005~
232.200.04~
988.080.70~
12357.000.000 009~
0.240.002~
44.620.05~
847.880.004~
100.31表 4 污染物指标模拟比例及限值
Table 4. Pollutant indicator simulation ratio and limit value
序号 污染物 质量浓度限值/(µg∙m-3) 模拟比例 限值标准 1 二氧化硫 60 0.016 597 环境空气质量标准 (GB 3095-2012) 2 二氧化氮 40 0.011 065 3 PM10 70 0.019 364 4 PM2.5 35 0.009 682 5 汞 0.05 0.000 014 6 氨 200 0.055 324 工业企业设计卫生标准 (TJ 36-79) 7 硫化氢 10 0.002 766 8 氟化物 20 0.005 532 9 甲醇 3 000 0.829 864 10 非甲烷总烃 200 0.055 324 《大气污染物综合排放标准详解》 注:序号1~5、10为年平均限值;序号6、7、8、9为一次排放限值。 表 5 城市大气环境系统韧性评价体系
Table 5. Urban atmospheric system resilience evaluation system
目标层 准则层 指标层 指标单位 指标含义 数据来源 权重 城市大气
环境韧性压力 $ {A}_{1}: $ µg∙m-3 二氧化硫污染强度 (−) HYSPLIT模式浓度模拟 0.033 9 $ {A}_{2}: $ µg∙m-3 二氧化氮污染强度 (−) 0.039 1 $ {A}_{3}: $ µg∙m-3 氨气污染强度 (−) 0.020 1 $ {A}_{4}: $ µg∙m-3 汞及其化合物污染强度 (−) 0.016 6 $ {A}_{5}: $ µg∙m-3 非甲烷总烃污染强度 (−) 0.049 2 $ {A}_{6}: $ µg∙m-3 PM10污染强度 (−) 0.046 7 $ {A}_{7}: $ µg∙m-3 PM2.5污染强度 (−) 0.020 5 $ {A}_{8}: $ µg∙m-3 甲醇污染强度 (−) 0.041 8 $ {A}_{9}: $ µg∙m-3 氟化物污染强度 (−) 0.061 1 $ {A}_{10}: $ µg∙m-3 硫化氢污染强度 (−) 0.051 7 状态 $ {A}_{11}: $ d 城市大气环境质量 (+) http://www.tianqihoubao.com/lishi/ 0.057 3 $ {A}_{12}: $ m2 城市整体环境水平 (+) 城市建设统计年鉴 0.048 3 $ {A}_{13}: $ % 城市绿化程度 (+) 0.205 5 响应 $ {A}_{14}: $ 次 政府的监管力度 (+) 各省市生态环境局 0.054 6 $ {A}_{15}: $ 次 表明企业基本的环保意识和环保水平 (+) 0.082 3 $ {A}_{16}: $ mm 有利于清除和冲刷污染物 (+) 各省市水利局 0.089 7 $ {A}_{17}: $ 万元 防治污染物力度 (+) 各省市生态环境局 0.081 6 表 6 关中城市群各城市大气环境系统韧性评价结果
Table 6. Results of atmospheric system toughness evaluation for cities in Guanzhong Urban Agglomeration
城市和项目 2018年 2019年 2020年 均值 标准差 西安 0.844 5 0.960 6 0.943 2 0.916 1 0.051 1 铜川 0.860 3 0.886 9 0.792 0 0.846 4 0.040 0 宝鸡 0.856 8 0.908 0 0.825 6 0.863 5 0.034 0 咸阳 0.766 8 0.845 1 0.582 6 0.731 5 0.110 0 渭南 0.903 3 0.928 3 0.721 4 0.851 0 0.092 2 商洛 0.794 4 0.936 0 0.866 6 0.865 7 0.057 8 运城 0.802 9 0.879 5 0.897 8 0.860 1 0.041 1 临汾 0.844 0 0.893 4 0.941 2 0.892 9 0.039 7 天水 0.864 2 0.920 0 0.838 6 0.874 3 0.034 0 平凉 0.725 6 0.948 2 0.879 1 0.851 0 0.093 0 庆阳 0.770 4 0.891 9 0.753 6 0.805 3 0.061 6 均值标准差 0.821 2 0.908 9 0.822 0 — — 0.050 6 0.032 2 0.101 4 — — -
[1] LV W, JI S. Atmospheric environmental quality assessment method based on analytic hierarchy process[J]. Discrete & Continuous Dynamical Systems-S, 2019, 12(4/5): 941-955. [2] ZHANG M, LIU Y, WU J, et al. Index system of urban resource and environment carrying capacity based on ecological civilization[J]. Environmental Impact Assessment Review, 2018, 68: 90-97. doi: 10.1016/j.eiar.2017.11.002 [3] 傅莉媛, 孙丛婷, 祝志川. 基于改进模糊综合评价法的区域大气环境脆弱性分析[J]. 数学的实践与认识, 2021, 51(24): 133-145. doi: 10.3969/j.issn.1000-0984.2021.24.sxdsjyrs202124014 [4] NASIRI N A, AL-AWADHI T, HEREHER M, et al. Changing urban ecology a challenge for coastal urban resilience: a study on Muscat[J]. Environment and Urbanization ASIA, 2020, 11(1): 10-28. doi: 10.1177/0975425320906307 [5] 夏楚瑜, 董照樱子, 陈彬. 城市生态韧性时空变化及情景模拟研究——以杭州市为例[J]. 生态学报, 2022, 42(1): 116-126. [6] 张明斗, 冯晓青. 中国城市韧性度综合评价[J]. 城市问题, 2018(10): 27-36. [7] 白立敏, 修春亮, 冯兴华, 等. 中国城市韧性综合评估及其时空分异特征[J]. 世界地理研究, 2019, 28(6): 77-87. doi: 10.3969/j.issn.1004-9479.2019.06.2018403 [8] 修春亮, 魏冶, 王绮. 基于“规模—密度—形态”的大连市城市韧性评估[J]. 地理学报, 2018, 73(12): 2315-2328. [9] 焦柳丹, 邓佳丽, 吴雅, 等. 基于PSR+云模型的城市韧性水平评价研究[J]. 生态经济, 2022, 38(5): 114-120. [10] WANG S, LIAO T, WANG L, et al. Process analysis of characteristics of the boundary layer during a heavy haze pollution episode in an inland megacity, China[J]. Journal of Environmental Sciences, 2016, 40: 138-144. doi: 10.1016/j.jes.2015.12.008 [11] HE J, GONG S, YU Y, et al. Air pollution characteristics and their relation to meteorological conditions during 2014—2015 in major Chinese cities[J]. Environmental Pollution, 2017, 223: 484-496. doi: 10.1016/j.envpol.2017.01.050 [12] CHEN Z, XIE X, CAI J, et al. Understanding meteorological influences on PM2.5 concentrations across China: a temporal and spatial perspective[J]. Atmospheric Chemistry & Physics Discussions, 2018: 1-30. [13] GUO L, ZHANG Y, LIN H, et al. The washout effects of rainfall on atmospheric particulate pollution in two Chinese cities[J]. Environmental pollution, 2016, 215: 195-202. doi: 10.1016/j.envpol.2016.05.003 [14] 王光辉, 王雅琦. 基于风险矩阵的中国城市韧性评价——以284个城市为例[J]. 贵州社会科学, 2021(1): 126-134. [15] 朱海勇, 张守鑫, 刘加珍, 等. 山东省空气质量的时空特征及影响因素分析[J]. 环境污染与防治, 2022, 44(9): 1228-1233+1240. [16] 周郡娇, 卢妍, 张赢心, 等. 淮安市大气环境质量状况及其影响因素分析[J]. 淮阴师范学院学报(自然科学版), 2021, 20(4): 319-324. [17] 张鹏, 于伟, 张延伟. 山东省城市韧性的时空分异及其影响因素[J]. 城市问题, 2018(9): 27-34. [18] 杨文培, 何曙慧, 杨潘. 基于DPSIR模型的城市大气评价指标设计[J]. 统计与决策, 2017(3): 59-62. [19] ZHANG H, LU M, KE X, et al. Evaluation model of black-start schemes based on optimal combination weights and improved VIKOR method[J]. International Journal of Electrical Power & Energy Systems, 2021, 129(4): 106762. [20] SOBOL I M. Sensitivity analysis for non-linear mathematical models[J]. Mathematical Modeling & amp; Computational Experiment, 1993, 1: 407-414. [21] 陈卫平, 涂宏志, 彭驰, 等. 环境模型中敏感性分析方法评述[J]. 环境科学, 2017, 38(11): 4889-4896. [22] 王复生, 田娟. 基于Sobol方法的MIKE NAM模型参数敏感性分析[J]. 水利规划与设计, 2022(11): 100-103. doi: 10.3969/j.issn.1672-2469.2022.11.019 [23] 刘松, 佘敦先, 张利平, 等. 基于Morris和Sobol的水文模型参数敏感性分析[J]. 长江流域资源与环境, 2019, 28(6): 1296-1303. [24] SALTELLI A, ANNONI P, AZZINI I, et al. Variance based sensitivity analysis of model output: Design and estimator for the total sensitivity index[J]. Computer Physics Communications, 2010, 181(2): 259-270. doi: 10.1016/j.cpc.2009.09.018 [25] 中工网. 中央生态环境保护督察集中通报第四批4个典型案例[EB/OL]. (2022-1-9)[2023-2-5].https://www.workercn.cn/c/2022-01-09/6856030.shtml,2022.01.09. [26] 西安日报. 西部六省(区)中心城市园林科技信息网会第38次会议在西安召开[EB/OL]. (2019-4-17)[2023-2-5]. https://baijiahao.baidu.com/s?id=1647619774264537467&wfr=spider&for=pc. -


 下载:
下载:


