-
水资源是社会发展的重要资源支撑,而快速城市化带来的城市扩张和人口聚集使水资源供需矛盾不断凸显[1-2],特别是在经济发展较快的我国东部沿海地区[3]。水污染治理是保障水资源供需平衡的重要一环,也影响着人民群众的身体健康[4]。我国的经济发展与水体污染物排放存在双向因果关系[5]。探究适合我国经济发达地区,特别是人口密集的县级市水污染治理模式,是加强水环境治理、提升区域竞争力和可持续发展能力的迫切需要[6]。
义乌市目前是全球最大的小商品集散中心之一,我国唯一的国家级综合改革试点县级单位。然而,义乌市水资源极度缺乏,呈现资源型和水质型缺水并存的特征,人均占有量仅为全国平均水平的19.7%[7]。2013年,浙江省提出了“五水共治”战略,并在义乌市取得显著成效。截至2018年12月,义乌江流域河流水质明显提高。河道水质的改善为重构水生态系统的多样性[8],提升水环境安全指数[9],保障城镇饮用水安全供给[10]奠定了扎实基础。
本研究旨在评估实施“五水共治”措施以来(2014—2018年)义乌江流域地表水的水质变化,以及相关治理措施对义乌江流域水污染负荷削减的影响,核算义乌市污水处理厂提标改造工程和退耕还林还草工程对点源和面源污染负荷的削减作用,总结义乌市“五水共治”的经验,并对下一阶段义乌市水环境污染治理重点提供参考。
全文HTML
-
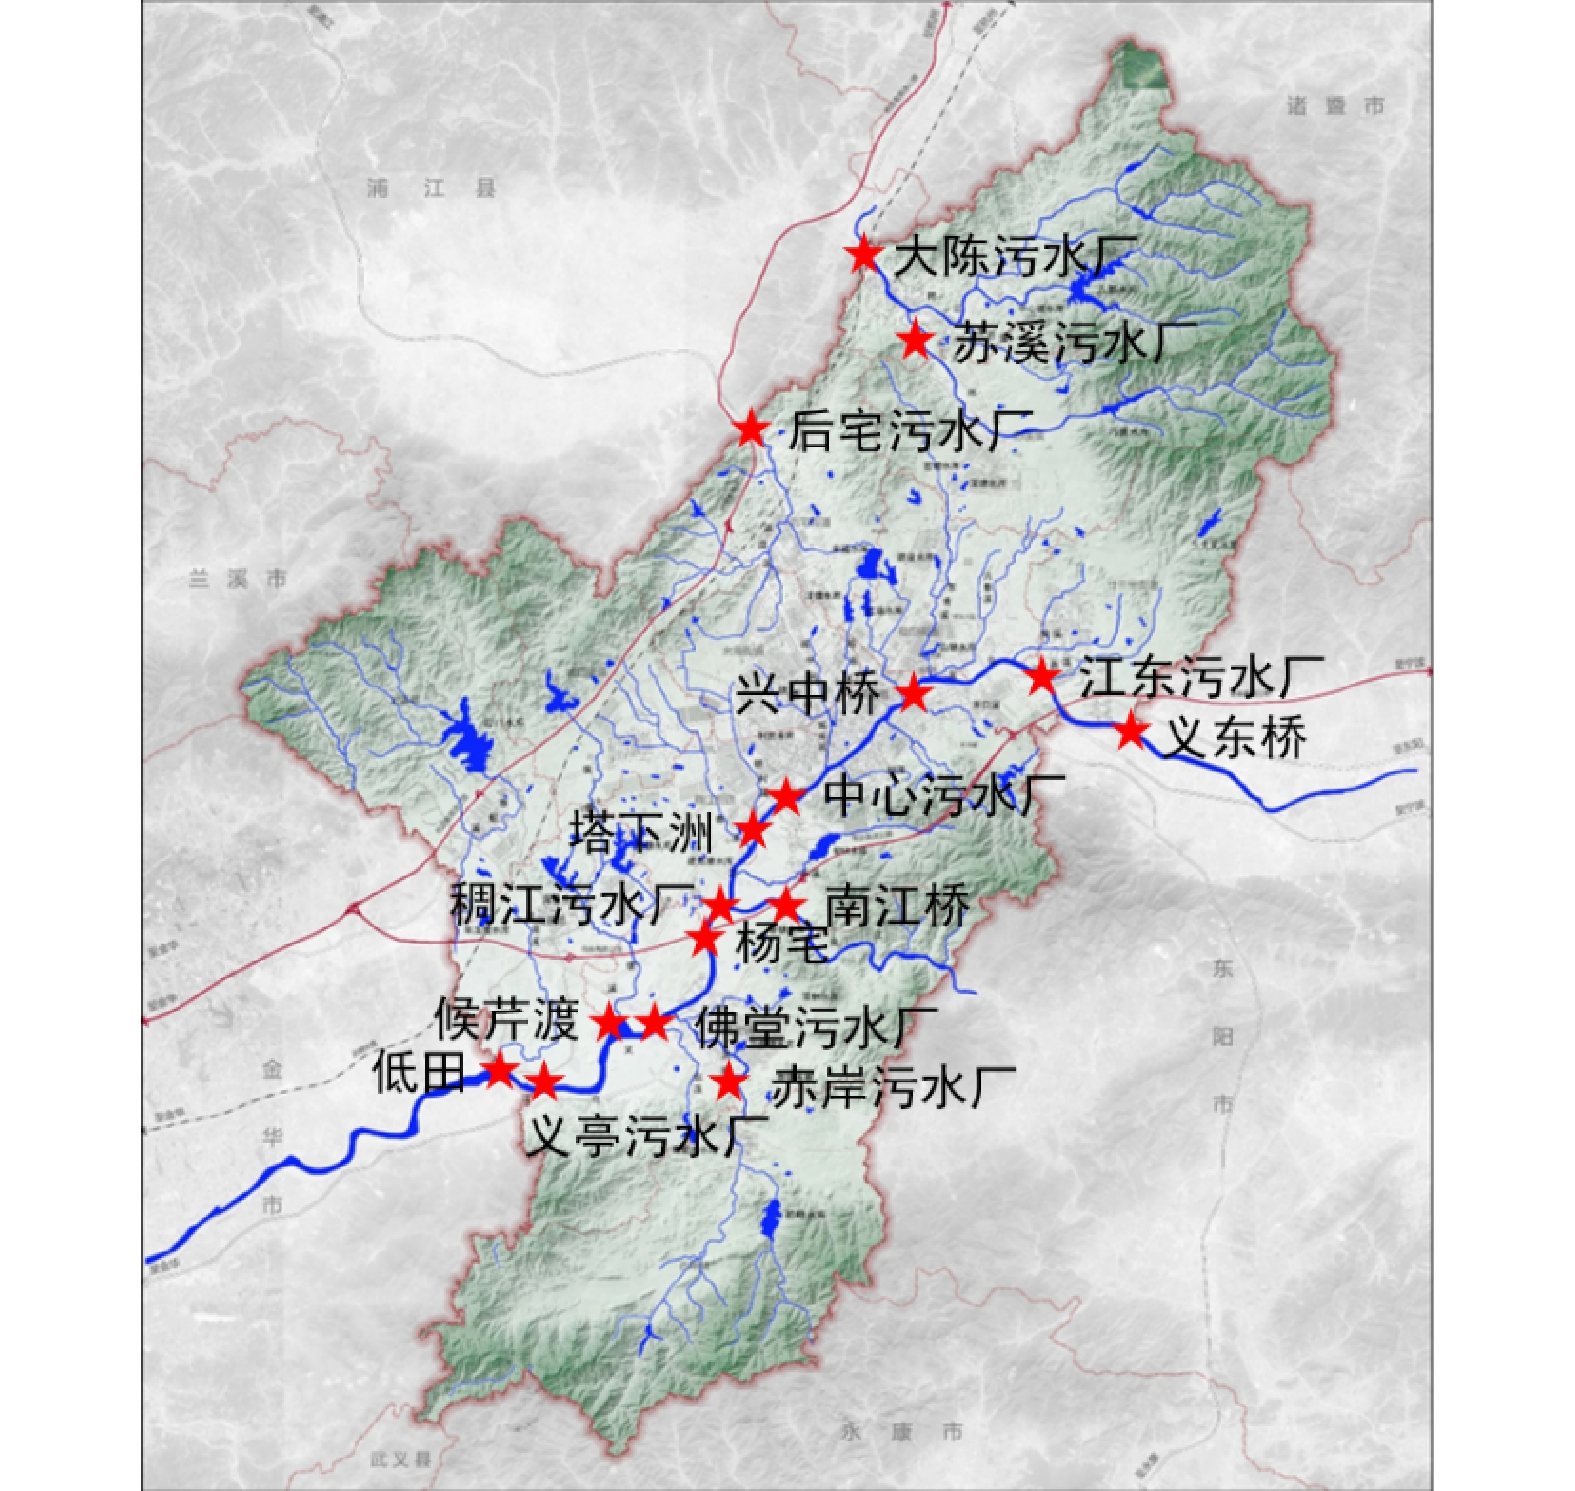
义乌市地处浙江省中部,市境地理范围为东经119°49′~120°17′、北纬29°2′~29°33′。市域南北长58.15 km,东西宽44.41 km,行政区域面积1 105.40 km2。义乌市水系分布如图1所示,义乌江干流分布着6处县控以上监测断面、17条支流的入河口和6座污水处理厂的尾水排放口,位置标注于图1。
-
监测断面水质数据来源于义乌市生态环境局提供的《2014—2018年义乌市县控以上监测断面水质情况》。义乌江支流水质、流量数据来源于义乌市“五水共治”办公室提供的《“五水共治”河道水质问题清单及整改措施》。污水处理厂出水、流量数据来源于义乌市污水处理厂提供的《2016年1月—2019年3月义乌市城镇污水处理运营部水质水量表》。现场调研数据为本课题组于2019年5月—2020年1月对义乌江干、支流,岩口水库沉积物实测得到。
-
水体样品采集参考《水质采样技术指导》(HJ 494-2009)进行。每个采样点分别采500 mL水样,装入干净的聚乙烯样品瓶,密封后置于4 ℃保温箱中保存,并运送回实验室尽快进行水质分析。其中,COD的监测参考《水质 化学需氧量的测定 快速消解分光光度法》(HJ/T 399-2007);氨氮监测参考《水质 氨氮的测定 纳氏试剂分光光度法》(HJ 535-2009);总磷监测参考《水质 总磷的测定 钼酸铵分光光度法》(GB 11893-1989);总氮监测参考《水质 总氮的测定 碱性过硫酸钾消解紫外分光光度法》(HJ 636-2012)。
-
水环境污染负荷的计算方法分为两类:其一为调查法,即以实地调研和统计数据为基础,根据不同污染来源进行分类计算,该方法的特点是污染源分类细化相对明确,但污染物总量统计不全;其二为反推法,即以河网容积和水质监测点实际监测数据为基础,并基于水量平衡计算得到水环境污染负荷。本研究基于零维模型,采用反推法对水环境污染负荷进行核算(见式(1))[11]。
式中:
$ {M}_{i,m} $ 为m河流(或污水处理厂尾水)中i类污染物的年负荷量,t·a−1;$ {c}_{i} $ 为m河流(或污水处理厂尾水)中i类污染物的参考浓度,mg·L−1;$ {\theta }_{m} $ 为m河流(或污水处理厂排水)的日流量,103 t·d−1。式中:
$ {M}_{i,j} $ 为第j类土地在降雨过程中产生的i类污染物的年负荷量,t·a−1;$ R $ 为年降雨量,mm;$ {S}_{j} $ 为j类土地的面积,km2;$ {\text{ω}}_{j} $ 为j类土地利用类型的径流系数,无量纲;$ {c}_{i,j} $ 为j类土地中的i类污染物的参考浓度,mg·L−1。
1.1. 区域概况
1.2. 数据来源及现场调研
1.3. 污染物分析方法
1.4. 水环境污染负荷的计算方法
-
如图2所示,2014—2018年义乌江6处县控及以上断面的COD均稳定低于在地表水Ⅲ类标准值(30 mg·L−1),在研究时段内波动降低,且在2018年略有反弹。丰水期(每年9月至次年3月)的COD低于枯水期(每年4—8月),这是由于丰水期较多的降雨对污染物起到了稀释作用。义乌江干流的氨氮从2014年平均值1.67 mg·L−1降至2018年平均值0.71 mg·L−1。除枯水期的义东桥断面外,2018年义乌江干流氨氮均满足地表水Ⅲ类要求。同样地,义乌江干流各断面的总磷总体呈下降趋势,全部满足地表水Ⅲ类标准要求。2018年枯水期(平均值0.148 mg·L−1)和丰水期(平均值0.147 mg·L−1)的总磷差距不大。这是由于水体中的磷在溶解态和颗粒态之间互相转化[12],来自污染源过剩的磷被沉积在沉积物中。当水体中总磷降低时,沉积物中被吸附的磷又以溶解态被释放到水体中,从而保持水体总磷相对稳定[13]。
特别地,义乌江干流的总氮年际变化呈先降低(平均值从3.39 mg·L−1降至2.27 mg·L−1)再提高(升至4.84 mg·L−1),最后回落(降至4.32 mg·L−1)的态势,枯水期波动幅度大于丰水期。造成这种现象的原因有:虽然水体中的氨氮在逐年削减,但氨氮经过硝化作用转化为硝态氮或亚硝态氮继续存在于水体中,致使总氮不降反升;尤其是在冬春季枯水期,降雨减少导致污水处理厂尾水占河道来水比例提高;另外,在气温较低时,污水处理厂的反硝化能力减弱[14],更多氮元素以硝氮或亚硝氮的形态存在于水体中,造成总氮居高不下。随着污水处理厂处理能力的提升,5.4×105 t·d−1尾水的排放加剧了氮元素赋存状态不同步带来的水体污染[15]。因此,脱除过剩的营养物质仍是改善城市水域生态系统服务效益的重要内容[16]。
2018年义乌江干流年均COD较2014年降低了10.2%,氨氮降低了55.7%,总磷降低了12.4%。COD和总磷的月均值可稳定达到地表水Ⅲ类标准,氨氮虽然有个别月份未达标,但年均值也低于地表水Ⅲ类标准。以上变化说明“五水共治”措施有效地改善了义乌江流域的地表水水质。
-
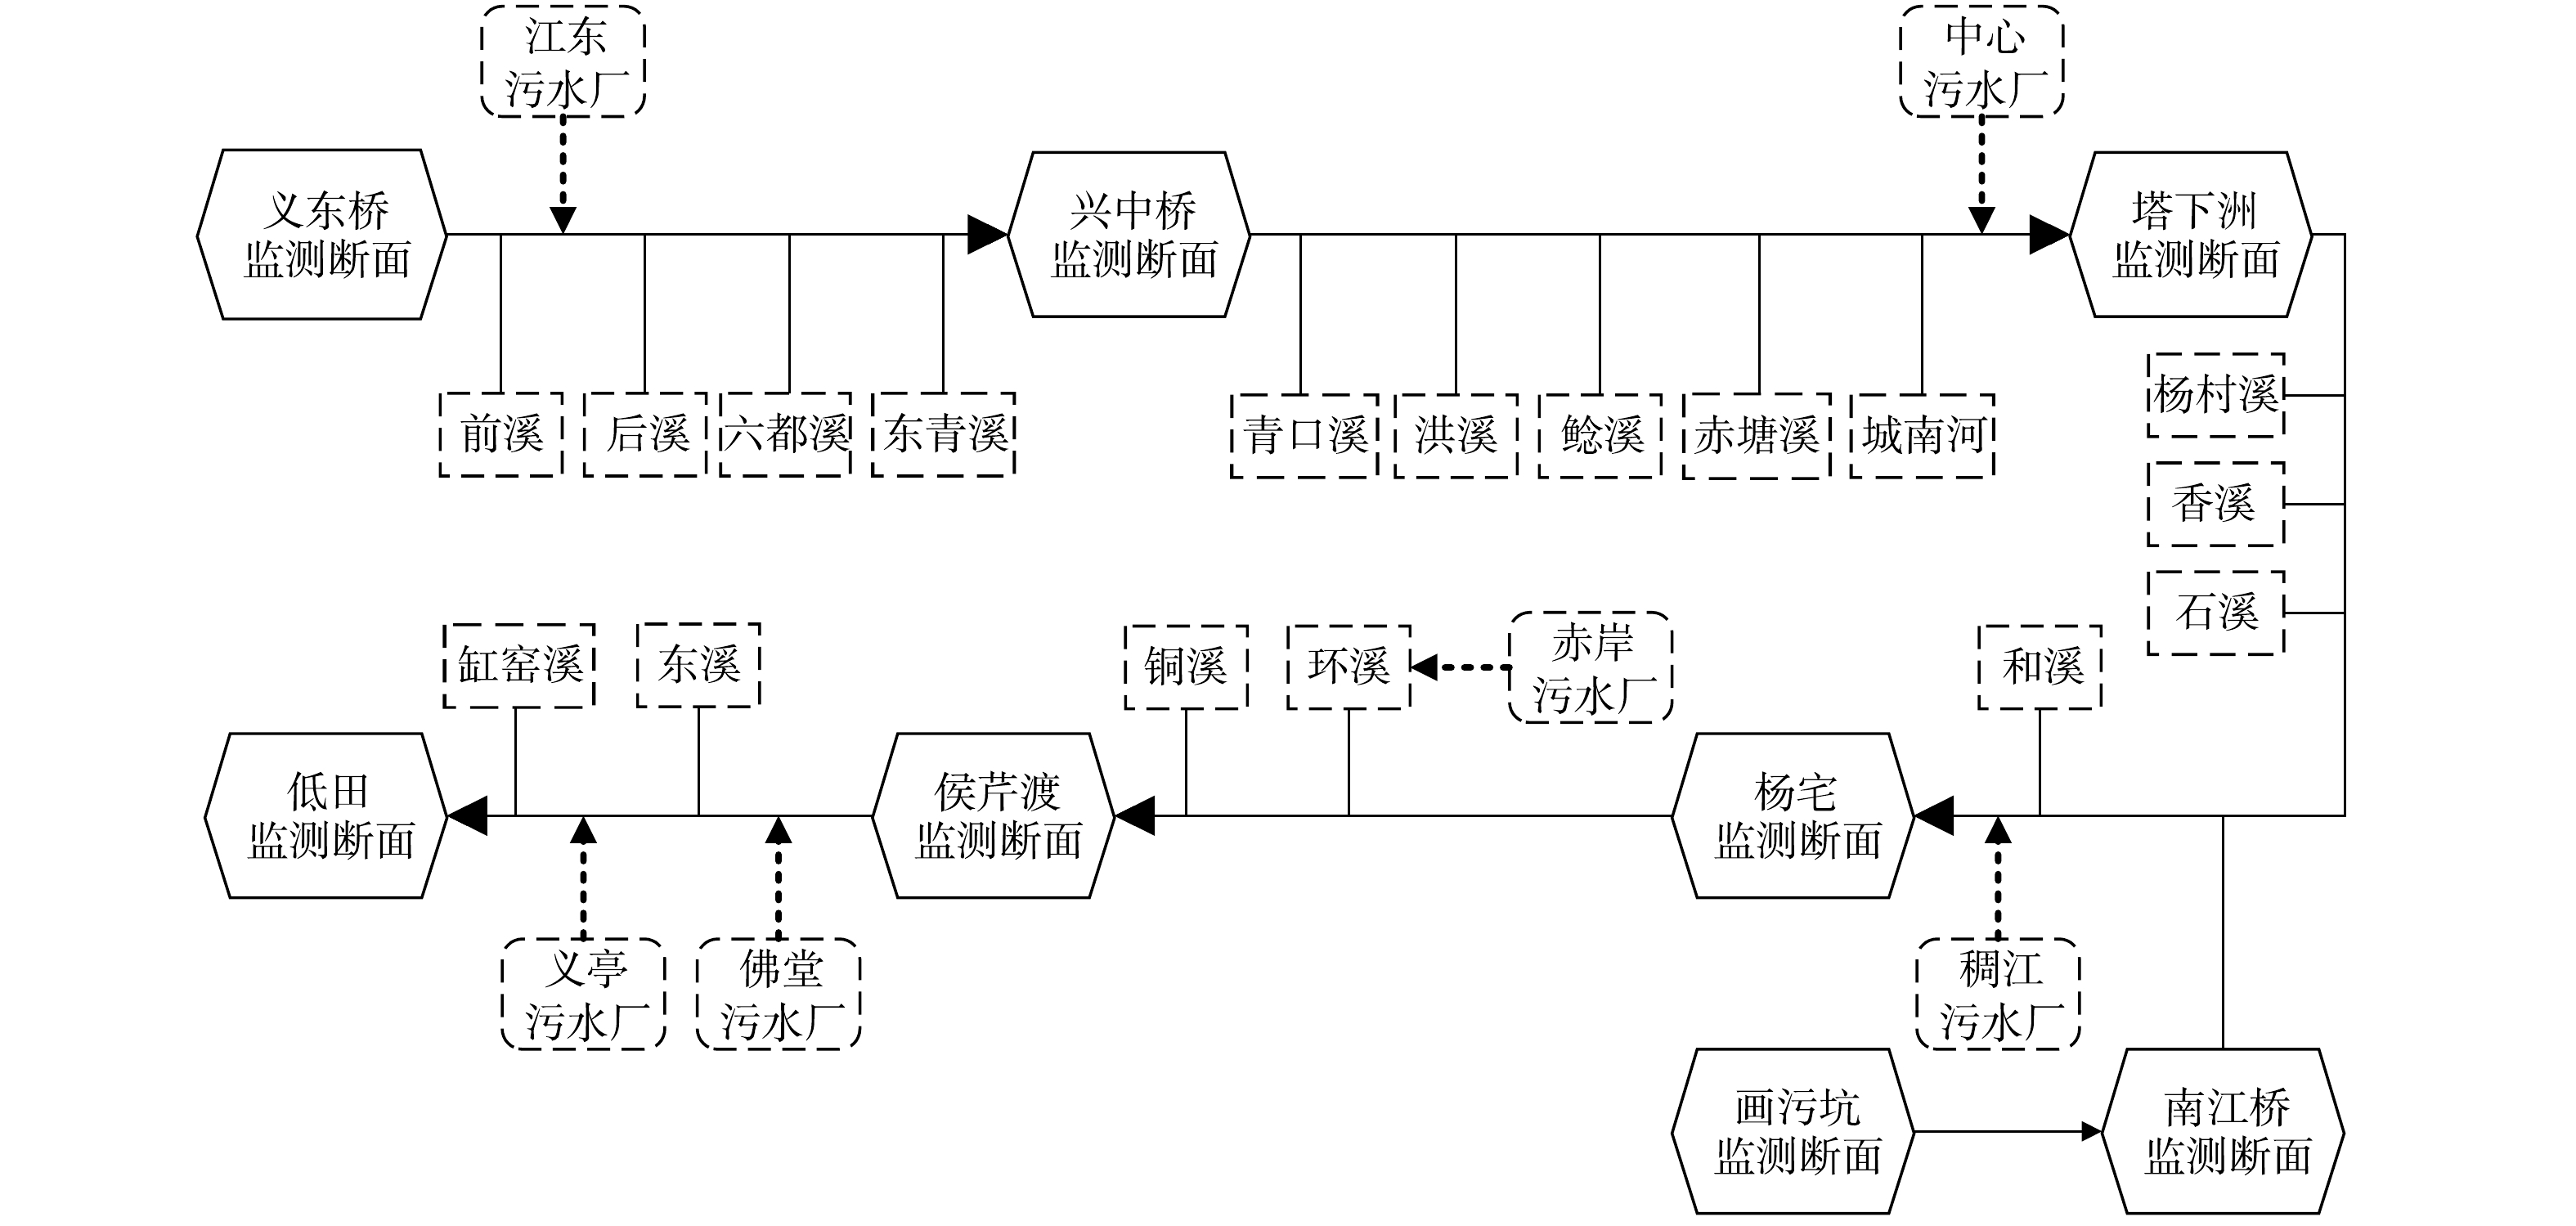
义乌江是东阳江义乌段的特称。义乌江自市域东北流向市域西南,贯通义乌市,其江水由通过义东桥断面的东阳江(东阳段)和通过画污坑断面的南江来水构成(见图3)。上游东阳江(东阳段)的污染源紧邻义东桥断面,导致东阳江(东阳段)的来水污染负荷影响了义乌江干流水质。与此同时,整个义乌江流域分布着包括南江在内的17条水量较大的支流和6座污水处理厂,这些是非降雨情境下义乌江干流的补水来源,决定着义乌江干流水质的变化。本研究基于2016年2月9日—4月20日义乌市生态环境局、“五水共治”办公室等机构对义乌江水质、水量的调研,核算出各干流断面、支流入江口和污水处理厂排水的氨氮和总磷负荷。
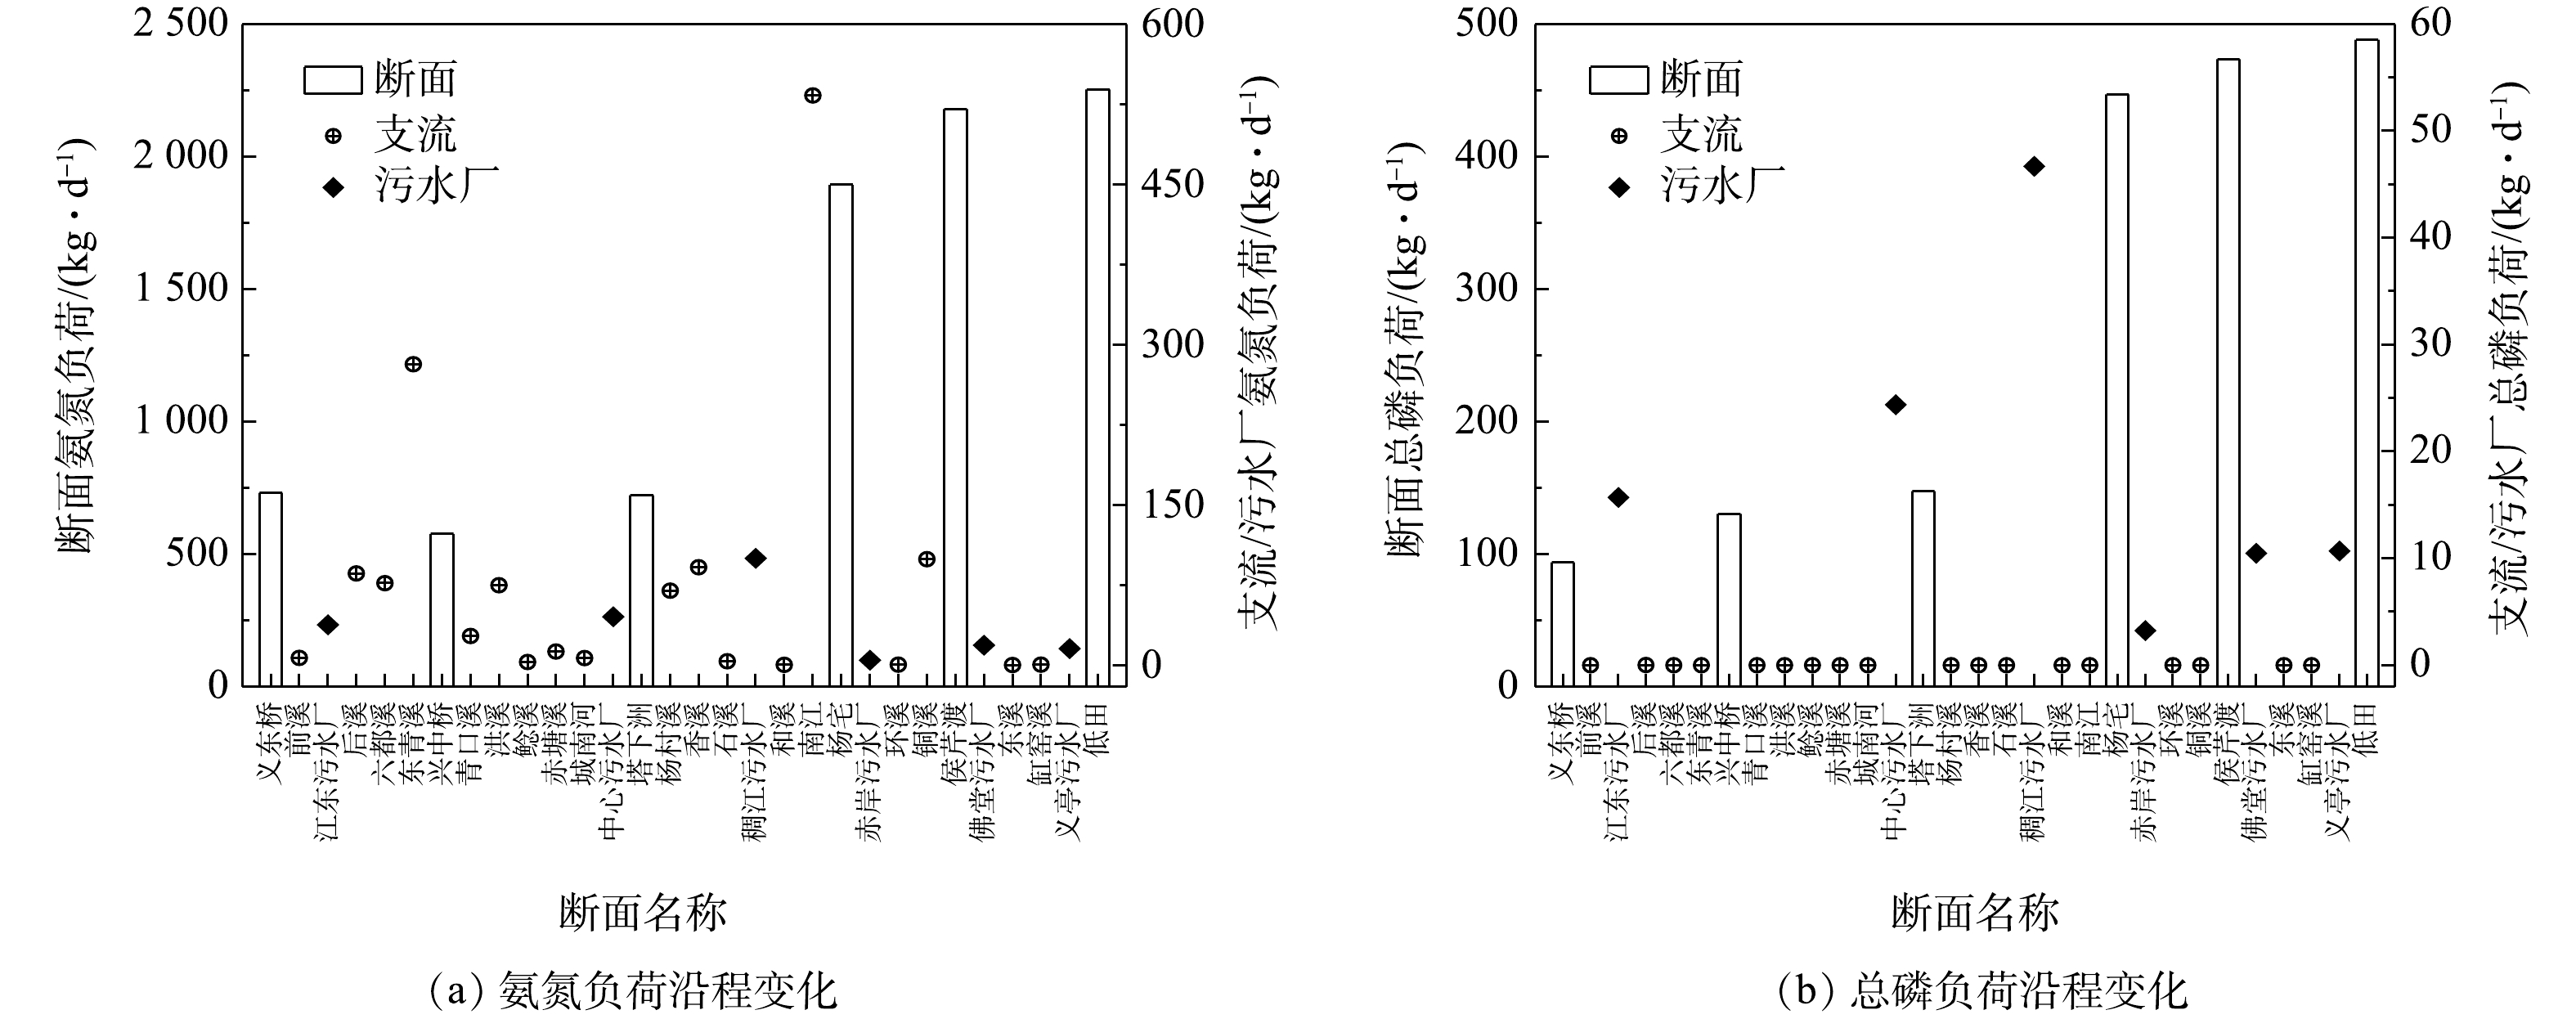
图4显示了“五水共治”措施实施以来,义乌江干、支流和污水处理厂造成的污染物负荷变化。图4表明,氨氮的负荷沿程呈波动递增趋势,由入境时的748 kg·d−1提高至出境时的2 238 kg·d−1,提高了近2倍。特别地,氨氮负荷在杨宅断面明显提升(增幅为入境负荷的1.4倍)。义乌市水文站的降雨记录了调研期内存在多场降雨。一方面,由降雨冲刷地表产生的面源污染物直接汇入南江;另一方面,南江桥断面以上汇水区域主要为农村地区,强降雨天气下,部分农村区域的雨污合流区块中的污水也被雨水带入南江。南江对义乌江的污染贡献造成了杨宅断面氨氮负荷的迅速提升。
图4还表明,总磷负荷沿程呈不断上升的趋势,由入境时的95 kg·d−1提高至出境时的478 kg·d−1,增加了4倍有余。总磷负荷同样在杨宅断面发生明显升高(增幅为入境负荷的3.6倍),但与氨氮负荷的变化原因不同,总磷负荷的升高主要由稠江污水处理厂的尾水带来的。稠江污水处理厂是义乌市最大的城市污水处理厂,其服务范围包括主城区大部分、经济开发区地块、城西街道工业小区、北苑部分地块、江东部分地块等,服务面积133 km2,服务人口70余万人,日设计处理规模(2018年)为1.5×10⁵ t,每天大量的尾水排放污染造成了杨宅断面总磷负荷的快速增加。
义乌江干流水体中氮磷污染物的来源不同。氨氮负荷主要由支流贡献,其中贡献占比前3位的分别为南江、东青溪和铜溪;污水处理厂的贡献仅与一些小型支流相近。总磷负荷主要由污水处理厂的尾水贡献[17],贡献占比前3位的分别为稠江污水处理厂、中心污水处理厂和江东污水处理厂;支流贡献的总磷负荷可以忽略不计。由此可见,对支流污染治理或污水处理厂提标改造的管控选择可以河道水体中氮磷污染负荷组成的变化作为依据。
-
2014年5月,浙江省组建成立了浙江省“五水共治”技术服务团,义乌市“五水共治”办公室也随之成立。经过2年的初步探索,中共义乌市委和义乌市政府于2016年正式制定“1+9+14+6”水环境综合治理模式:1)“1”是指市委市领导编制的《义乌市“五水共治”“十三五”规划》,该规划对义乌市两年的治水经验进行了初步总结并明确了下一步治水的步骤和要点;2)“9”是指9项源头治理行动,该行动全面启动了城镇、工业功能区、农村、集贸市场、垃圾分类等9项工作,综合治理城、乡污染源;3)“14”指的创建工作主体,市委领导全面抓好辖区内的整治任务的14个镇(街道)落实;4)“6”指的是关于全力给予财力、机构、人员、资金、运行体制、机制等保障措施的政策。其中针对点源和面源的重点治理措施包括污水处理厂的提标改造(义乌市污水处理厂的提标改造情况详见表1)及退耕还林还草等。
-
2014年与2018年污水处理厂排放尾水中污染物含量之差即为点源污染负荷的削减量。根据义乌市污水处理厂提标改造的工程记录,2014年义乌市污水处理厂的处理能力为43.5×10⁴ t·d−1。本研究搜集到最早的污水处理厂出水数据记录为2016年。因此,根据对污水处理厂的走访及资料回溯来确定2014年污水处理厂尾水的水量和水质,以表2中所列参数作为2014年污水处理厂尾水污染物浓度参考值进行估算。2014年污水处理厂接近满负荷运行状态,年实际处理量由其处理能力代替。2018年义乌市污水处理厂的处理能力为54×104 t·d−1,全年实际处理量根据污水处理厂的水质水量报表来记录核算。2018年污水处理厂尾水水质以典型枯水期(12月)和丰水期(6月)的水质平均值估算,具体尾水水质如表2所示。
2014年和2018年的点源污染负荷核算结果如表3所示。在不考虑管网收集率的前提下,污水处理厂提标改造工程明显降低了点源排放的污染负荷。2018年点源的COD、氨氮、总磷和总氮的污染负荷分别较2014年削减了1 601.0、95.1、26.3和272.5 t·a−1,削减率分别为33.6%、59.9%、41.5%和14.3%。
由于不同处理工艺污水处理厂的污染物排放浓度处于同一水平,污水处理厂的尾水污染负荷贡献主要取决于处理规模。2018年污水处理厂尾水中COD负荷的主要贡献来自稠江污水处理厂(874.1 t·a−1)、义亭污水处理厂(677.8 t·a−1)和江东污水处理厂(487.7 t·a−1)。氨氮和总氮负荷的主要贡献来自于稠江污水处理厂(分别为27.56和524.53 t·a−1)、中心污水处理厂(9.18和247.20 t·a−1)和江东污水处理厂(7.65和215.44 t·a−1)。总磷负荷的主要贡献来自于稠江污水处理厂(12.59 t·a−1)、江东污水处理厂(6.47 t·a−1)和义亭污水处理厂(6.20 t·a−1)。特别需要指出的是,由稠江污水处理厂的贡献的氨氮负荷明显高于其他污水处理厂,该现象在气温较低的冬春季节(枯水期)尤为明显,说明该污水处理厂采用的“倒置A/A/O二级生物处理+纤维转盘过滤+消毒”工艺在寒冷季节效益较低,需要进一步提标改造。
-
城市化对耕地面积和土壤表面特征有重要影响[18],降雨对地表的冲刷会带来义乌江流域水体面源污染。本研究抓取义乌市在2014年4月和2018年4月的土地利用类型影像,利用ENVI软件对各类型土地进行遥感影像分类,并运用斑块矢量图进行面积统计,数据反映了水域、林地和草地、建设用地、农田和果园及裸地和其他5种土地利用类型的变化,结果如表4所示。
2018年,义乌市的建设用地面积较2014年减少了20.1 km2,林地和草地的面积增加了9.8 km2,建设用地面积的降幅为7.3%,林地和草地面积的增幅为1.9%。一方面,义乌市以物流集散为主导的产业结构不断发展,导致人口加速向城镇集中;另一方面,义乌市部分保护区退耕还林还草和湿地修复等工程使原有的建设用地退还成草地或林地,故建设用地总面积呈下降趋势,而林地和草地的面积呈上升趋势。农田和果园面积增加了9.7 km2,而水域面积减少了3.0 km2,部分偏远地区的人口借“下山奔小康”运动向村镇转移,带动了水域附近围湖造田及原有裸地农业种植的活动增多。其中,上溪镇的岩口水库库区的水域侵占问题最为严重。
根据以上土地利用类型的变化核算面源污染,各土地利用类型的径流系数参考经验值确定。由于面源污染负荷与土地利用类型的径流系数成正比,复杂的土地利用类型转化造成了面源污染负荷在一些区域有所增加,但同时在其他区域又有所减少。义乌市土地利用类型的转换将在未来很长一段时间继续影响面源污染负荷的变化。
表5为2014—2018年面源污染负荷的变化情况。“五水共治”措施实施前后,由面源造成的COD、氨氮、总磷和总氮污染负荷分别减少了1 998.5、148.0、367.1和33.7 t·a−1,占2014年总面源污染负荷的12.23%。需特别说明的是,本研究中面源污染负荷是降水量和由土地利用类型决定的径流系数的一次函数,因此,各类污染物的削减率为同一值。另外,降水情况对面源污染负荷的计算具有重要影响,2018年的降水量比2014年减少了190.7 mm,因此,由降水量变化引起的面源污染负荷变化可能大于由土地利用类型改变所造成的污染负荷削减量。按土地利用类型分类,2018年对面源COD污染负荷贡献最大的是建设用地(占比52.6%),而农田造成的面源污染对氨氮、总磷和总氮污染负荷的贡献最大(分别占55.3%、48.7%和44.6%)。
-
1)针对点源污染的治理建议。研究时段内,义乌市9座污水处理厂的高标准出水使点源污染的大幅削减得以实现。然而,高标准出水水质是以增加能耗和投入药剂实现的。据估计,为实现义乌市“金华标准”的出水要求,每吨水需要增加0.2~0.3 元的投入。而义乌市拟设立的“新义乌标准”已接近地表水Ⅲ类标准,该标准更加严苛,也必将带来运行和处理成本上涨。因此,应综合评估工程建设的效益与效率,根据当地情况,审慎制定污水处理厂的出水水质标准[19]。作为替代性选择,可对污水处理厂尾水采取分类处理措施,对不进入饮用水系统的污水处理厂尾水采取成本低廉的融合植物、微生物及功能材料为一体的生态处理模式,以提高城市水土介质的纳污能力,从而减少污水处理厂对能耗和药剂的使用[20]。
2)针对面源污染的治理建议。2014—2018年间义乌市的城市化进程不断加速,以工业品生产、物流集散为核心的产业结构将持续吸纳农村人口向城镇转移。城市建成区的不断扩张和建设用地的继续增加,会不断加剧面源污染。另外,义乌市的水污染控制工作长期以地下管网修建、雨污合流整治等改造地下“灰色区域”的工程措施为核心,忽略了城市河道生态系统的修复。下一步,义乌市应加强流域生态修复工作,着重解决河岸植被覆盖率低、植被结构单一、景观破碎化严重、生态空间结构和水生态功能受损等问题[21]。充分利用义乌市的塘、潭、库、溪、河、湖等多种天然水体,因地制宜地选取义乌市流域内的工业区、居民区、公共空间等开展工程布局,结合对污水处理厂的尾水生态处理模式,构建以健康水生态为主线的流域蓝绿空间,实现水质净化与景观提升的融合。
2.1. 2014—2018年义乌江流域河流水质变化及氮磷污染的来源
2.1.1. 2014—2018义乌江流域河流水质变化
2.1.2. 义乌江流域河流氨氮和总磷的污染来源
2.2. “五水共治”措施对义乌江流域水环境污染负荷削减的影响
2.2.1. 义乌市“五水共治”水环境综合治理主要措施
2.2.2. 点源污染负荷变化
2.2.3. 面源污染负荷变化
2.3. 基于污染负荷变化的义乌市流域水环境综合治理建议
-
1) 2018年义乌江流域COD和总磷指标均可稳定达到地表水Ⅲ类标准,氨氮年平均值也低于地表水Ⅲ类标准限值。COD、氨氮和总氮均在丰水期较低,这是由于降雨的稀释作用所致;而由于沉积物同时作为磷的“源”和“汇”,总磷在丰、枯水期没有明显差别。特别的,2014—2018年间义乌江干流的氨氮迅速降低,而总氮先降低后升高,最后回落,这是由于污水处理厂的反硝化能力弱,由氨氮转化而来的硝氮或亚硝氮无法彻底脱除,造成了氨氮和总氮变化趋势的不同。这在由寒冷导致反硝化细菌活动衰弱的枯水期表现得尤为明显。
2) 2014—2018年,包括污水管网建设和污水处理厂提标改造在内的点源污染控制措施对COD、氨氮、总磷和总氮污染负荷的削减量分别为1 601.0、95.1、26.3和272.5 t·a−1。稠江污水处理厂由于其较高的氨氮负荷贡献需要在未来引起重点关注。包括退耕还林还草工程和湿地修复工程在内的面源污染控制措施和城市化进程共同导致了义乌市土地利用类型的变化,这种复杂、双向变化下,COD、氨氮、总磷和总氮的污染负荷的削减量分别为1 998.5、148.0、367.1和33.7 t·a−1。COD、氨氮和总磷的削减主要由面源污染控制措施贡献,总氮的削减主要由点源污染控制措施贡献。
3)为推动义乌市水环境污染治理工作,针对点源污染,建议审慎制定适宜当地情况的污水处理厂的出水水质要求,选择替代性低成本的生态处理模式;针对面源污染,建议加强流域生态恢复工作,充分利用塘、潭、库、溪、河、湖等多种天然水体,构建以健康水生态为主线的流域蓝绿空间。


 下载:
下载:


