-
2021年中国生态环境状况公报显示,339个地级及以上城市平均超标天数 (空气质量指数大于100的天数为超标天数) 比例为12.5%,以PM2.5和PM10为首要污染物的超标天数分别占总超标天数的39.7%和25.2%。大气颗粒物已经成为影响我国城市空气质量的重要污染物[1-4]。道路扬尘对大气颗粒物的贡献可达到20%[5-7],已成为影响人群健康、环境污染、大气能见度的重要因素[8-10]。
碳组分是道路扬尘的重要组成成分,因其来源复杂日益受到广泛关注。目前,针对道路扬尘碳组分的研究主要集中于时空分布和来源解析[11-17]。马妍等[12]基于样方法研究了天津市春季道路扬尘中碳组分的特征,并进行了来源解析,发现天津市快速路中各碳组分质量分数均较高,次干道中各碳组分质量分数均较低。胡月琪等[13]研究了北京市典型道路扬尘化学组分的特征及年际变化,发现与2004年相比,2013年北京市道路扬尘PM2.5中除SO42-含量略上升2.0%外,其余主要化学组分含量下降显著。沈利娟等[14]研究了西安市城市降尘和土壤尘PM10和PM2.5中的碳组分空间分布特征,发现不同城市站点降尘中碳组分的分布具有一致性,不同土壤尘中碳组分的差异较大。郭森等[16]研究了石家庄夏季道路尘碳组分特征,发现有机碳(organic carbon, OC)容易在PM10中富集,元素碳(elemental carbon, EC)容易在PM2.5中富集。
西宁市作为兰西城市群中心城市,是西部地区重要的交通枢纽以及工业基地。近年来,西宁市总体环境空气质量稳中有升,但是颗粒物依旧是影响西宁市环境空气质量的首要污染物。窦筱艳等[18]研究发现对西宁市PM2.5影响最大的排放源是城市扬尘,贡献率为26.4%。目前,尚未发现道路扬尘对空气颗粒物贡献的相关研究。本研究通过样方吸尘法于2019年5月采集西宁市353个道路扬尘样品,分析道路扬尘PM2.5 和PM10 中碳组分特征及来源,以期分析西宁市不同道路类型各碳组分分布规律和各源类对道路扬尘的影响,为道路扬尘污染防治政策制定提供参考。
-
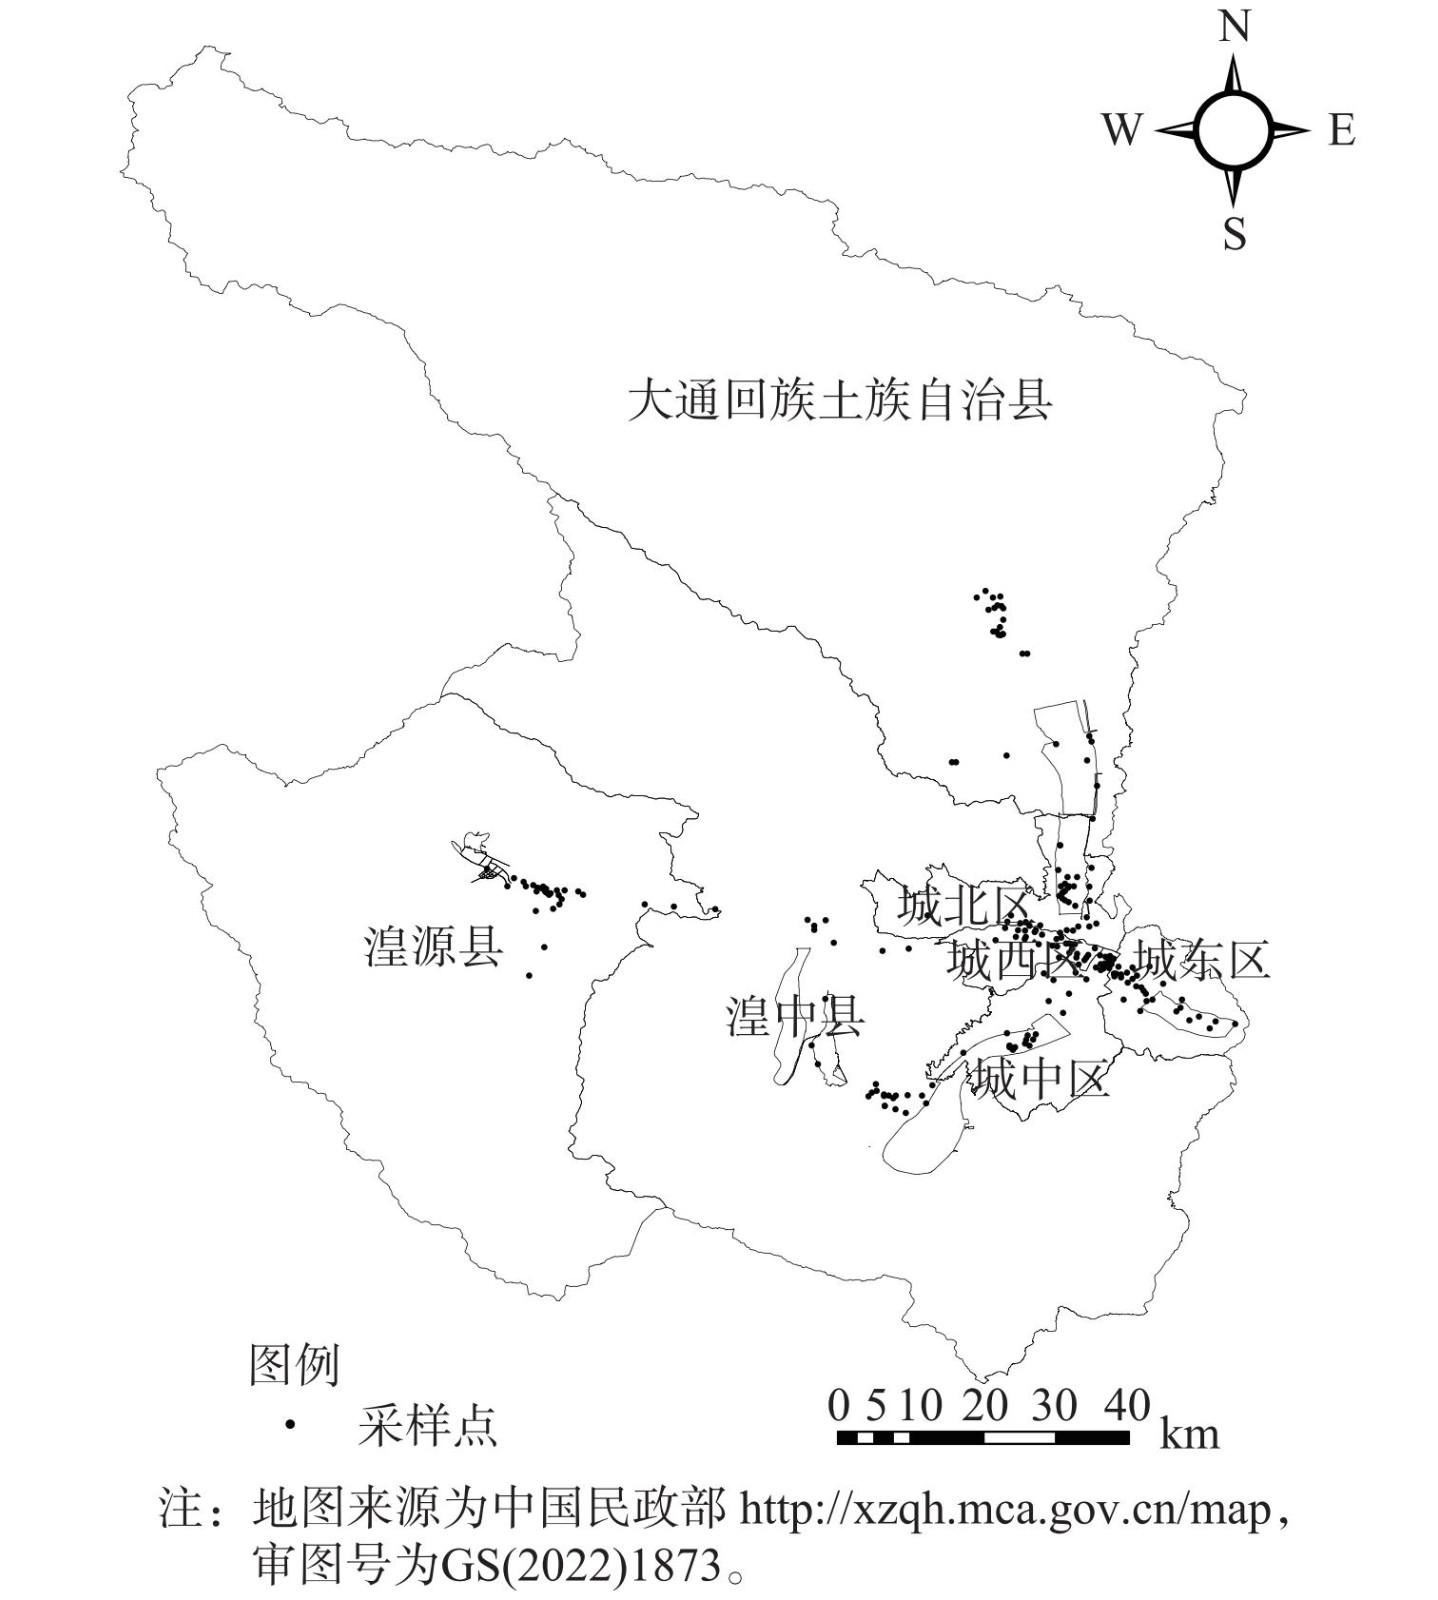
于2019年5月,选取西宁市主干道、次干道、支路、环线、国道、高速路6种道路类型共采集78条铺装道路,采样信息见表1和图1。每条道路采集一侧靠近非机动车道的两条车道,每个车道选取3个子点位。采样点位之间的距离通常大于800 m。采样点位尽量避开人流量密集的地方,每个子点位采样面积约2~4 m2。使用样方吸尘法采集获得了353个道路扬尘样品,具体采样方法参考文献[12]。采样结束后,使用细毛刷将集尘盒内的尘土扫入样品袋中,编号保存后带回实验室进行分析。
-
将采集到的样品去除烟头、杂草和生活垃圾等,在干燥器内平衡3 d。将样品依次放入20目和200目泰勒标准筛进行筛分。将筛分后的同一条道路同一侧样品进行合并,之后送入NK-ZXF再悬浮采样器进行再悬浮以获得西宁市道路扬尘PM2.5和PM10的颗粒物滤膜样品。滤膜在再悬浮前后均置于恒温(20 ℃±1 ℃)恒湿(50%±5%)天平室平衡72 h,用精度为百万分之一(1 µg)的天平(MX5,瑞士 Mettler Toledo)称重。
-
采用DRIModel2001A热光碳分析仪分析碳组分。1) 使用裁膜刀在石英滤膜上裁取0.188 cm2的样品送进样品炉中,当样品炉中通入纯氦气时,分别在120 ℃(OC1)、250 ℃(OC2)、450 ℃(OC3)和550 ℃(OC4)这4个温度段加热升温,同时吸收分解产物和OC进入二氧化锰炉内,石英滤膜上的OC转化生成CO2;2) 再将载气变为有2%氧气的氮气,在550 ℃(EC1)、700 ℃(EC2)和800 ℃(EC3)逐渐加热,最终样品中EC被氧化为CO2。而OC在碳化过程中生成的碳化物为裂解碳(optical pyrolyzed carbon, OPC)。依据IMPROVE协议,OC=OC1+OC2+OC3+OC4+OPC,EC=EC1+EC2+EC3-OPC,TC=OC+EC[19]。
-
采样之前,将空白的石英滤膜放入550 ℃的马弗炉中灼烧3 h以去除杂质以及残留的碳。采样前后均将石英膜放入恒温恒湿的天平室平衡3 d以减小温度和湿度对称重的影响。每一次分析样品碳组分前后,用CH4/CO2标准气体对仪器校正。每周测量仪器实验室空白和系统空白。每10个样品中随机抽取1个样品做平行分析。
-
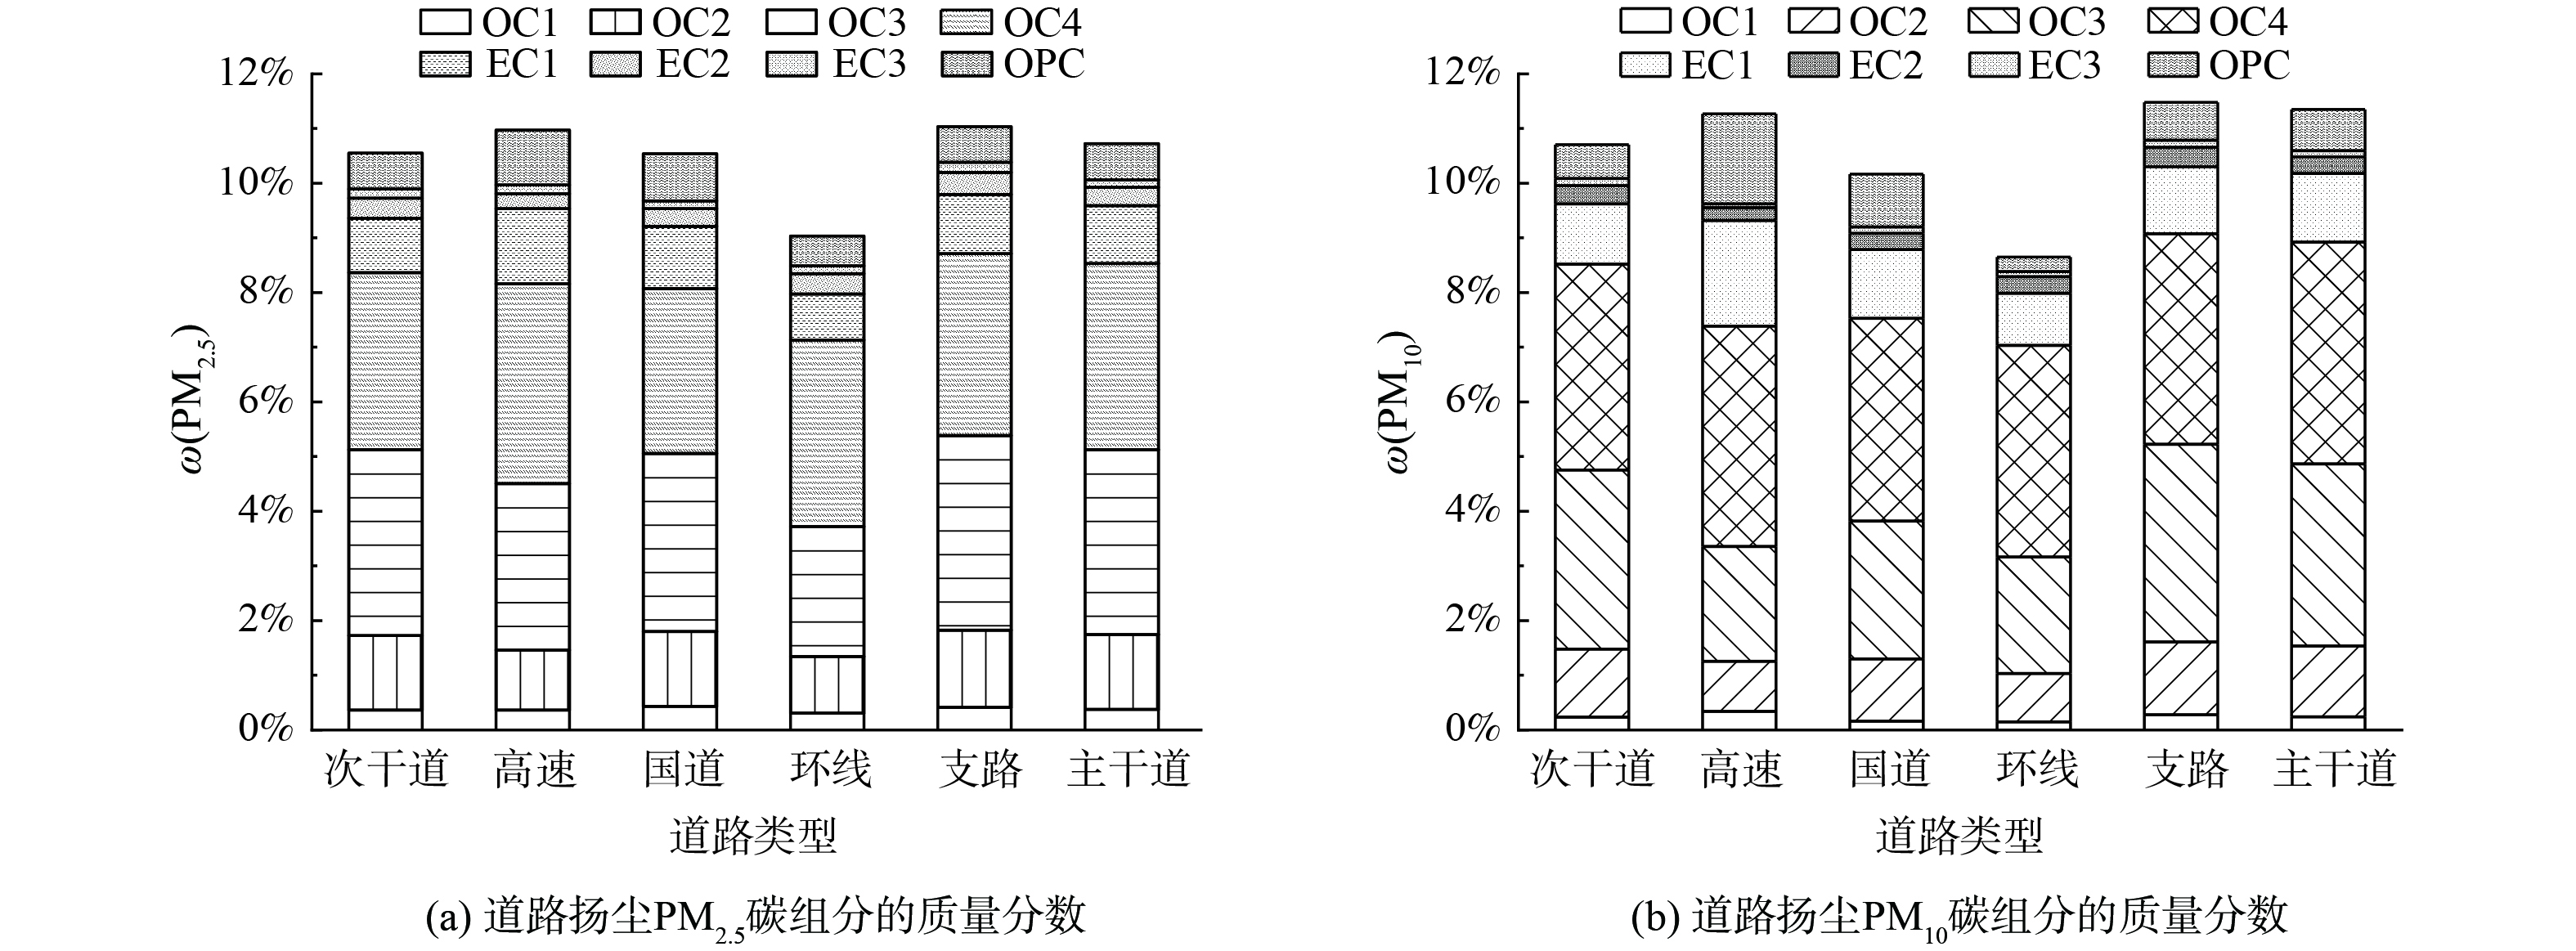
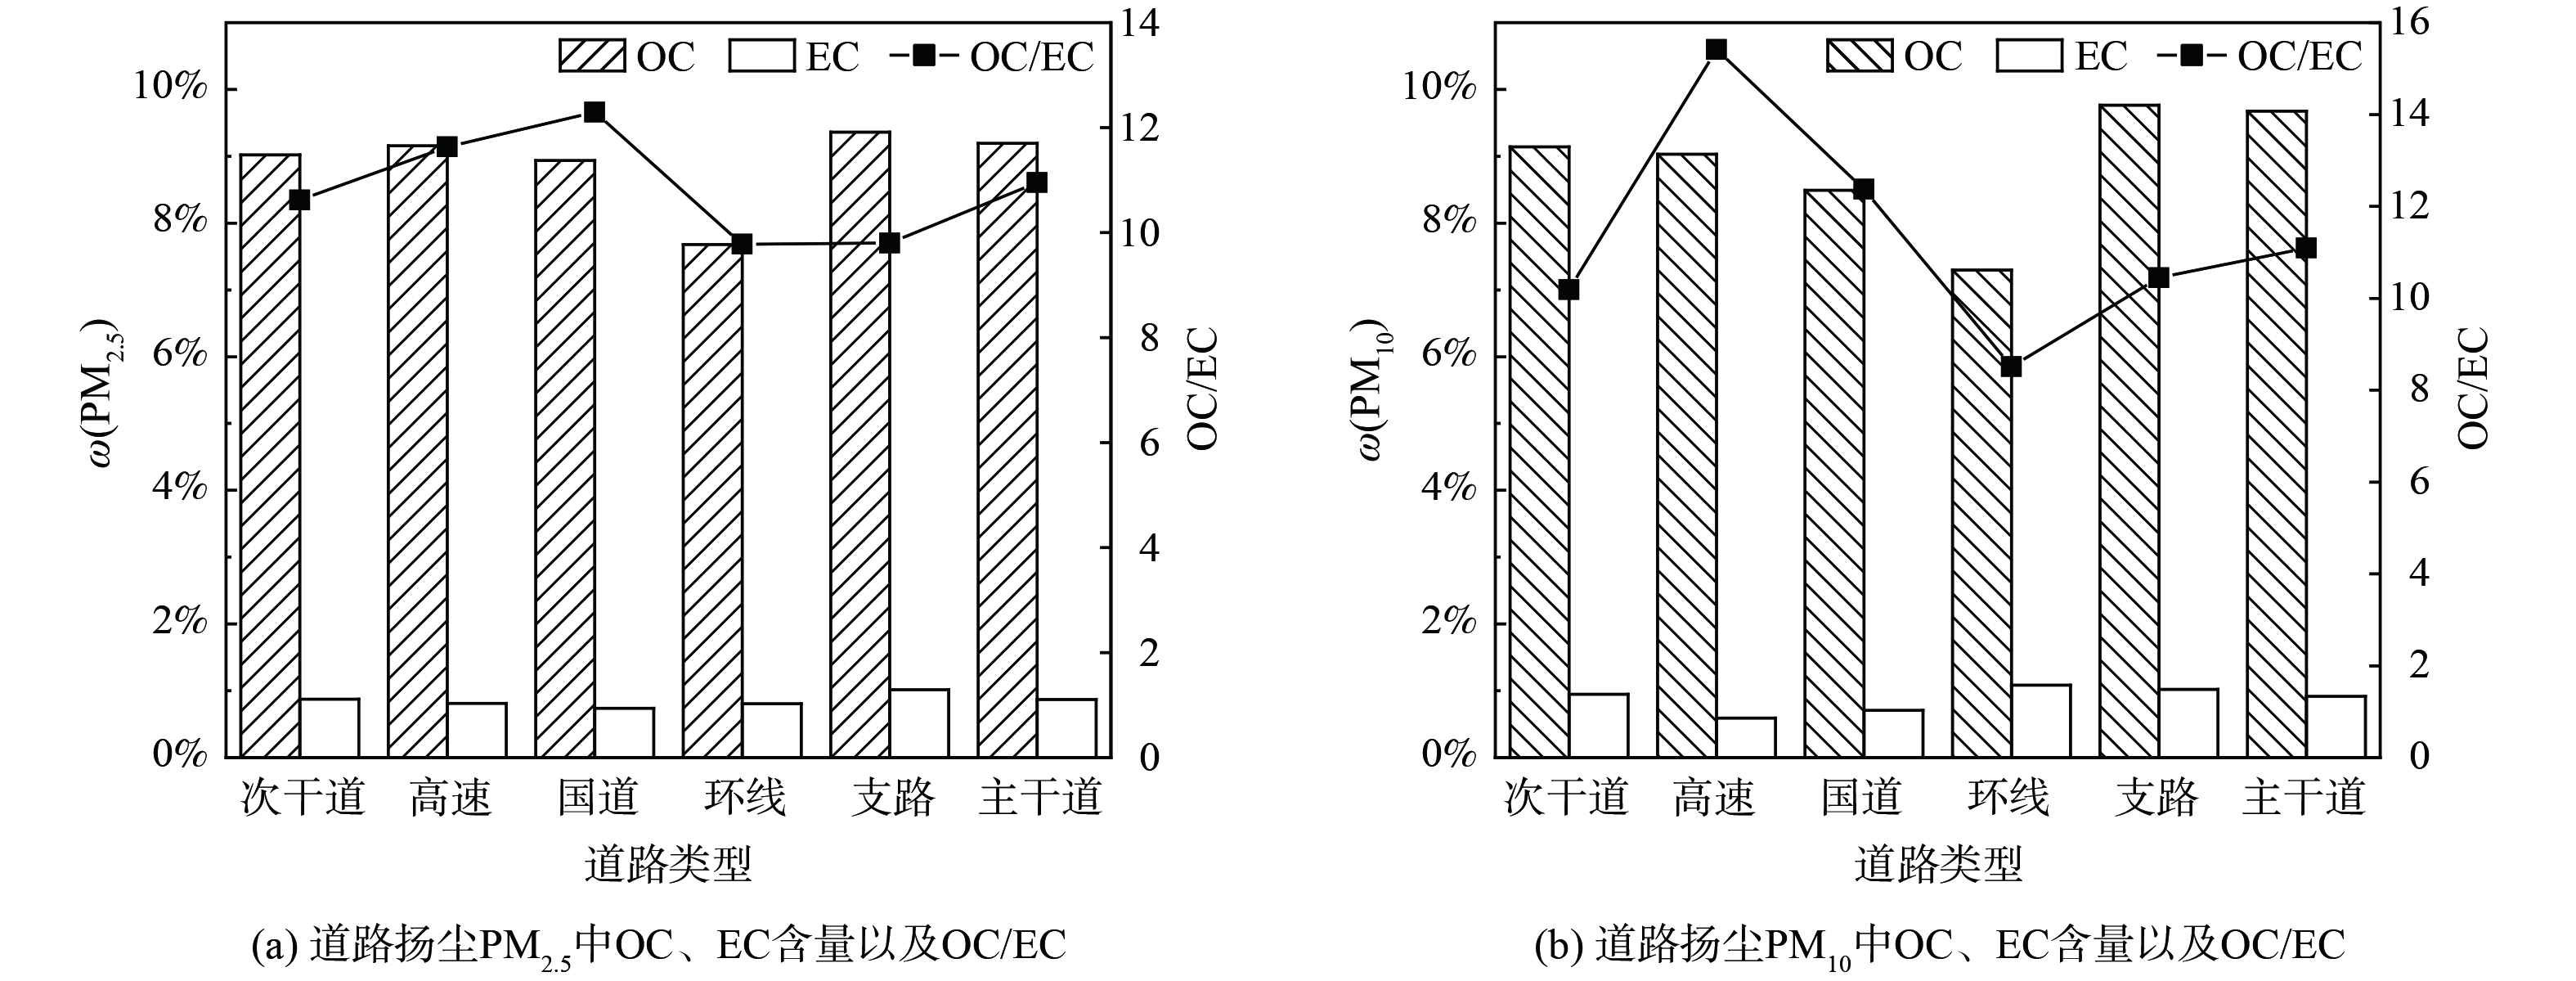
西宁市不同道路类型的碳组分质量分数如图2所示。PM2.5中ω(TC)为8.49%(环线)~10.38%(支路),平均值为 (10.01%±1.26%) ;PM10中ω(TC)为8.38%(环线)~10.78%(支路),平均值为 (10.33%±2.05%) 。不同类型道路的PM2.5中ω(OC)为7.68%(环线)~9.36%(支路),平均值为 (9.12%±1.16%) ;ω(EC)为0.74%(国道)~1.02%(支路),平均值为 (0.90%±0.22%) 。PM10中ω(OC)为7.30%(环线)~9.76%(支路),平均值为 (9.39%±1.93%) ;ω(EC)为0.59%(高速)~1.09%(环线),平均值为 (0.94%±0.29%) 。由此可见,不同道路类型的道路扬尘PM2.5以及PM10中ω(OC)的值均明显高于ω(EC),ω(EC)在不同道路类型中差别不大。PM2.5中OC/TC比值为0.83~0.94,PM10中OC/TC比值为0.81~0.94,这说明TC主要以OC的形式存在。OC与TC显著相关(相关系数r均大于 0.95)证实了这一点。OC在PM2.5中的质量分数基本均小于在 PM10中的质量浓度。这说明OC比EC更容易富集到粒径大的颗粒物上。这与郭森等[16]对石家庄道路扬尘的研究结论一致。
PM2.5中ω(OC2)、ω(OC3)、ω(EC2)和ω(EC3)均为支路最高,分别为1.41%、3.56%、0.40%和0.18%;ω(EC1)和ω(OPC)表现为高速路最高,分别为1.37%和1.00%;PM10中ω(OC2)、ω(OC3)、ω(EC2)和ω(EC3)均为支路最高,分别为1.33%、3.62%、0.35%和0.13%;ω(OC1)、ω(OC4)、ω(EC1)和ω(OPC)表现为高速路最高,分别为0.34%、4.03%、1.93%和1.65%。总体来看,支路的碳组分含量较高,这可能与采样的支路附近存在较多餐厅且其排放的油烟中OC2和OC3含量较高[20],而餐饮油烟就近沉降到道路有关。YU等[21]研究发现道路扬尘中各碳组分含量受刹车、轮胎磨损、燃料不完全燃烧等的影响;于鸣媛等[22]研究发现冷启动时燃料温度较低,燃料汽化不足从而产生不完全燃烧,导致车辆冷启动的OC和EC排放因子均高于热启动;支路路面一般较窄、车速较慢,刹车及停车现象普遍,这也是造成支路碳组分含量高的原因之一。PM2.5和PM10中的EC1均为高速路最高,EC1是机动车尾气中的高含量碳组分[23]。这与高速路车流量大且车速较快致使机动车尾气排放量较大有关。
-
OC/EC可初步用来分析碳组分来源以及污染程度[24]。OC/EC比值大于2表明OC中有二次有机碳(secondary organic carbon, SOC)[25-26];当OC/EC为1~4.2时,主要排放来自汽油车和柴油车尾气;当比值为2.5~10.5时,主要排放为燃煤排放;当比值为8.1~12.7、16.8~40.0时,主要排放来自生物质燃烧;当比值为32.9~81.6时,主要排放来自餐饮油烟。西宁市不同道路类型PM2.5和PM10中的OC和EC含量及OC/EC比值见图3,所有道路扬尘PM2.5与PM10的OC/EC均大于2。其中,PM2.5中OC/EC为5.09~16.61,平均值为10.60;PM10中OC/EC为4.40~17.20,平均值为10.73。这说明西宁市春季道路扬尘PM2.5和PM10 碳组分的来源以燃煤排放和生物质燃烧排放为主,并且存在明显的二次污染。高玉宗等[27]发现西宁市春季生物质排放量较高。西宁市2018 年煤炭消耗量为 563.5万吨,其中民用煤炭消耗量为66.1万吨,占消耗总量的11.7%。民用燃煤燃烧效率低,一般无污染控制措施,颗粒物排放因子较高。
本研究PM2.5中OC/EC平均值(10.60)高于天津市春季道路降尘OC/EC值(6.65~8.91)[17]和鞍山市道路扬尘OC/EC值(3.43~5.0)[11],低于保定市春季道路扬尘OC/EC值(13.68~80.57)[28]。本研究PM10中OC/EC平均值(10.73) 高于天津市春季道路降尘 OC/EC值(6.15~10.76)[17],低于保定市春季道路扬尘OC/EC值(14.11~43.64)[28]。这可能与采样时间、采样方法、环境因素等有关。如本研究采用样方法采集到的道路扬尘样品更容易受到机动车尾气排放的影响,而天津市春季的研究使用降尘缸采集的道路降尘样品与大气 PM2.5和PM10的关系更为紧密。鞍山市是我国重要的钢铁工业基地,需要较多大型柴油车运输原料、燃料和产品,故该地区EC含量较高,为西宁市的2倍以上,而OC含量与西宁市相当。这可能是本研究所得OC/EC比值高于鞍山市道路扬尘OC/EC比值的主要原因。李东等[28]在保定的研究采样时间为3月,此时恰逢保定市冬季采暖刚结束,采暖产生的OC易累积在道路扬尘中;同时冬季逆温和雾霾天气多发,扩散条件较差,更容易使OC累积在扬尘中,如果清扫力度不够就更会导致扬尘中的OC/EC偏高;而实地调研发现存在部分非机动车道日常清理不及时的情况,因此推测是此原因导致保定市OC/EC值高于西宁市道路扬尘OC/EC值。
-
常用的SOC计算方法主要有EC示踪法(包括排放源清单OC/EC法、最小OC/EC比值法)、化学模型迁移法、非反应模型法等。TURPIN等[29]最先提出将EC作为示踪物来追踪一次燃烧源的一次有机碳,进而推算SOC的浓度,见式 (1) 。
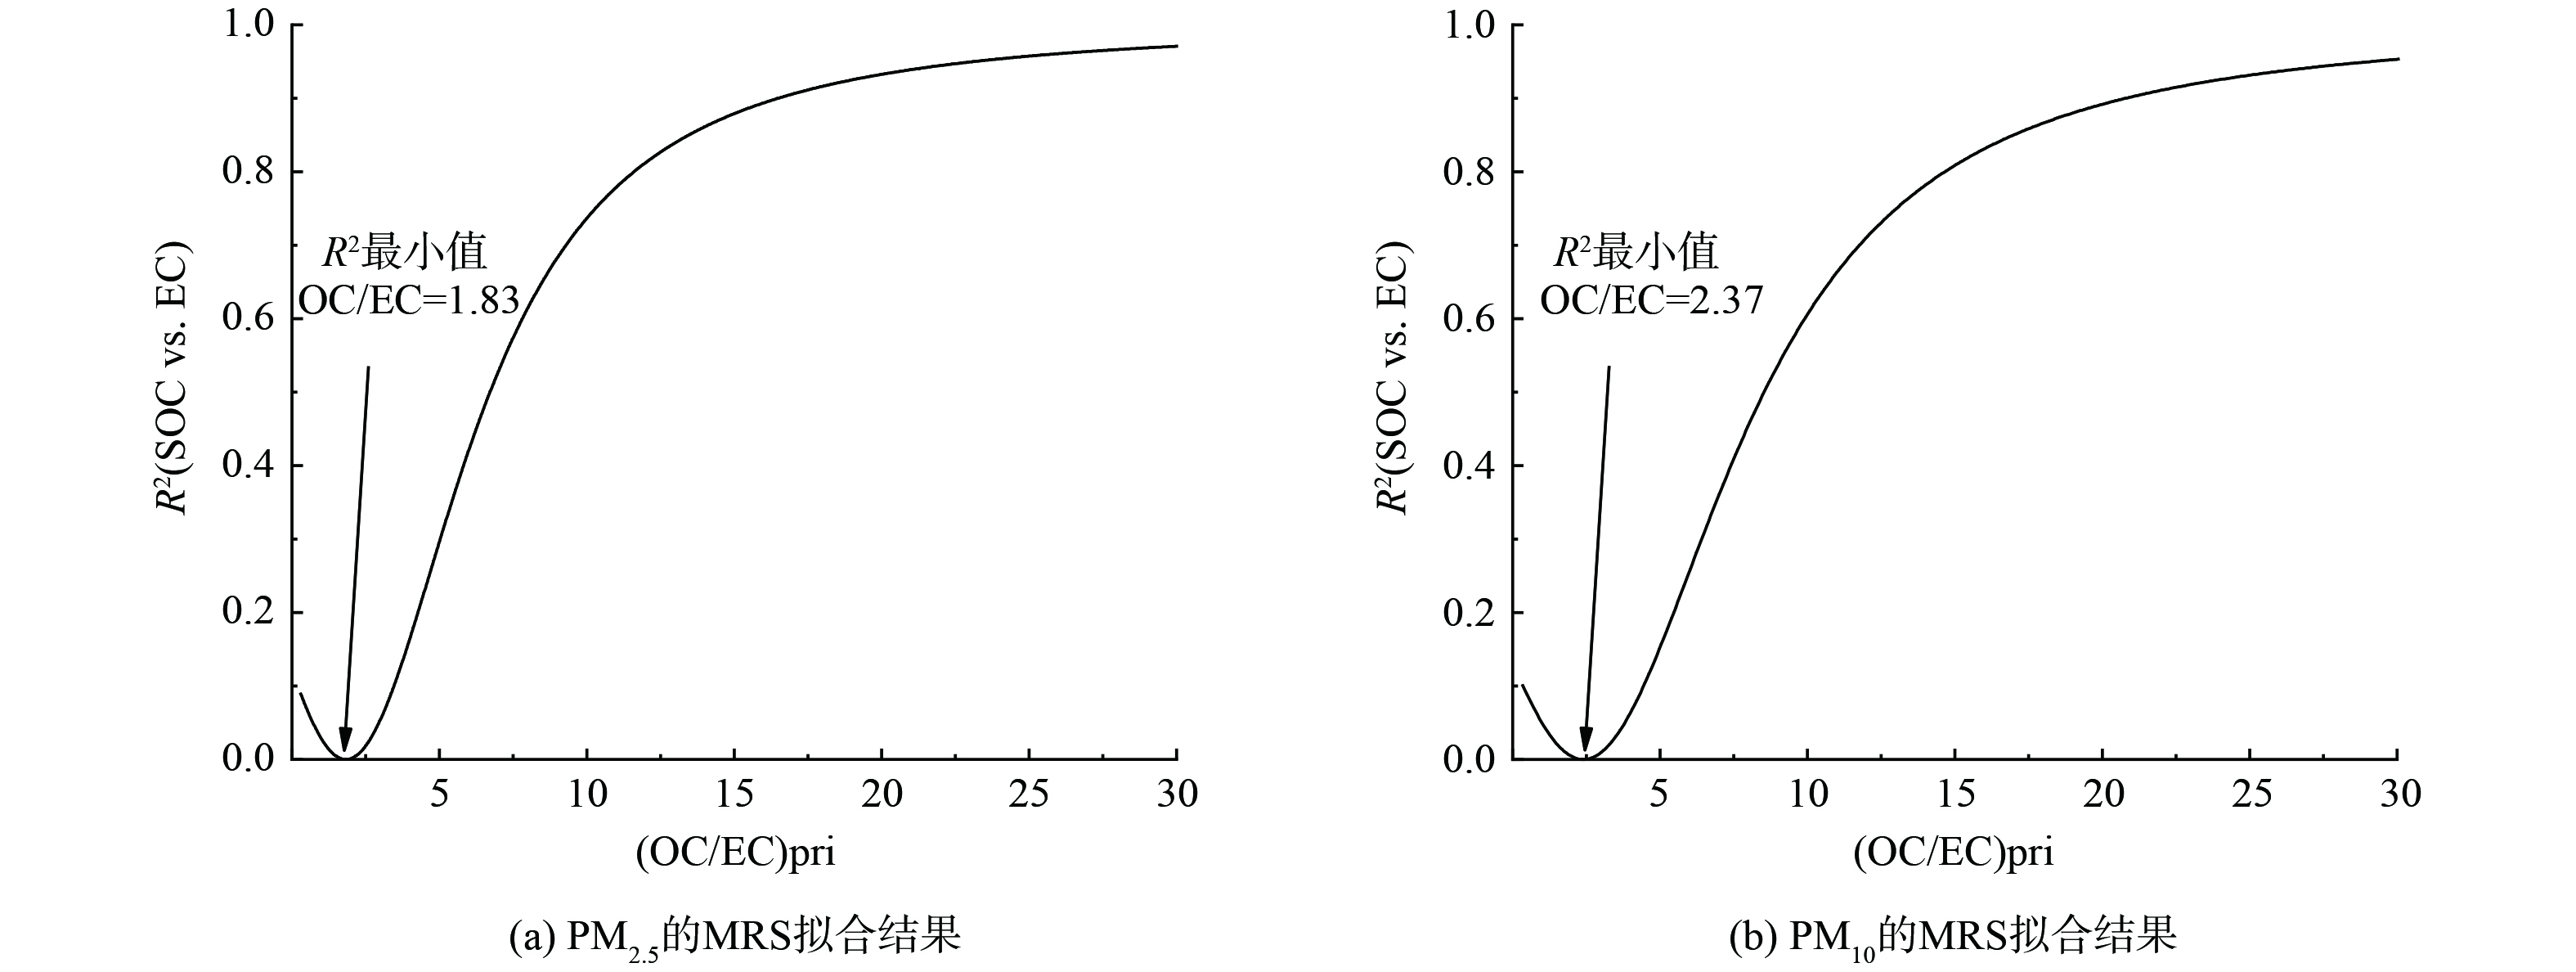
式中:SOC为SOC占比; OC和EC分别表示OC和EC占比;(OC/EC)pri是一次排放的新鲜气溶胶OC/EC比值。EC示踪法的关键是确定(OC/EC)pri的值,常用的方法是以观测到的OC/EC最小值(OC/EC)min作为(OC/EC)pri。但是由于污染物进入大气中不断远离排放源且不断经历老化过程,(OC/EC)min不能准确的替代(OC/EC)pri。因此,SOC的计算结果与实际值偏差较大。MILLET [30]提出了用最小相关系数法(MRS)来确定(OC/EC)pri的值,WU等[31-32]根据此原理开发了MRS软件,其假设假想的(OC/EC)pri_h值连续变化,每一个假设((OC/EC)pri_h算出对应的假想SOC_h,同时计算EC对的SOC_h相关系数(R2)。若EC和SOC_h的变化是独立的,则(OC/EC)pri_h对应于最小R2所得到的OC/EC比值即认为是MRS得出的(OC/EC)pri_MRS。该方法已经被应用到环境空气颗粒物中SOC的计算,如JI等[33]、国纪良等[34]分别使用MRS软件计算了京津冀、盘锦市的环境空气颗粒物中SOC的浓度。本文尝试利用WU等开发的MRS软件估算西宁市道路扬尘PM2.5和PM10中SOC的占比,结果见图4。MRS设置参数为:Scan from=0.1, Scan end=10, Scan step=0.01, Scan factor=3。
图4表明,PM2.5 (OC/EC)pri的值为1.83,PM10 (OC/EC)pri的值为2.37。据此计算得到西宁市道路扬尘PM2.5中SOC占比7.47%,占OC总量的81.91%;PM10中SOC占比7.16%,占OC总量的76.25%。这说明西宁市道路扬尘存在明显的二次污染。推测可能是由于采样时间为5月份,此时温度较高、光照强、大气活性高,加剧了二次有机反应的发生,会导致二次有机碳浓度较高。
-
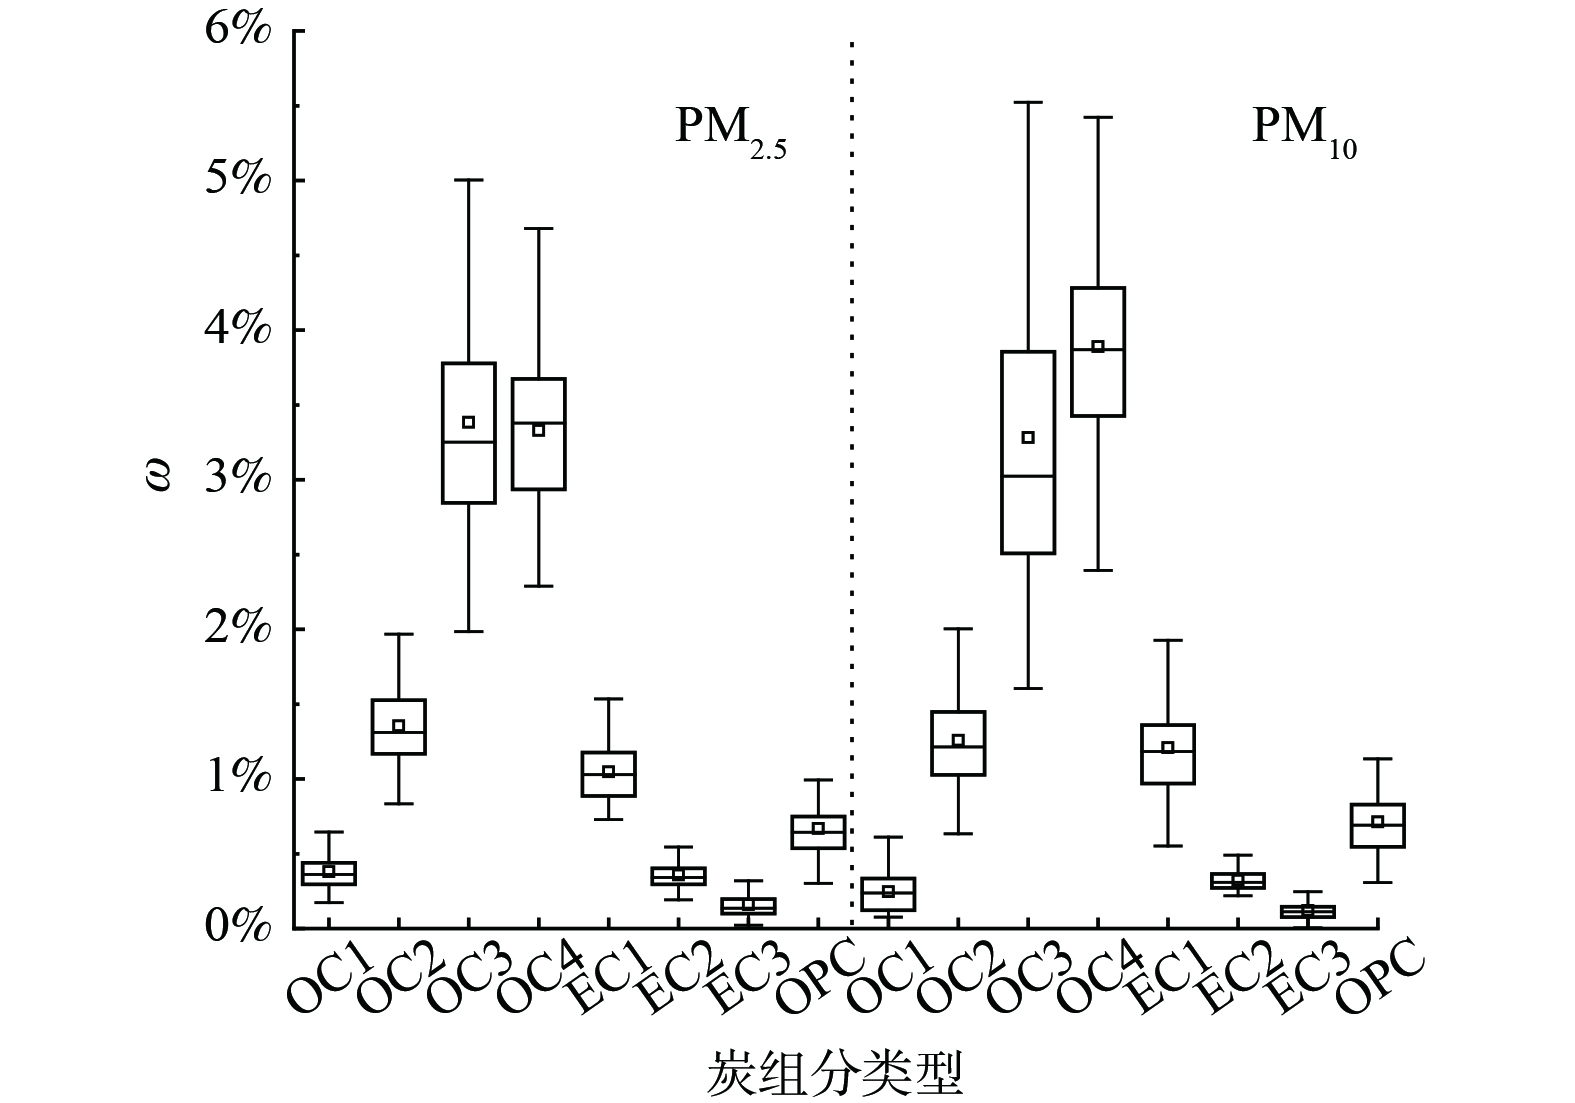
依据不同碳组分的分布特征可初步判定污染的具体来源。研究表明[23,35-37],OC1主要来源于生物质燃烧,OC2主要来自燃煤,OC3、OC4、EC1来源于汽油车尾气排放,EC2、EC3来源于柴油车尾气排放,OPC是大气中水溶性极性化合物的主要成分。PM2.5和PM10中各种碳组分含量如图5所示。
图5表明,道路扬尘PM2.5和PM10中的碳组分含量差异不大,ω(OC2)、ω(OC3)、ω(OC4)均较高,这说明西宁市道路扬尘中的PM2.5和PM10主要来源于燃煤和汽油车尾气排放,道路扬尘PM2.5和PM10的来源大致相同。为了进一步解析西宁市道路扬尘PM2.5和PM10的来源,利用 SPSS 26.0 软件分别对西宁市春季PM2.5和PM10中的 8 种碳组分进行因子分析, Bartlett's 球状检验结果均为0.00<0.05,可进行因子分析,具体结果见表2。
由表2可知,PM2.5中2个因子解释了碳组分含量88.734%的变化,因子1与OC1、OC2、OC3有较好的关联,对OC1、OC2、OC3进行Spearman相关分析均得到P=0.000 (<0.05),r值范围 0.440~0.737,相关性较好,可能具有相似的一次来源,故判定因子1代表生物质燃烧、燃煤排放及汽油车尾气的混合源;因子2明显与EC3有较好的关联,故判定因子2代表柴油车尾气源。由此可知,西宁市道路扬尘 PM2.5中碳组分主要来源于生物质燃烧、燃煤及机动车尾气。PM10中2个因子解释了碳组分含量83.613%的变化,因子1与OC2、OC3有较好的关联,对OC2、OC3进行Spearman相关分析得到P=0.000 (<0.05),r值为0.831为显著相关,可能具有相同的一次来源。因此,判定因子1代表燃煤排放以及汽油车尾气的混合源;因子2与EC3有较好的关联,故判定因子2代表柴油车尾气源。综上所述,西宁市道路扬尘 PM10中碳组分来源于燃煤排放和机动车尾气。将因子分析的结果与前文通过 OC/EC 初步分析碳组分来源的结论进行比较,发现2种方法所得结果具有一致性。因此,西宁市春季道路扬尘主要受生物质燃烧、燃煤及机动车尾气等污染源的影响。
-
1)西宁市春季道路扬尘PM2.5和PM10中ω(TC)分别为8.49%(环线)~10.38%(支路)和8.38%(环线)~10.78%(支路);ω(OC)分别为7.68%(环线)~9.36%(支路)和7.30%(环线)~9.76%(支路);ω(EC)分别为0.74%(国道)~1.02%(支路)和0.59%(高速)~1.09%(环线)。总体来看,支路中各碳组分质量分数均较高,环线中各碳组分质量分数均较低。2)西宁市道路扬尘PM2.5和PM10的OC/EC值分别为5.09~16.61和4.40~17.20,均大于2。这说明西宁市春季道路扬尘PM2.5和PM10 存在明显的二次污染。利用最小相关系数法估算PM2.5和PM10中SOC的含量分别为7.47%和7.16%,分别占OC总量的81.91%和76.25%。因子分析和OC/EC比值分析表明西宁市春季道路扬尘PM2.5和PM10主要来源于燃煤、生物质燃烧和机动车尾气排放。
西宁市春季道路扬尘碳组分特征及来源解析
Characteristics and source apportionment of carbon components in road dust in Xining City
-
摘要: 为研究西宁市道路扬尘PM2.5和PM10中碳组分的特征及其来源,于2019年5月使用样方法采集西宁市78条铺装道路,通过NK-ZXF再悬浮仪器将样品悬浮到滤膜上,并利用热光碳分析仪测定有机碳(OC)和元素碳(EC)组分。结果表明:PM2.5中ω(TC)为8.49%(环线)~10.38%(支路),ω(OC)为7.68%(环线)~9.36%(支路),ω(EC)为0.74%(国道)~1.02%(支路);PM10中ω(TC)为8.38%(环线)~10.78%(支路),ω(OC)为7.30%(环线)~9.76%(支路),ω(EC)为0.59%(高速)~1.09%(环线)。各类型道路中ω(OC) 均明显大于ω(EC),ω(EC) 在不同道路类型中差异不大。OC在PM10中的质量分数均高于在PM2.5中的值,表明OC更容易富集到粒径大的颗粒物上。采用最小相关系数法(MRS)估算道路扬尘PM2.5和PM10中SOC含量,得出SOC分别占OC总量的81.91%和76.25%。以上结果说明道路扬尘存在明显的二次污染。因子分析和OC/EC比值分析表明西宁市春季道路扬尘PM2.5和PM10主要来源于燃煤、生物质燃烧和机动车尾气排放。本研究可为西宁市道路扬尘污染防治工作及制定环境管理对策提供参考。Abstract: In order to study the characteristics and sources of carbon components in road dust PM2.5 and PM10 in Xining City, samples were collected by the quadrat sampling method at 78 paved roads in May 2019. The samples were re-suspended on filters by using a NK-ZXF sampler, and the concentrations of organic carbon (OC) and elemental carbon (EC) were determined by Thermal Optical Carbon Analyzer. Results showed that the ω(TC) in PM2.5 of road dust was 8.49% (ring road) ~ 10.38% (access road), ω(OC) was 7.68% (ring road) ~ 9.36% (access road), ω(EC) was 0.74% (national highway) ~ 1.02% (access road); ω(TC) was 8.38% (ring road) in PM10 of road dust to 10.78% (access road), ω(OC) was 7.30% (ring road) ~ 9.76% (access road), ω(EC) was 0.59% (expressway) ~ 1.09% (ring road). ω(OC) was obviously greater than ω(EC) for all road types, and ω(EC) did not vary significantly among all road types. The mass fraction of OC in PM10 was higher than that in PM2.5, indicating that OC was more easily enriched to particles with larger particle size. The minimum correlation coefficient method (MRS) was employed to estimate the SOC content in PM2.5 and PM10 of road dust, and it was found that SOC accounted for 81.91% and 76.25% of the total OC, respectively, which indicated that there was significant secondary pollution in road dust. Factor analysis and the OC/EC ratio analysis showed that PM2.5 and PM10 of road dust in spring in Xining City were mainly derived from coal combustion, biomass burning, and vehicle exhaust. This study can provide a reference for preventing and controlling road dust pollution and developing environmental management countermeasures in Xining City.
-
Key words:
- Xining City /
- road dust /
- PM2.5 /
- PM10 /
- organic carbon /
- secondary organic carbon (SOC) /
- elemental carbon
-

-
表 1 采样信息
Table 1. Sampling information
道路类型 道路数量 采集样品数量 主干道 26 105 次干道 23 134 支路 21 68 环线 2 9 国道 2 6 高速路 4 31 合计 78 353 表 2 道路扬尘PM2.5和PM10中碳组分因子分析结果
Table 2. The carbon component factor analysis results of PM2.5 and PM10 in road dust
碳组分和
数据类型PM2.5 PM10 因子1 因子2 因子1 因子2 OC1 0.877 0.173 0.662 0.478 OC2 0.895 0.295 0.941 0.138 OC3 0.891 0.329 0.903 0.108 OC4 0.794 0.508 0.872 0.319 EC1 0.806 0.556 0.865 0.430 EC2 0.539 0.745 0.595 0.661 EC3 0.162 0.946 0.103 0.953 OPC 0.690 0.649 0.772 0.462 解释方差 78.262% 10.472% 71.573% 12.040% 累积解释方差 88.734% 83.613% -
[1] TAN J H, ZHANG L M, ZHOU X M, et al. Chemical characteristics and source apportionment of PM2.5 in Lanzhou, China[J]. Science of the Total Environment, 2017, 601/602: 1743-1752. doi: 10.1016/j.scitotenv.2017.06.050 [2] 董喆, 袁明浩, 苏方成, 等. 郑州市细颗粒物时空差异及管控措施影响[J]. 环境科学, 2021, 42(5): 2179-2189. [3] 裴坤宁, 高兴艾, 王淑敏, 等. 晋东南地区冬季 PM2.5 污染输送路径分析[J]. 中国环境科学, 2022, 42(2): 557-567. [4] GAO J, WANG K, WANG Y, et al. Temporal-spatial characteristics and source apportionment of PM2.5 as well as its associated chemical species in the Beijing-Tianjin-Hebei region of China[J]. Environmental Pollution, 2018, 233: 714-724. doi: 10.1016/j.envpol.2017.10.123 [5] WANG M, DUAN Y S, ZHANG Z Z, et al. Increased contribution to PM2.5 from traffic-influenced road dust in Shanghai over recent years and predictable future[J]. Environmental Pollution, 2022, 313: 120119. doi: 10.1016/j.envpol.2022.120119 [6] 王苏蓉, 喻义勇, 王勤耕, 等. 基于PMF模式的南京市大气细颗粒物源解析[J]. 中国环境科学, 2015, 35(12): 3535-3542. doi: 10.3969/j.issn.1000-6923.2015.12.002 [7] 王敬, 毕晓辉, 冯银厂, 等. 乌鲁木齐市重污染期间PM2.5污染特征与来源解析[J]. 环境科学研究, 2014, 27(2): 113-119. [8] WILLIAN L A, TACIANA T A, PRASHANT K. Excess deaths associated with fine particulate matter in Brazilian cities[J]. Atmospheric Environment, 2018, 194: 71-81. doi: 10.1016/j.atmosenv.2018.09.034 [9] MOHAMMED M O A, SONG W W, MA W L, et al. Potential toxicological and cardiopulmonary effects of PM2.5 exposure and related mortality: Findings of recent studies published during 2003-2013[J]. Biomedical and Environmental Sciences, 2016, 29(1): 66-79. [10] 陶燕, 刘亚梦, 米生权, 等. 大气细颗粒物的污染特征及对人体健康的影响[J]. 环境科学学报, 2014, 34(3): 592-597. doi: 10.13671/j.hjkxxb.2014.0107 [11] 林孜, 姬亚芹, 林宇, 等. 鞍山市道路扬尘碳组分特征及来源解析[J]. 环境科学, 2020, 41(9): 3918-3923. [12] 马妍, 姬亚芹, 国纪良, 等. 天津市春季样方法道路扬尘碳组分特征及来源解析[J]. 环境科学, 2019, 40(6): 2540-2545. [13] 胡月琪, 李萌, 颜旭, 等. 北京市典型道路扬尘化学组分特征及年际变化[J]. 环境科学, 2019, 40(4): 1645-1655. [14] 沈利娟, 王红磊, 孙杰娟, 等. 西安市城市降尘和土壤尘PM10和PM2.5中碳组分特征[J/OL]. 环境科学, 2022: 1-19,doi:10.13227/j.hjkx.202210051. [15] 张忠诚, 谢宇琪, 张智杰, 等. 基于两种受体模型的太原市大气降尘来源解析及季节变化特征[J]. 中国环境科学, 2022, 42(6): 2577-2586. doi: 10.3969/j.issn.1000-6923.2022.06.011 [16] 郭森, 王蕾, 周盼, 等. 石家庄夏季道路尘有机碳和元素碳特征及来源[J]. 环境工程, 2018, 36(4): 122-126. [17] 张伟, 姬亚芹, 李树立, 等. 天津市春季道路降尘PM2.5和PM10中碳组分特征[J]. 环境科学研究, 2018, 31(2): 239-244. [18] 窦筱艳, 赵雪艳, 徐珣, 等. 应用化学质量平衡模型解析西宁大气PM2.5的来源[J]. 中国环境监测, 2016, 32(4): 7-14. [19] CHOW J C, WASTON J G, PRITCHETT L C, et al. The dri thermal/optical reflectance carbon analysis system: description, evaluation and applications in U. S. Air quality studies[J]. Atmospheric Environment. Part A:General Topics, 1993, 27(08): 1185-1201. doi: 10.1016/0960-1686(93)90245-T [20] 张灿, 周志恩, 翟崇治, 等. 基于重庆本地碳成分谱的PM2.5碳组分来源分析[J]. 环境科学, 2014, 35(3): 810-819. [21] YU H, ZHAO X Y, WANG J, et al. Chemical characteristics of road dust PM2.5 fraction in oasis cities at the margin of Tarim Basin[J]. Journal of Environmental Sciences, 2020, 95(09): 217-224. [22] 于鸣媛, 王谦, 付明亮, 等. 机动车尾气碳质气溶胶排放因子及其稳定碳同位素特征[J/OL]. 环境科学, 2023, 1-12,doi:10.13227/j.hjkx.202212152. [23] 王红磊, 刘思晗, 孙杰娟, 等. 机动车源和民用燃料源颗粒物中有机碳和元素碳的排放特征[J]. 环境科学, 2023, 44(4): 1890-1898. [24] CHOW J C, WASTON J G, LU Z, et al. Descriptive analysis of PM2.5, and PM10, at regionally representative locations during SJVAQS/AUSPEX[J]. Atmospheric Environment, 1996, 30(12): 2079-2112. doi: 10.1016/1352-2310(95)00402-5 [25] SCHAUER J J, KLEEMAN M J, Cass G R, et al. Measurement of emissions from air pollution sources: 5. C1-C32 organic compounds from gasoline-powered motor vehicles[J]. Environmental Science and Technology, 2002, 36(6): 1169-1180. doi: 10.1021/es0108077 [26] CHEN Y J, ZHI G R, FENG Y L, et al. Measurements of emission factors for primary carbonaceous particles from residential raw-coal combustion in China[J]. Geophysical Research Letters, 2006, 33(20): 20815. doi: 10.1029/2006GL026966 [27] 高玉宗, 姬亚芹, 林孜, 等. 西宁市生物质燃烧源大气污染物排放清单[J]. 环境科学, 2021, 42(12): 5585-5593. [28] 李冬, 陈建华, 张凯, 等. 保定市春季道路扬尘颗粒物中碳组分特征及来源分析[J]. 环境污染与防治, 2020, 42(10): 1293-1297. [29] TURPIN B J, HUNTZICKER J J. Identification of secondary organic aerosol episodes and quantitation of primary and secondary organic aerosol concentrations during SCAQS[J]. Atmospheric Environment, 1995, 29(23): 3527-3544. doi: 10.1016/1352-2310(94)00276-Q [30] MILLET D B, DONAHUE N M, PANDIS S N, et al. Atmospheric volatile organic compound measurements during the Pittsburgh air quality study: results, interpretation, and quantification of primary and secondary contributions[J]. Journal of Geophysical Research Atmospheres, 2005, 110(D7): 1-17. [31] WU C, YU J Z. Determination of primary combustion source organic carbon-to-elemental carbon (OC / EC) ratio using ambient OC and EC measurements: secondary OC-EC correlation minimization method[J]. Atmospheric Chemistry and Physics, 2016, 16(8): 5453-5465. doi: 10.5194/acp-16-5453-2016 [32] WU C, WU D, YU J Z. Quantifying black carbon light absorption enhancement with a novel statistical approach, Atmospheric Chemistry and Physics[J]. Atmospheric Chemistry and Physics, 2018, 18(1): 289-309. doi: 10.5194/acp-18-289-2018 [33] JI D S, GAO M, MAENHAUT W, et al. The carbonaceous aerosol levels still remain a challenge in the Beijing-Tianjin-Hebei region of China: Insights from continuous high temporal resolution measurements in multiple cities[J]. Environment International, 2019, 126: 171-183. doi: 10.1016/j.envint.2019.02.034 [34] 国纪良, 姬亚芹, 马妍, 等. 盘锦市夏冬季PM2.5中碳组分污染特征及来源分析[J]. 中国环境科学, 2019, 39(8): 3201-3206. [35] CHOW J C, WASTON J G, KUHNS H, et al. Source profiles for industrial mobile and area sources in the Big Bend Regional Aerosol Visibility and Observational study[J]. Chemosphere, 2004, 54(02): 185-208. doi: 10.1016/j.chemosphere.2003.07.004 [36] CAO J J, WU F, Chow J C, et al. Characterization and source apportionment of atmospheric organic and elemental carbon during fall and winter of 2003 in Xi'an, China[J]. Atmospheric Chemistry and Physics, 2005, 5(11): 3127-3137. doi: 10.5194/acp-5-3127-2005 [37] DEMIR T, KARAKAS D, YENISOY-KARAKAS S. Source identification of exhaust and non-exhaust traffic emissions through the elemental carbon fractions and Positive Matrix Factorization method[J]. Environmental Research, 2022, 204: 112399. doi: 10.1016/j.envres.2021.112399 -


 下载:
下载:
