-
二氧化碳(CO2)是大气中最重要的长寿命温室气体。受化石燃料燃烧、土地利用变化、森林砍伐等人为活动的持续影响,全球大气中CO2混合比已由工业革命前期(1750年)的约280×10−6(混合比)上升至2019年的(410.50 ± 0.10)×10−6[1],由此导致全球变暖、海平面上升和海洋酸化等一系列气候与环境变化问题[2]。同时,科学界也认识到高精度高时空分辨率的观测研究,是厘清CO2源汇过程,探究和预测气候与环境变化,进而科学实施CO2减排和实现碳中和的基础。
大气CO2观测方式包括陆(岛)基观测站的定点时间序列观测、大气垂直廓线观测(如高塔分层采样观测)、冰芯采样观测、表层海水与上覆大气间通量观测、卫星遥感观测、移动平台观测(如飞机、船舶和汽车等)等[3]。船基移动观测是开展海洋大气温室气体海-气交换通量研究和海-陆输送过程分析的重要方式[4]。20世纪80年代以来,日本气象厅在西太平洋开展了逐年的海洋大气CH4船基离散采样观测研究,结果显示,西太平洋海表大气CH4呈明显的纬向分布特征,即海表大气CH4混合比随纬度增加而升高[5]。2009年以来,欧美日发达国家和我国科研院校先后利用光腔衰荡光谱分析仪或离轴积分腔输出光谱分析仪等高频高精度观测设备,开展海洋大气温室气体(CO2和CH4等)船基走航连续观测,并利用海洋油气平台下风向观测的CO2和CH4峰值信号,初步构建“自上而下”估算方法,针对性定量探究了海洋油气开采对大气温室气体的贡献[6-9]。
我国拥有300多万平方公里的管辖海域,海洋油气开采、海上航运和海水养殖等人为活动可能影响局地乃至区域海洋大气温室气体的时空分布特征,但海洋温室气体观测研究长期侧重于海-气交换通量,而针对海洋大气温室气体的观测研究起步较晚,观测方法和标准各异[10]。2008年,渤海湾近岸海域的船基离散采样观测显示,CH4、N2O和CO2混合比受局地陆-海气团输送影响,具有较强的人为源影响特征,且季节差异明显[11]。2012年起,我国开始船基走航式高频高精度连续观测,解析近海大气温室气体的时空分布特征和调控机理[9,12]。但由于我国近海大气温室气体时空分布受海-陆输送、海-气交换、船舶排放和海洋油气开采等自然和人为过程的多重耦合影响,因此有必要优化建立适用于船基走航高频高精度连续观测的数据质控方法,特别是数据筛分方法,以更准确地开展自然和人为源汇过程的定性定量研究。
本研究基于2013年春季我国近海大气CO2船基走航高频高精度连续观测数据,开展数据筛分处理方法研究,以期精准区分各种自然及人为过程对海洋大气CO2时空分布的影响,进而获取精细化温室气体观测研究产品,推进科学碳减排措施,为实现碳中和提供技术支撑[13]。
-
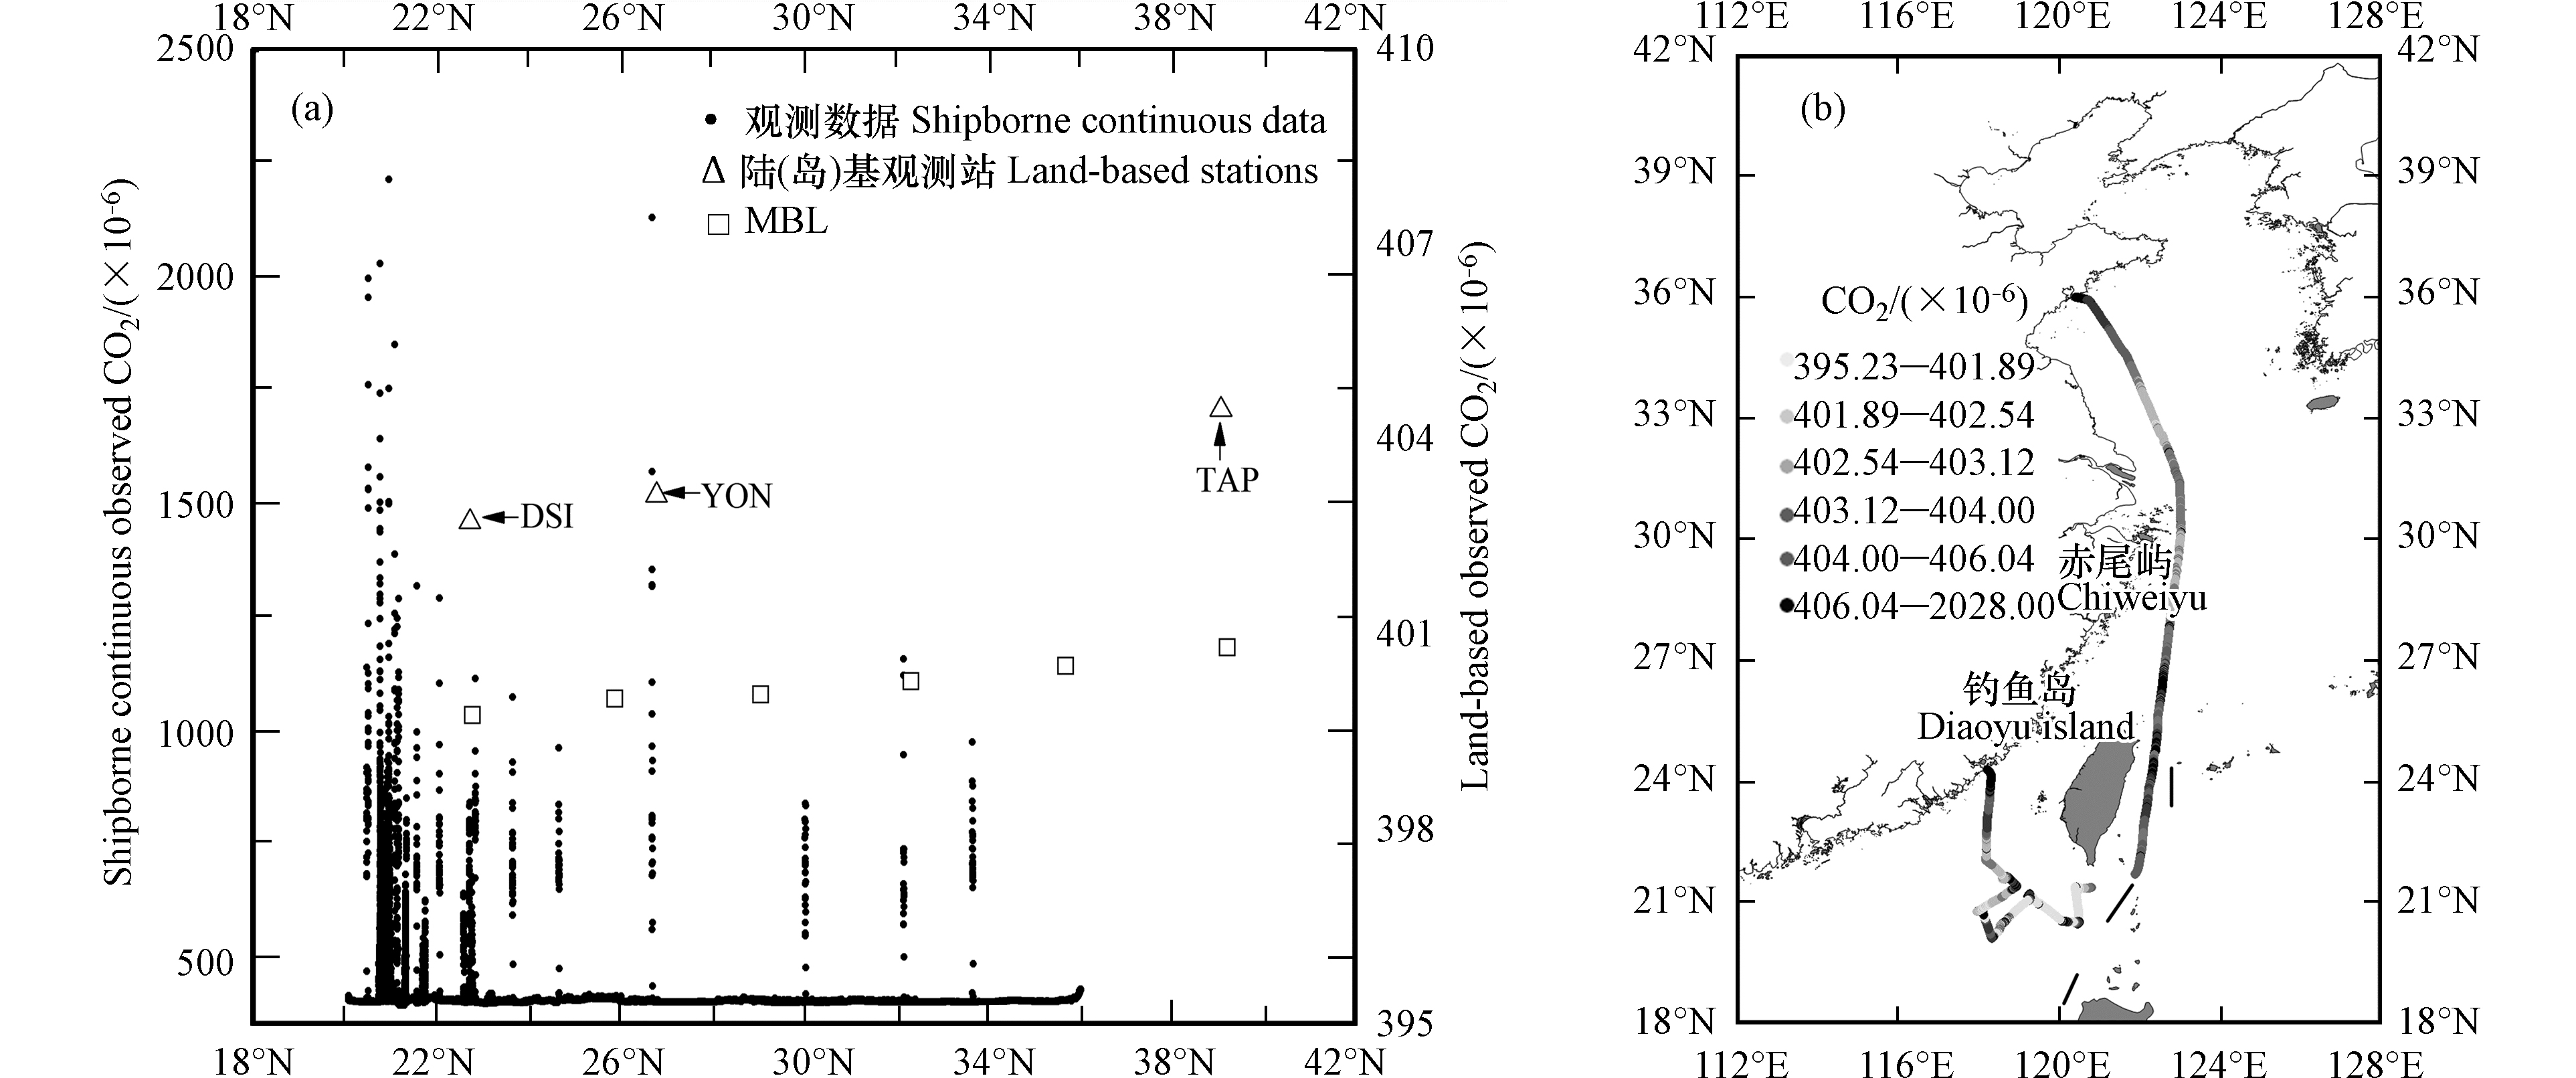
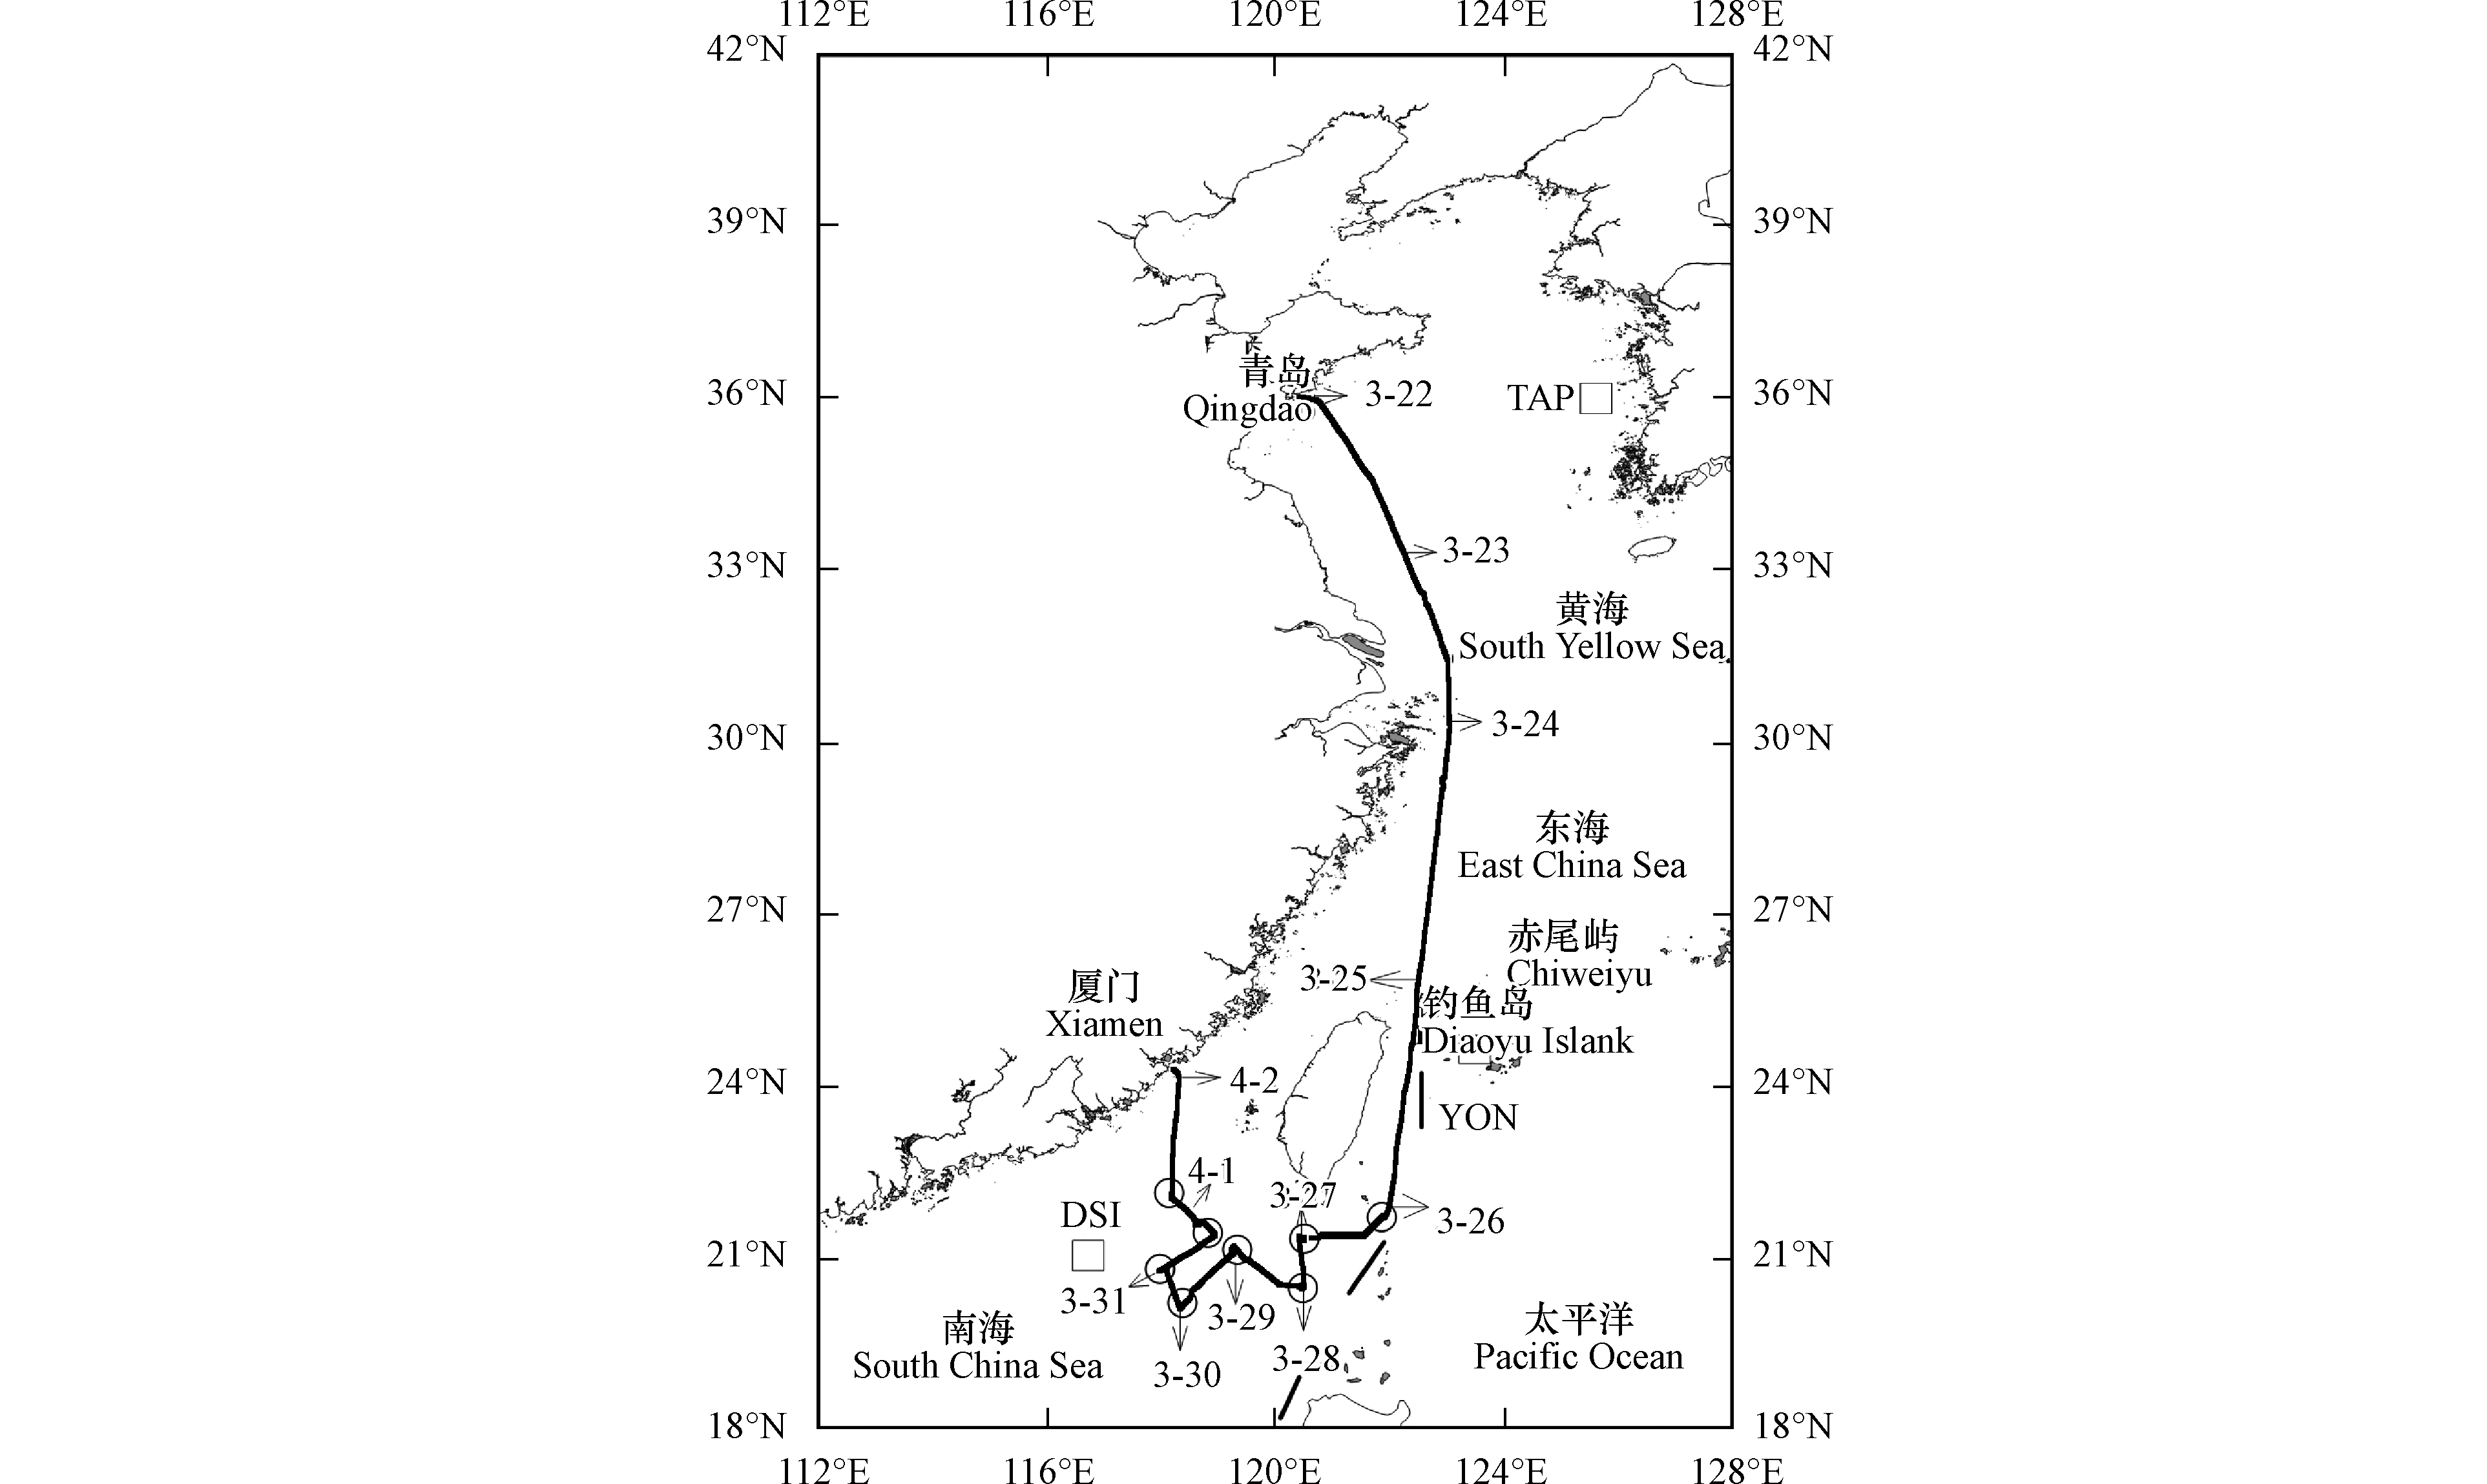
观测海域如图1所示。2013年3月22日,本研究搭载东方红2号调查船从青岛启航,经南黄海和东海,出宫古海峡进入西太平洋,再经吕宋海峡进入南海东北部海域,最后于4月2日至厦门结束观测工作。本航次观测海域位于亚洲大陆和太平洋之间,是海-陆气团输送的重要通道。且初春季节为亚洲大陆向西太平洋地区大气输送最强的冬季风主导时期,有利于获取陆-海输送对海洋大气温室气体时空分布影响的基础信息[8-9]。
-
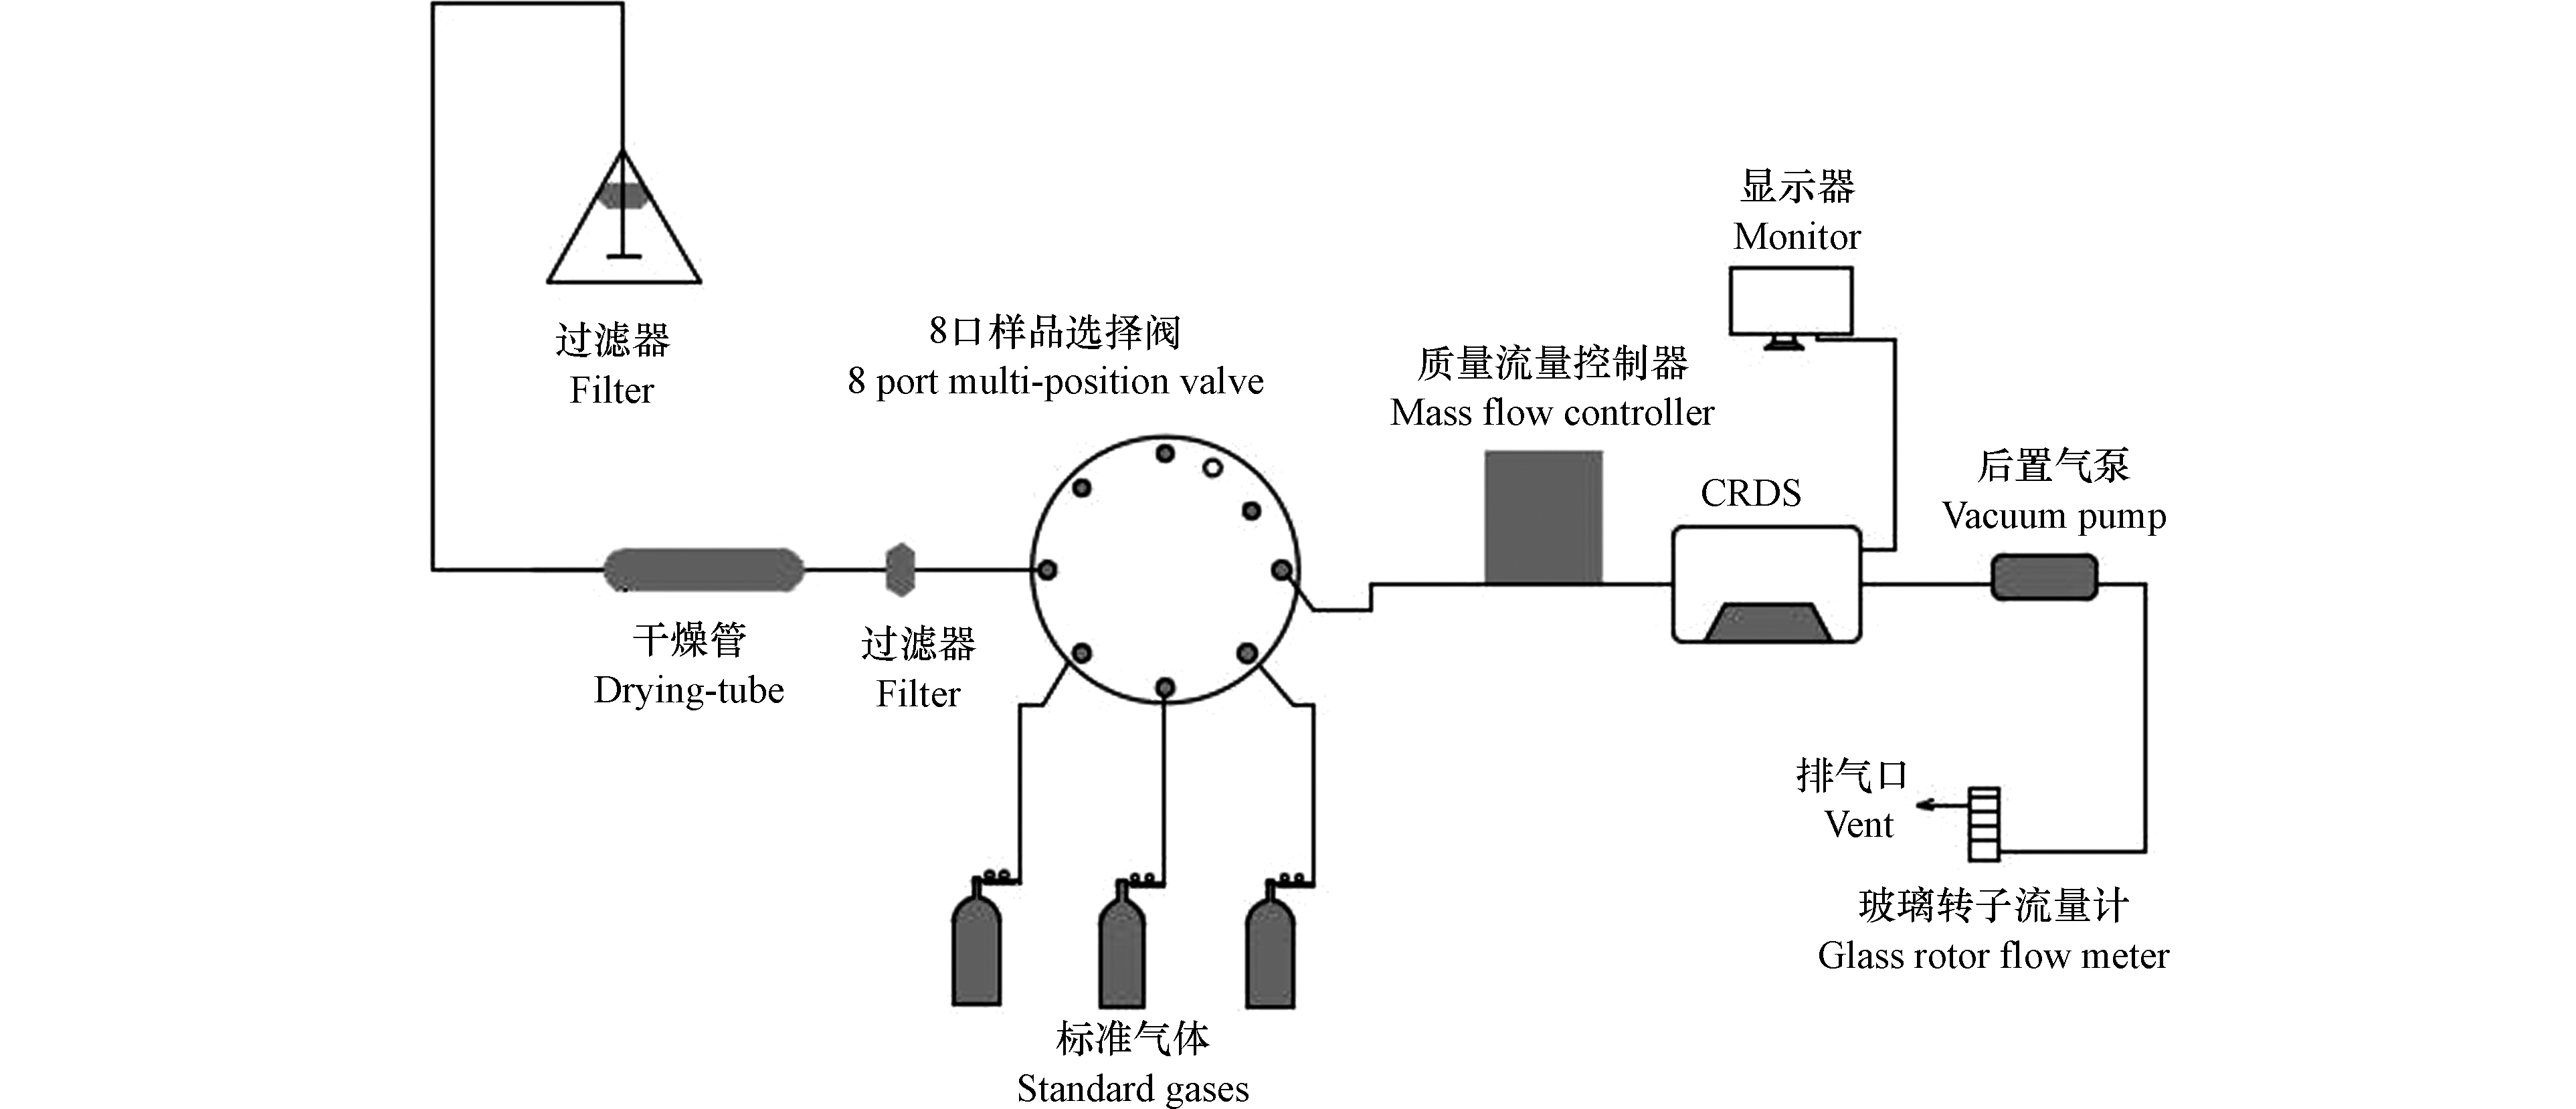
如图2,本研究以Picarro G 2301型CO2/CH4/H2O CRDS光腔衰荡光谱分析仪(Picarro Inc., 美国)为核心,辅以囊式过滤器(1 μm)、Decabon大气进样管、干燥管、8口样品选择阀(EMT2SD8MWE, Valco TX. USA.)和质量流量控制器(D07,北京七星华创流量计有限公司)等功能组件,自组装建立适用于海洋大气CO2和CH4混合比观测的船基走航高频连续观测系统[14]。CO2标准气体置于5.9 L铝合金气瓶内,混合比分别为365.15×10⁻⁶、407.10×10⁻⁶和498.55×10⁻⁶,由中国气象局中国气象科学研究院温室气体实验室多轮标校,可溯源至世界气象组织(World Meteorological Organization, WMO)一级标准。
为尽量避免烟囱废气和人员活动等船体人为污染,将空气进样口设置在船桅靠近船舶气象仪的最高处,距海面约15 m[15]。如图2,现场观测期间,首先,空气经过滤器(1 μm)滤除颗粒物后进入气路,然后,经填充高氯酸镁的干燥管除去水气,再通过过滤器(1 μm)滤除气流中可能携带的高氯酸镁颗粒[16]。干燥后的空气或标准气体由8口样品选择阀按程序切换,经质量流量控制器调节,以200 mL·min−1的流速进入CRDS分析仪测定,最后经CRDS分析仪自带的后置气泵排出。该系统每2秒完成并记录一组观测数据。
尽管CRDS分析仪能够自动校正水气对CO2和CH4的影响,但海洋大气中水气含量呈饱和或过饱和状态,且水气中的盐分可能腐蚀仪器内部气路和光腔,因此,有必要采取措施去除空气中水气。陆基观测站常用超低温冷阱(露点-70 °C)去除大气样品中水气。该方式除水效率高,但以酒精为制冷介质,不符合调查船安全管理要求[13-14]。本研究经实验室测定,确定采用填充高氯酸镁的干燥管实施除水,当CRDS分析仪水气响应值小于0.5% (V/V)时,仪器对测定标气的自动校正结果与标称值偏差小于0.1×10−6。为保证CRDS分析仪正常工作状态,海上观测期间,水气响应值由0.002%上升至0.3%时,即更换干燥管[17]。
-
拉依达准则(3σ准则)是一种广泛应用的异常值统计筛分方法,其原理为:对一组观测数据计算平均值和标准偏差(σ),再计算各观测数据与平均值的差值,如果某一差值的绝对值大于3σ,则其对应的观测数据为异常值。剩余数据重复上述计算过程,直至所有观测数据与平均值差值的绝对值均小于3σ[18]。该方法适用于观测样本大于10个的数据集。
-
HYSPLIT-4 ( Hybrid Single-Particle Lagrangian Integrated Trajectory, HYSPLIT)是由美国国家海洋和大气管理局空气资源实验室开发的模型,可基于美国国家环境预报中心(National Centers for Environmental Prediction, NCEP)的再分析资料进行大气输送轨迹的计算[19]。其模拟气团输送路径的原理是:假设空气中的粒子随风飘动,它的移动轨迹就是其在时间和空间上位置矢量的积分[20]。后向轨迹分析是运用混合单粒子拉格朗日积分传输、扩散模式进行空气质点前推计算,通过输送路径跟踪分析气团输送对观测区域大气成分时空分布的影响,并推断其潜在来源[21]。计算后向轨迹所需的主要参数为开始时间、起始点的经纬度、距离地面高度和模式顶高度,一般前推计算3 d (-72 h) [22]。
-
因观测方式、仪器设备和应用需求不同,大气温室气体观测数据质量控制和数据筛分方法也不尽相同[23-24]。本研究中,首先根据观测时间,将观测数据或信号汇总同化,形成原始观测数据集,包括观测日期、时间、标准气体和空气样品的CO2混合比、大气温度、气压和相对湿度等数据。然后,将原始数据保存,备份原始数据用于数据处理。根据观测记录,对CRDS分析仪和船舶气象仪等设备观测数据进行数据补齐和时间校正,形成按分钟平均的可修订数据集,并基于外标法,利用标准气体标称值和测定值建立工作曲线,校正海洋大气CO2混合比观测结果[25]。最后,基于校正处理后的可修订数据文件优化建立适用于船基走航式连续观测数据的质控和筛分方法。
-
如图3所示,观测期间海域大气CO2混合比范围为395.17×10⁻⁶至2211.59×10−6,平均值为(409.88 ± 48.03)×10−6。高CO2混合比观测值与更换干燥管及停船作业的时间和/或空间相对应(图1和图3)[26]。同期同纬度范围内的海洋边界层(Marine Boundary Layer, MBL)CO2混合比范围为399.68×10⁻⁶至400.73×10⁻⁶,平均值为(400.17 ± 0.37)×10−6,低于本研究观测结果。毗邻观测海域的TAP、YON和DSI大气观测站的CO2观测结果分别为404.38×10⁻⁶、403.07×10⁻⁶和402.66×10⁻⁶,与本研究观测结果较一致。
如图3(a),观测海域大气CO2混合比与同期MBL和毗邻海域3个大气观测站的CO2混合比纬向分布特征基本一致。如图3(b),在靠近青岛和厦门的近岸海域,海洋大气CO2混合比呈离岸递减分布特征,即随岸距离越远,海洋大气CO2混合比观测结果越低。
-
调查船走航期间,观测系统为自动连续观测状态,人为操作主要为更换干燥管和故障排除。当CRDS分析仪水气响应值升至0.3%时,观测人员手动更换干燥管,并详细记录于航次日志。在此期间,空气进气气路为断开状态,在CRDS分析仪后置气泵作用下,调查船实验室内受人为活动影响的空气将被抽入CRDS分析仪,导致CO2观测数据异常波动[12]。
如图4所示,以3月24日18时11分至18时51分观测数据为例,更换和冲洗干燥管期间(18时26分至18时36分),CO2混合比观测值范围达402.92×10⁻⁶至2027.10×10−6,远超更换干燥管前、后自然空气中CO2观测值的波动范围:402.89×10⁻⁶至404.42×10⁻⁶。因此,更换干燥管期间异常偏高的观测数据不能真实反映自然条件下海洋大气中CO2混合比的实际状况。本研究中,基于航次日志对更换干燥管和仪器故障排除期间的海洋大气CO2观测数据予以标记。统计结果显示,全航次受更换干燥管影响的观测数据占总观测数据量的1.01%。
本研究中,因仪器故障,导致3月26日2时44分至8时47分吕宋海峡部分航段缺测。为便于数据统计和筛分,在可修订数据集中以-9999标记。
-
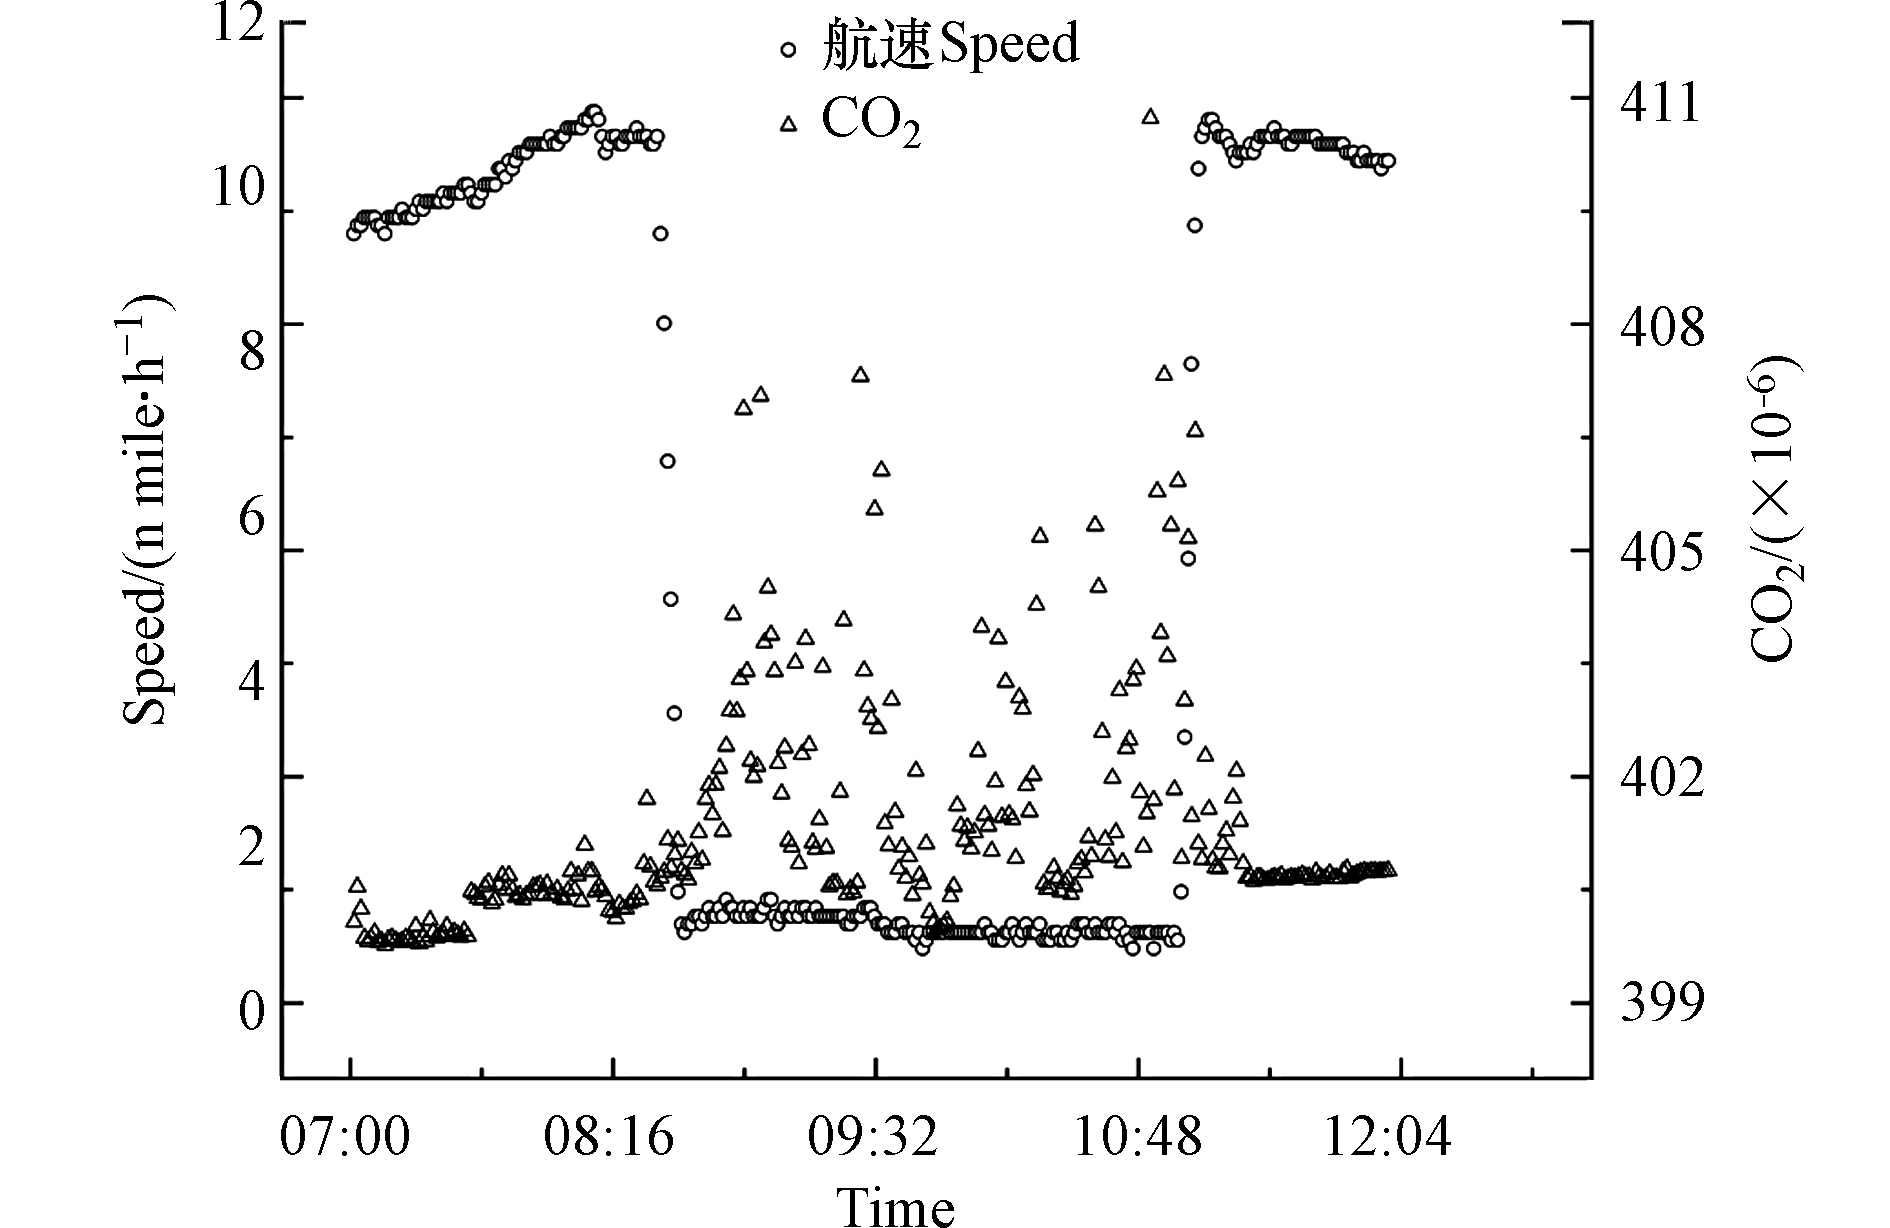
如图5所示,因海洋下垫面相对单一,在没有局地人为源影响下,海洋大气成分混合相对均匀。因此,调查船走航连续观测期间,CO2观测数据波动较小,而停船作业期间CO2观测数据波动较大。如图1和图3(b),观测显示,南海东北部海洋大气的CO2混合比高值均与调查站位坐标一致,可能受船体烟囱和人为活动排放的影响。
本研究中,CRDS船基走航连续观测系统的大气进样口设置于烟囱与船艏之间。当调查船正常巡航时,其烟囱排放废气飘向船尾,使大气进样口最大程度避开调查船烟囱羽状流的影响[27]。但海洋调查航次通常设置多条调查断面和离散站位,开展海洋物理、化学及生物等多学科综合观测研究。调查船停航实施站位作业期间,船舶烟囱排放的废气和甲板人为活动,可能导致局地大气环境中CO2混合比上升,并导致观测结果偏离实际大气CO2混合比值,因此需建立对应的数据质控与筛分方法[28]。
通常,调查船由巡航状态转为停船状态需10 min,据此平滑计算调查船停船和重新起航过程大气CO2观测数据的标准偏差。如图5,以3月28日7时至12时观测数据为例,当船速在以3节(1节=1.852 km·h-1)以上的航速航行时,CO2混合比数据比较平滑,SD值仅为0.94,当船速低于3节时,SD跃升至1.77,显示CO2观测数据受到船舶排放和人为活动排放的影响。因此,本研究将船速3节定为数据筛分条件,对因停船作业受船体排放影响的CO2观测数据进行标记。基于此方法对观测数据进行标记和筛分,得出全航次受船速影响的数据量占总观测数据量的39.84%。
-
将更换干燥管和站位作业期间受船体和人为排放影响的数据进行标记筛分后,仍有部分异常偏高的观测数据。一方面,因近岸海域受陆-海输送影响较强,存在大气成分混合不均匀情况,另一方面,在顺风航行期间,若真风速高于船速,大气进样口仍可能受船舶烟囱废气影响[29]。因此,为更有效地筛分异常观测结果,本研究根据拉依达准则(3σ准则)对剩余观测数据进行异常值检验和筛分。
如图6所示,以3月24日16时至3月25日19时观测数据为例,该时段航速航向分别为5.9节(3.03 m·s−1)至13.1节(6.74 m·s−1)和82.50°至210.10°,风速风向分别为7.00 m·s−1至18.55 m·s−1和0.00°至359.00°,航向和风向存在一致性,因此观测数据可能受船体烟囱排放的影响。观测显示,在西太平洋中纬度海域,大气在百公里尺度几乎呈混匀状态[5-6],结合现场观测期间航速数据(0.1节至13.1节),本研究分别以1 h、2 h、4 h和6 h为时间窗口时,仅可有效标记部分异常数据,但以10 h为时间窗口,则将部分波动极小的本底数据误标记为异常值[30]。因此,基于综合对比评估,本研究优化确定以8 h为时间窗口,对观测数据进行筛分处理。基于拉依达准则(3σ准则)标记和筛分的异常数据量占总观测数据量的3.87%。
-
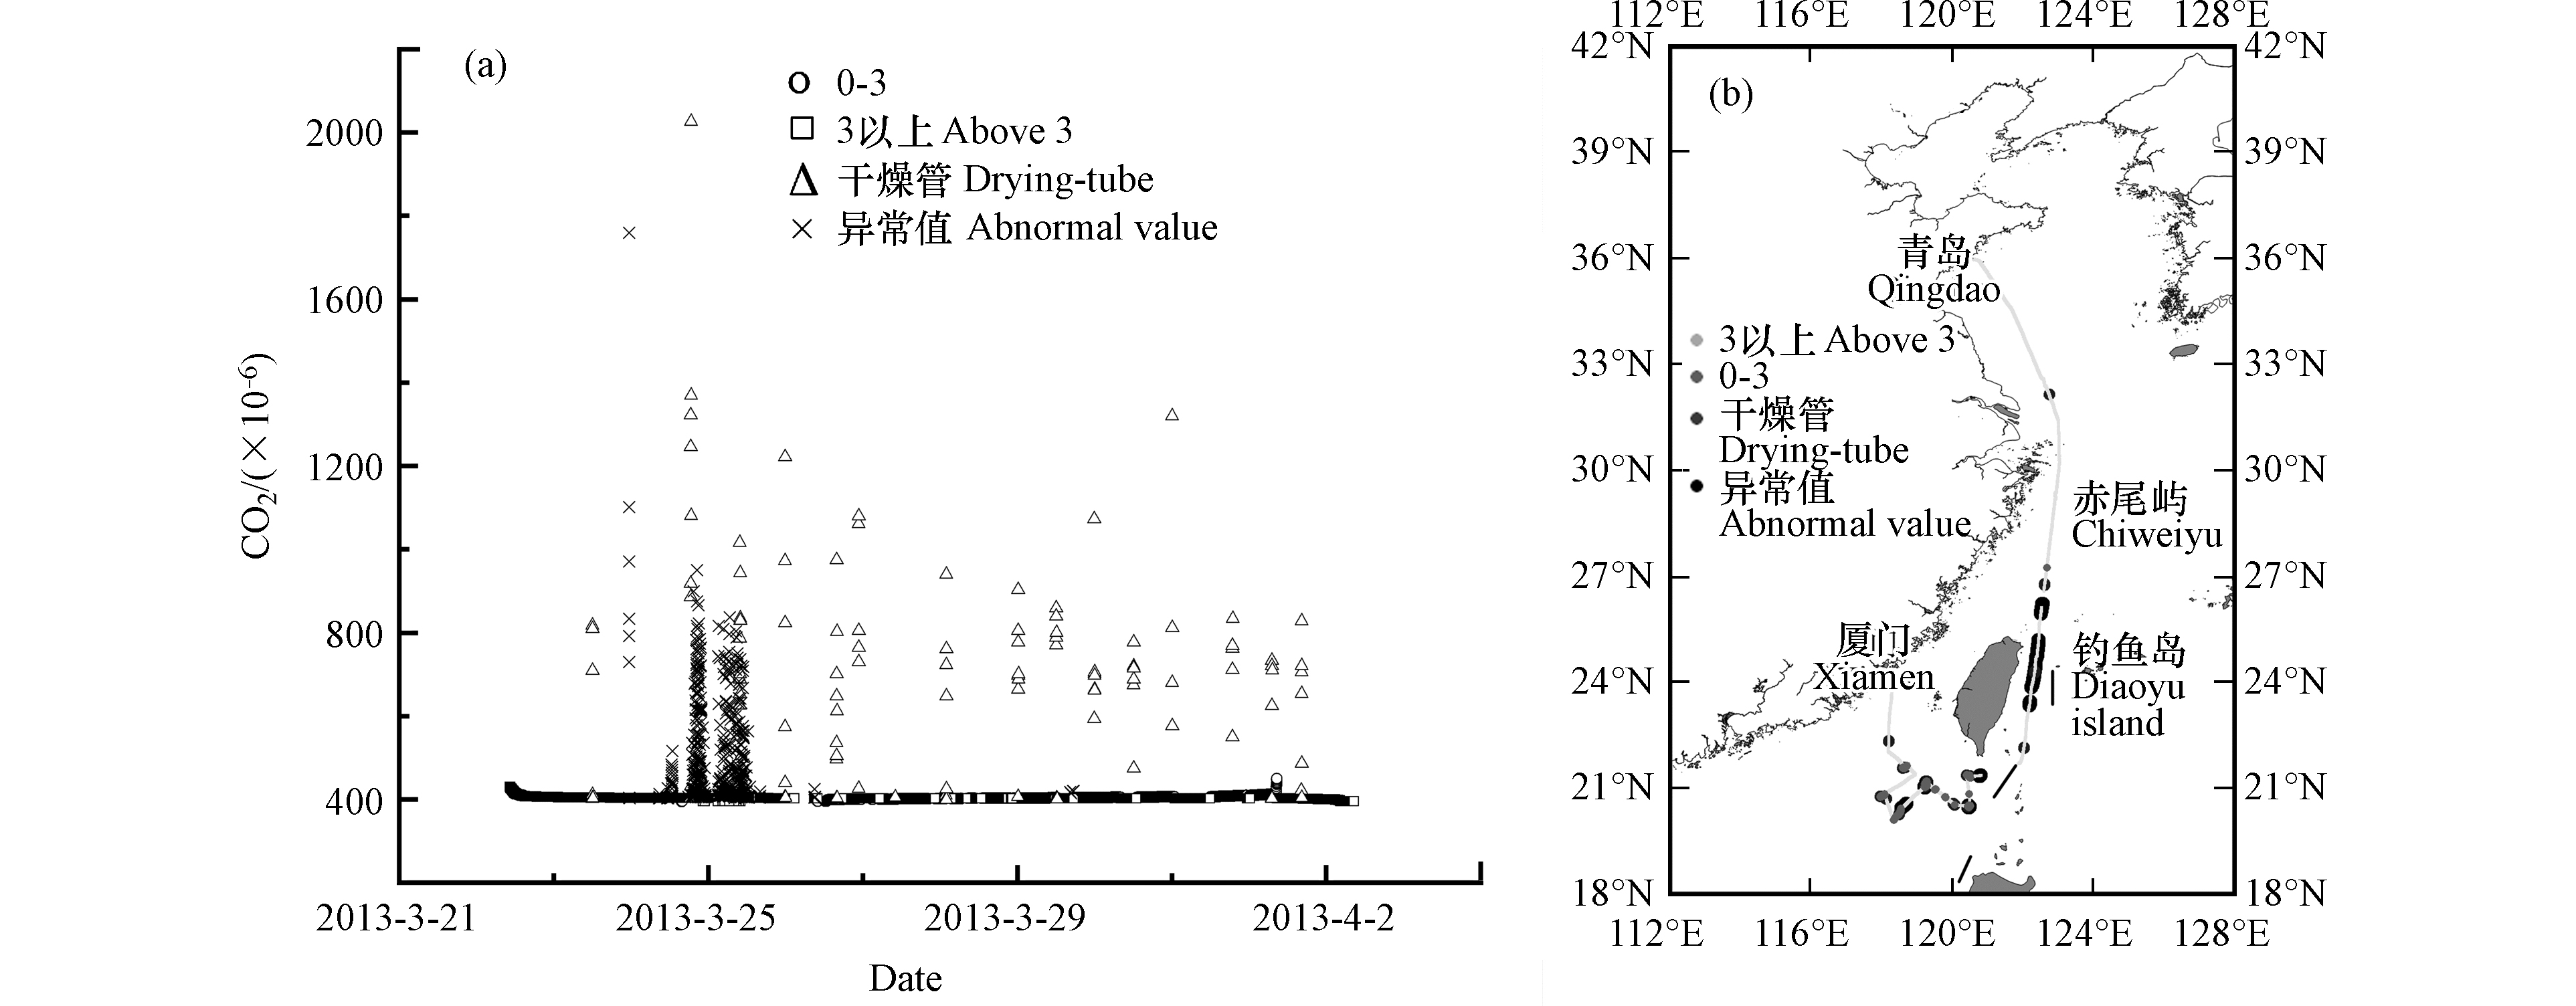
质控后的走航观测数据如图7所示。受更换干燥管和人为活动排放及仪器故障影响的异常观测数据被有效标记。同时,船舶排放是海洋大气温室气体和污染物的重要来源及研究热点,被标记为受船舶烟囱排放影响的观测数据,可用于估算调查船对海洋大气CO2的贡献研究[4]。数据筛分处理后,海洋大气本底观测数据保留率达55.28%,可作为观测海域自然状态下海洋大气CO2混合比水平,用于其时空分布特征,海-陆长距离输送及海-气交换通量等源汇过程分析研究[8-9]。
如图8所示,本研究中,经筛分处理后的海洋大气本底CO2混合比范围为402.65×10⁻⁶至405.22×10⁻⁶,平均值为(403.52 ± 0.65)×10−6,高于同纬度范围内MBL的CO2混合比范围399.68×10⁻⁶至400.73×10⁻⁶和平均值(400.17 ± 0.37)×10−6,但都具有一致的纬向分布特征,即随纬度升高CO2混合比有明显上升的趋势,表明我国近海与北半球同纬度范围大气CO2混合比自然分布特征具有相似性。同时,本研究观测结果与临近调查船航线的TAP,YON和DSI大气观测站同期观测结果(分别为404.38×10⁻⁶、403.07×10⁻⁶和402.66×10⁻⁶)基本一致,表明本研究观测数据与上述3站的观测数据具有可比性。
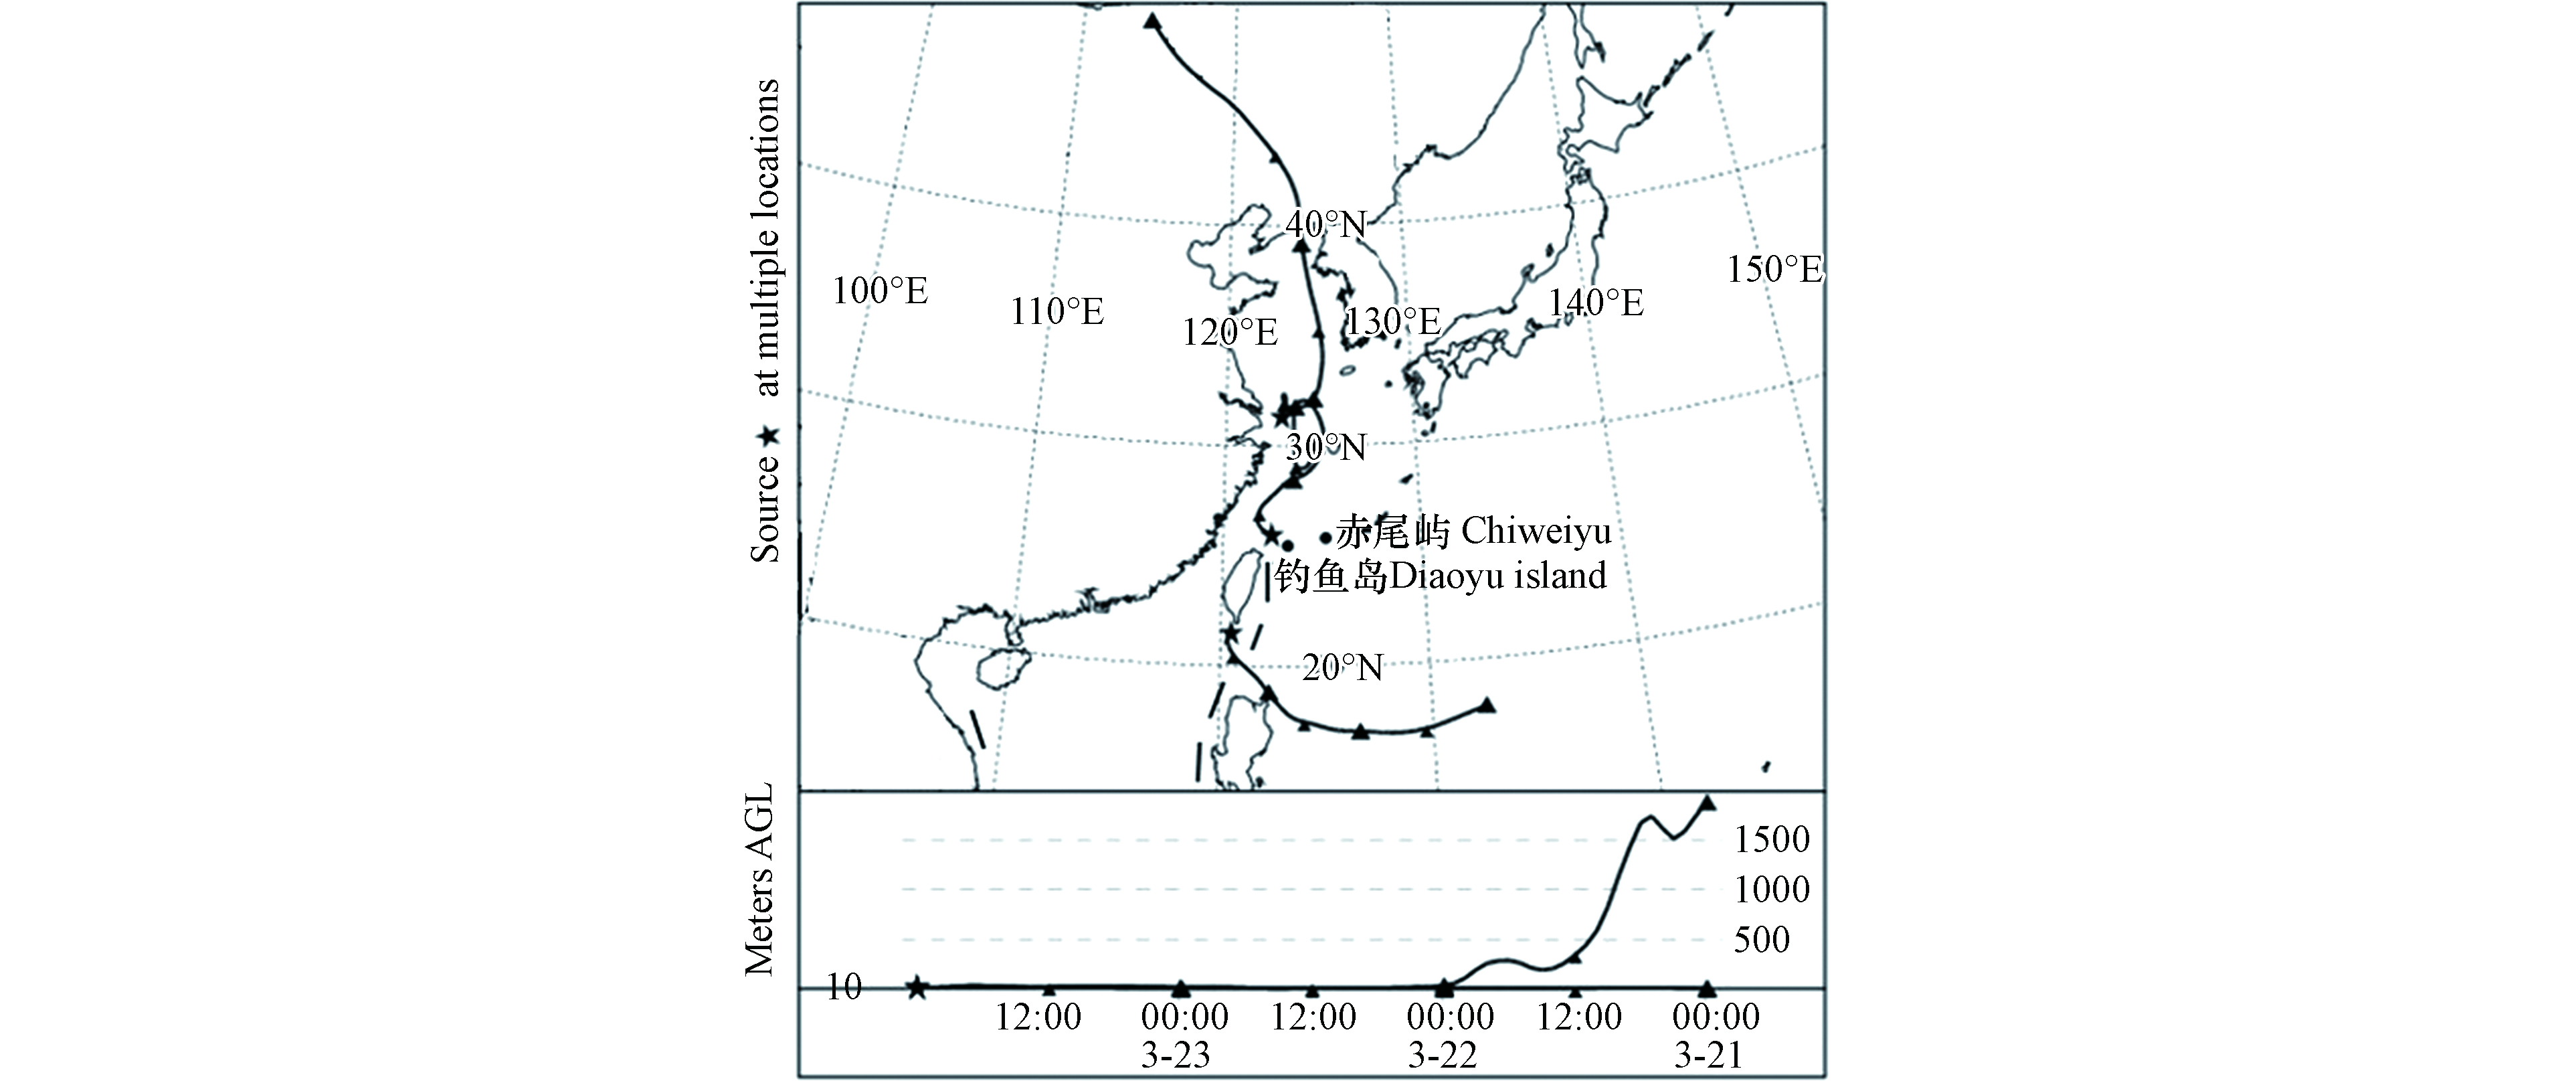
本研究大气本底CO2混合比观测结果与MBL模拟的CO2混合比之差随纬度增加而上升。气团后向轨迹计算结果显示,观测期间,南黄海和东海海域主要受冬季风驱动的来自东亚陆地气团输送的影响(图9)。受经济快速增长和强烈人为活动影响,东亚陆地已成为全球最强的大气CO2排放源之一[8],因此陆-海气团输送过程导致黄海和东海大气CO2混合比的抬升,并高于北半球同纬度大气CO2混合比水平[31]。而南海东北部主要受信风驱动的来自太平洋开阔海域气团输送的影响。太平洋开阔海域无显著人为活动,下垫面单一,且是大气CO2的弱汇[9]。因此,海洋大气CO2混合比较低[32]。在其气团输送影响下,南海东北部海洋大气CO2混合比与同纬度平均水平更接近。
综上所述,我国近海大气CO2的纬向分布与北半球MBL的CO2模拟结果具有一致性,但受来自欧亚大陆气团的影响,导致我国近海与MBL的CO2混合比之差随纬度增加而上升,从而增强了纬向分布[33]。
-
(1)本研究基于2013年春季我国近海大气CO2船基走航连续观测数据,利用航次日志、气象资料、拉依达准则和后向轨迹模型等,优化建立了数据质控和筛分方法,可有效标记船舶排放、海-陆输送,人为操作和仪器故障等自然和人为过程对观测数据的影响。
(2)航测期间,受船体排放影响的观测数据占比39.84%;受更换干燥管等人为操作过程影响的观测数据占比1.01%;因仪器故障导致缺测的观测数据占比3.87%;海洋大气CO2本底观测数据占比55.28%。
(3)海洋大气CO2本底观测数据与临近航线的TAP、YON和DSI站同期观测结果基本一致,与北半球同纬度范围内模式模拟的MBL-CO2数据具有一致的纬向分布特征,但受陆-海气团输送影响,本研究CO2观测结果与MBL-CO2的差值随纬度增加而上升。
致谢:感谢国家自然科学基金委2013年南海东北部综合科学考察航次(航次批准号: NORC2013-05)。感谢Dlugokencky E. J.博士和及其他工作人员提供的与那国岛观测站,泰安站和东沙站观测数据。东方红2号和国家海洋环境监测中心工作人员对本研究提供协助,在此一并致谢。
海洋大气二氧化碳船基走航连续观测数据的质量控制方法
Study of data quality assurance/control on the shipborne continuous CO2 observations
-
摘要: 船基走航连续观测是掌握海洋大气温室气体含量及特征的重要方式之一。为准确掌握海表大气温室气体时空变率,必须建立科学的数据质量控制方法。本研究基于2013年春季在我国近海开展的海洋大气CO2船基走航连续观测数据,充分结合现场操作记录、气象要素、航速航向、拉依达准则和气团后向轨迹模拟结果等数据及技术手段,开展CO2观测数据的筛分处理方法研究。本研究优化建立的方法可标记仪器故障、人为操作和船体排放等因素导致的异常观测值。对走航期间近海CO2混合比分析结果显示,我国近海大气CO2的纬向分布与北半球MBL的CO2模拟结果具有一致性,但受来自欧亚大陆气团的影响,导致我国近海与MBL的CO2混合比之差随纬度增加而上升。Abstract: Shipborne continuous observation is widely adopted as an important approach to understand the variation of greenhouse gases in the marine boundary layer (MBL). In order to precisely understand the spatiotemporal variation of greenhouse gases in the MBL, a scientific data quality control approach should be established. Based on the shipborne continuous CO2 observations over the China shelf seas in spring of 2013, in this study, a new data filtering method was developed by considering the operation log, meteorological parameters, pauta criterion, and air mass transport, which could efficiently mark the CO2 observations influenced by instrument malfunction, ship emissions, and refillting of drying-tube, etc. Our filtered results showed that the latitudinal distribution of atmospheric CO2 in China shelf seas agreed well with the simulated distribution of MBL-CO2 in northern hemisphere. Additionally, we concluded that, the CO2 discrepancy between the China shelf seas and MBL enlarged along with increasing latitude, which was likely due to the transportion of air mass from the Eurasian continent.
-
Key words:
- marine boundary layer /
- carbon dioxide /
- shipborne observation /
- data quality control /
- data filtering
-

-
-
[1] WMO. Greenhouse Gas Bulletin: The state of greenhouse gases in the atmosphere based on global observations through 2019[EB/OL]. [2021-5-13] 2020,http:// www.wmo.int/pages/prog/arep/gaw/ghg/ghgbull06en.html. [2] 浦静姣, 徐宏辉, 顾骏强, 等. 长江三角洲背景地区CO2浓度变化特征研究 [J]. 中国环境科学, 2012, 32(6): 973-979. doi: 10.3969/j.issn.1000-6923.2012.06.003 PU J J, XU H H, GU J Q, et al. Study on the concentration variation of CO2 in the background area of Yangtze River Delta [J]. China Environmental Science, 2012, 32(6): 973-979(in Chinese). doi: 10.3969/j.issn.1000-6923.2012.06.003
[3] CROSSON E R. A cavity ring-down analyzer for measuring atmospheric levels of methane, carbon dioxide, and water vapor [J]. Applied Physics B, 2008, 92(3): 403-408. doi: 10.1007/s00340-008-3135-y [4] LAW C S, BREVIERE E, LEEUWET G D, et al. Evolving research directions in surface ocean-lower atmosphere (SOLAS) science [J]. Environmental Chemistry, 2013, 10(1): 1-16. doi: 10.1071/EN12159 [5] MATSUEDA H, INOUE H Y, ISHII M, et al. Atmospheric methane over the north Pacific from 1987 to 1993 [J]. Geochemical Journal, 1992, 30(1): 1-15. [6] BRANTLEY H L, THOMA E D, SQUIER W C, et al. Assessment of methane emissions from oil and gas production pads using mobile measurements [J]. Environmental Science & Technology, 2014, 48(24): 14508-14515. [7] NARA H, TANIMOTO H, TOHJIMA Y, et al. Emissions of methane from offshore oil and gas platforms in Southeast Asia [J]. Scientific Reports, 2014, 4: 6503. [8] LIU Y S, ZHOU L X, TANS P P, et al. Ratios of greenhouse gas emissions observed over the Yellow Sea and the East China Sea [J]. The Science of the Total Environment, 2018, 633: 1022-1031. doi: 10.1016/j.scitotenv.2018.03.250 [9] ZANG K P, ZHOU L X, WANG J Y, et al. Carbon dioxide and methane in the China sea shelf boundary layer observed by cavity ring-down spectroscopy [J]. Geophysical Research, 2017, 34(10): 2233-2244. [10] ZANG K P, ZHANG G, WANG J Y. Methane emissions from oil and gas platforms in the Bohai Sea, China[J]. Environmental Pollution, 2020, 263(Pt B): 114486. [11] 孔少飞, 陆炳, 韩斌, 等. 天津近海大气中CH4, N2O和CO2季节变化分析 [J]. 中国科学:地球科学, 2010, 40(5): 666-676. KONG S F, LU B, HAN B, et al. Seasonal variation analysis of atmospheric CH4, N2O and CO2 in Tianjin offshore area [J]. Science China Earth Science, 2010, 40(5): 666-676(in Chinese).
[12] 臧昆鹏, 方双喜, 周凌晞, 等. 水汽对光腔衰荡光谱系统(CRDS)法测定CH4的影响 [J]. 环境化学, 2012, 31(11): 1816-1820. ZANG K P, FANG S X, ZHOU L X, et al. The influence of water wapor on the measurement of CH4 by CRDS system [J]. Environmental Chemistry, 2012, 31(11): 1816-1820(in Chinese).
[13] 吕洪刚, 王海燕, 姜亦飞, 等. 西沙大气二氧化碳浓度变化特征研究 [J]. 海洋学报(中文版), 2015, 37(6): 21-30. LV H G, WANG H Y, JIANG Y F, et al. Study on the concentration variation of CO2 in the background area of Xisha [J]. Acta Oceanologica Sinica, 2015, 37(6): 21-30(in Chinese).
[14] 方双喜, 周凌晞, 臧昆鹏, 等. 光腔衰荡光谱(CRDS)法观测我国4个本底站大气CO2 [J]. 环境科学学报, 2011, 31(3): 624-629. FANG S X, ZHOU L X, ZANG K P, et al. Measurement of atmospheric CO2 mixing ratio by cavity ring-down spectroscopy (CRDS) at the 4 background stations in China [J]. Acta Scientiae Circumstantiae, 2011, 31(3): 624-629(in Chinese).
[15] 詹力扬, 陈立奇. 南大洋大气氧化亚氮分布特征 [J]. 极地研究, 2007, 19(1): 49-60. ZHAN L Y, CHEN L Q. Distributions of nitrous oxide mixing ratios in the atmosphere over the southern ocean [J]. Chinese Journal of Polar Research, 2007, 19(1): 49-60(in Chinese).
[16] 刘云松, 周凌晞, 臧昆鹏, 等. 光腔衰荡光谱法走航连续观测海表大气中氧化亚氮 [J]. 环境科学学报, 2018, 38(9): 3482-3487. doi: 10.13671/j.hjkxxb.2018.0259 LIU Y S, ZHOU L X, ZANG K P, et al. Continuous measurement of atmospheric nitrous oxide by cavity ring-down spectroscopy technique over the China Seas [J]. Acta Scientiae Circumstantiae, 2018, 38(9): 3482-3487(in Chinese). doi: 10.13671/j.hjkxxb.2018.0259
[17] 臧昆鹏, 周凌晞, 刘云松, 等. 春季中国近海海表大气中六氟化硫的分布特征 [J]. 海洋环境科学, 2018, 37(3): 418-423. doi: 10.12111/j.cnki.mes20180316 ZANG K P, ZHOU L X, LIU Y S, et al. Distribution of sulfur hexafluoride in the China sea-shelf boundary layer in spring [J]. Marine Environmental Science, 2018, 37(3): 418-423(in Chinese). doi: 10.12111/j.cnki.mes20180316
[18] 张敏, 袁辉. 拉依达(PAUTA)准则与异常值剔除 [J]. 郑州工业大学学报, 1997(1): 87-91. ZHANG M, YUAN H. The pauta criterion and rejecting the abnormal value [J]. Journal of Zhengzhou University of Technology, 1997(1): 87-91(in Chinese).
[19] 夏玲君, 刘立新, 李柏贞, 等. 我国中部地区大气CO2柱浓度时空分布 [J]. 中国环境科学, 2018, 38(8): 2811-2819. doi: 10.3969/j.issn.1000-6923.2018.08.003 XIA L J, LIU L X, LI B Z, et al. Spatial and temporal distribution characteristics of atmospheric CO2 in central China [J]. China Environmental Science, 2018, 38(8): 2811-2819(in Chinese). doi: 10.3969/j.issn.1000-6923.2018.08.003
[20] 占明锦, 孙俊英, 张养梅, 等. 气团来源对瓦里关地区颗粒物数谱分布的影响 [J]. 冰川冻土, 2009, 31(4): 659-663. ZHAN M J, SUN J Y, ZHANG Y M, et al. The influence of air mass sources on the particle number concentration and the size distribution at Mt. Waliguan [J]. Journal of Glaciology and Geocryology, 2009, 31(4): 659-663(in Chinese).
[21] 张近扬, 宋韶华, 许睿, 等. 基于后向气团轨迹的区域大气污染颗粒物来源分析 [J]. 中国环境监测, 2017, 33(2): 42-46. doi: 10.19316/j.issn.1002-6002.2017.02.07 ZHANG J Y, SONG S H, XU R, et al. Source of airborne particulate matter in Guilin based on backward trajectory model [J]. Environmental Monitoring in China, 2017, 33(2): 42-46(in Chinese). doi: 10.19316/j.issn.1002-6002.2017.02.07
[22] 张芳. 大气CO2、CH4和CO浓度资料再分析及源汇研究[D]. 北京: 中国气象科学研究院, 2011. ZHANG F. Re-analysis and evaluation of atmospheric carbon dioxide(CO2), methane(CH4) and carbon monoxide(CO) at mount Waliguan, China[D]. Beijing: Chinese Academy of Meteorological Sciences, 2011 (in Chinese).
[23] 栾天, 周凌晞, 方双喜, 等. 龙凤山本底站大气 CO2数据筛分及浓度特征研究 [J]. 环境科学, 2014, 35(8): 2864-2870. LUAN T, ZHOU L X, FANG S X, et al. Atmospheric CO2 data filtering method and characteristics of the molar fractions at the Longfengshan WMO/GAW regional station in China [J]. Environmental Science, 2014, 35(8): 2864-2870(in Chinese).
[24] FANG S X, TANS P P, STEINBACHER M, et al. Comparison of the regional CO2 mole fraction filtering approaches at a WMO/GAW regional station in China [J]. Atmospheric Measurement Techniques, 2015, 8(12): 5301-5313. doi: 10.5194/amt-8-5301-2015 [25] 张芳, 周凌晞, 刘立新, 等. 瓦里关气相色谱法大气CO2和CH4在线观测数据处理分析 [J]. 环境科学, 2010, 31(10): 2267-2272. ZHANG F, ZHOU L X, LIU L X, et al. Data processing and QA/QC of atmosphere CO2 and CH4 concentrations by a method of GC-FID in situ measurement at waliguan station [J]. Chinese Journal of Environmental Science, 2010, 31(10): 2267-2272(in Chinese).
[26] 臧昆鹏, 周凌晞, 方双喜, 等. 新型CO2和CH4混合标气标校流程及方法 [J]. 环境化学, 2011, 30(2): 511-516. ZANG K P, ZHOU L X, FANG S X, et al. A new system for calibration and propagation of mixed CO2 and CH4 standards [J]. Environmental Chemistry, 2011, 30(2): 511-516(in Chinese).
[27] CHEN D S, WANG X T, NELSON P, et al. Ship emission inventory and its impact on the PM2.5 air pollution in Qingdao Port, North China [J]. Atmospheric Environment, 2017, 166: 351-361. doi: 10.1016/j.atmosenv.2017.07.021 [28] 方双喜, 周凌晞, 栾天, 等. 浙江临安大气本底站CO浓度及变化特征 [J]. 环境科学, 2014, 35(7): 2454-2459. doi: 10.13227/j.hjkx.2014.07.003 FANG S X, ZHOU L X, LUAN T, et al. Distribution of co at Lin'an station in Zhejiang Province [J]. Environmental Science, 2014, 35(7): 2454-2459(in Chinese). doi: 10.13227/j.hjkx.2014.07.003
[29] ZANG K P, ZHANG G, XU X M, et al. Impact of air-sea exchange on the spatial distribution of atmospheric methane in the Dalian Bay and adjacent coastal area, China [J]. Chemosphere, 2020, 251: 126412. doi: 10.1016/j.chemosphere.2020.126412 [30] 方双喜, 李邹, 周凌晞, 等. 云南香格里拉本底站大气CH4体积分数及变化特征 [J]. 环境科学学报, 2012, 32(10): 2568-2574. FANG S X, LI Z, ZHOU L X, et al. Variation of CH4 concentrations at Yunnan Xianggelila background station in China [J]. Acta Scientiae Circumstantiae, 2012, 32(10): 2568-2574(in Chinese).
[31] 赵恒, 王体健, 江飞, 等. 利用后向轨迹模式研究TRACE-P期间香港大气污染物的来源 [J]. 热带气象学报, 2009, 25(2): 181-186. doi: 10.3969/j.issn.1004-4965.2009.02.008 ZHAO H, WANG T J, JIANG F, et al. Investigation into the source of air pollutants to Hong Kong by using backward trajectory method during the TRACE-P campaign [J]. Journal of Tropical Meteorology, 2009, 25(2): 181-186(in Chinese). doi: 10.3969/j.issn.1004-4965.2009.02.008
[32] 徐晓斌, 刘希文, 林伟立. 输送对区域本底站痕量气体浓度的影响 [J]. 应用气象学报, 2009, 20(6): 656-664. doi: 10.3969/j.issn.1001-7313.2009.06.002 XU X B, LIU X W, LIN W L. Impacts of air parcel transport on the concentrations of trace gases at regional background stations [J]. Journal of Applied Meteorological Science, 2009, 20(6): 656-664(in Chinese). doi: 10.3969/j.issn.1001-7313.2009.06.002
[33] SABINE C L, FEELY R A, GRUBER N, et al. The oceanic sink for anthropogenic CO2 [J]. Science, 2004, 305(5682): 367-371. doi: 10.1126/science.1097403 -


 下载:
下载:
